. 2023 Oct 26;24(21):15593.
doi: 10.3390/ijms242115593.

Transcriptome and Physiological Analysis of Rapeseed Tolerance to Post-Flowering Temperature Increase

Affiliations

Transcriptome and Physiological Analysis of Rapeseed Tolerance to Post-Flowering Temperature Increase

Javier Canales et al. Int J Mol Sci. .

Abstract

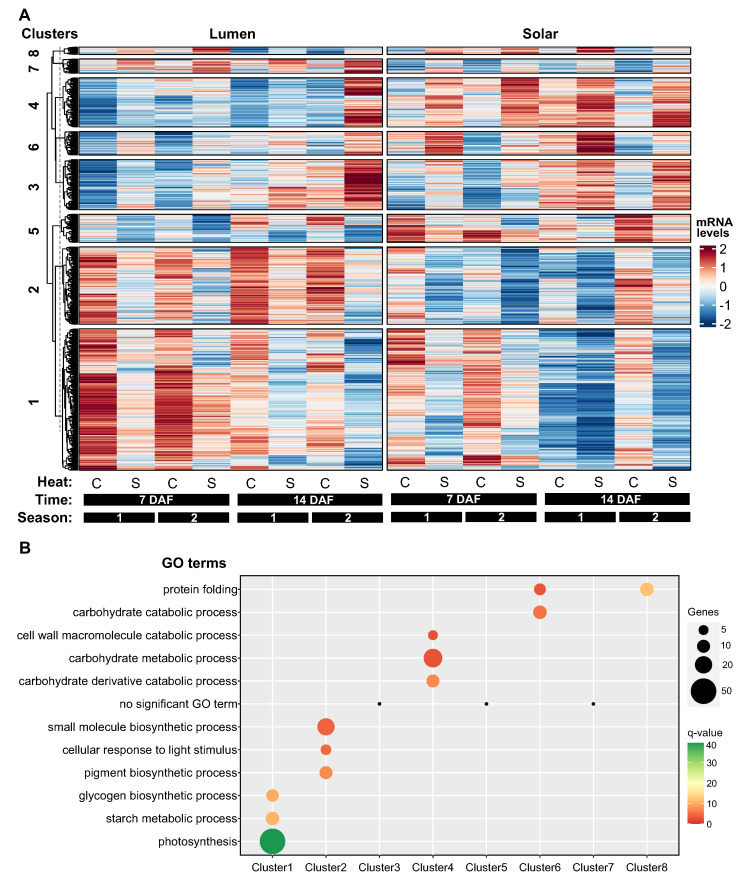
Climate-change-induced temperature fluctuations pose a significant threat to crop production, particularly in the Southern Hemisphere. This study investigates the transcriptome and physiological responses of rapeseed to post-flowering temperature increases, providing valuable insights into the molecular mechanisms underlying rapeseed tolerance to heat stress. Two rapeseed genotypes, Lumen and Solar, were assessed under control and heat stress conditions in field experiments conducted in Valdivia, Chile. Results showed that seed yield and seed number were negatively affected by heat stress, with genotype-specific responses. Lumen exhibited an average of 9.3% seed yield reduction, whereas Solar showed a 28.7% reduction. RNA-seq analysis of siliques and seeds revealed tissue-specific responses to heat stress, with siliques being more sensitive to temperature stress. Hierarchical clustering analysis identified distinct gene clusters reflecting different aspects of heat stress adaptation in siliques, with a role for protein folding in maintaining silique development and seed quality under high-temperature conditions. In seeds, three distinct patterns of heat-responsive gene expression were observed, with genes involved in protein folding and response to heat showing genotype-specific expression. Gene coexpression network analysis revealed major modules for rapeseed yield and quality, as well as the trade-off between seed number and seed weight. Overall, this study contributes to understanding the molecular mechanisms underlying rapeseed tolerance to heat stress and can inform crop improvement strategies targeting yield optimization under changing environmental conditions.

Keywords: Brassica napus; gene coexpression network analysis; heat stress; post-flowering temperature increase; seed number; seed weight; seed yield; transcriptome analysis.


Conflict of interest statement

The authors declare no conflict of interest. The funders had no role in the design of the study; in the collection, analyses, or interpretation of data; in the writing of the manuscript; or in the decision to publish the results.

Figures

Figure 1
Figure 1
Response of seed yield, seed number, thousand seed weight, and quality traits (seed oil and protein concentrations) across seasons due to heat stress relative to the control. Asterisks indicate significant effect of heat stress treatment on the control by using Fisher’s LSD test (p < 0.05).
Figure 2
Figure 2
Multivariate analysis of RNA-seq data in siliques and seeds under heat stress. The bar plots display the number of differentially expressed genes (DEGs) attributed to various factors and their interactions in (A) siliques and (B) seeds based on sleuth analysis (q < 0.01). Genotype is the predominant factor affecting gene expression, whereas heat treatment has a more pronounced effect on siliques than seeds, indicating tissue-specific responses to temperature stress. Data were obtained from field experiments conducted in Valdivia, Chile, using two rapeseed genotypes (Lumen and Solar) subjected to control and heat stress conditions.
Figure 3
Figure 3
Hierarchical clustering analysis reveals distinct patterns of heat-responsive gene expression in siliques. (A) Heatmap showing hierarchical clustering of 1698 heat-responsive genes in siliques into eight distinct clusters based on their expression profiles across samples using ComplexHeatmap [26]. Rows represent genes and columns represent samples from two genotypes (Lumen and Solar), two heat treatments (control and heat stress), two time points (7 and 14 DAF), and two seasons. (B) Enrichment analysis of biological processes for each gene cluster. The number of genes and FDR-adjusted p-values are shown for the top enriched terms in each cluster. The black dots positioned above Clusters 3, 5, and 7 denote an absence of statistically significant GO terms. Clusters 1, 2, and 5 contain genes downregulated by heat stress and involved in photosynthesis, pigment metabolism, and carbohydrate metabolism. Clusters 3, 4, 6, 7, and 8 show heat-induced genes associated with various processes including protein folding and cell wall metabolism. Cluster 8 displays a genotype-specific temporal response, with decreased expression of protein folding genes in Lumen but not Solar at 14 DAF under heat stress.
Figure 4
Figure 4
Hierarchical clustering reveals three distinct patterns of heat-responsive gene expression in rapeseed seeds. (A) Heatmap visualization of 202 differentially expressed genes (q-value < 0.01) in response to heat treatment, clustered into three groups with distinct expression profiles. Rows represent genes and columns represent different genotype (Lumen or Solar), timepoint (7 or 14 days after flowering), season (1 or 2), and temperature treatment (control or heat stress) conditions. Normalized expression values are color-coded based on row z-score. Cluster 1 (81 genes) shows downregulation by heat stress. Cluster 2 (63 genes) exhibits upregulation by heat. Cluster 3 (58 genes) displays genotype-specific responses to heat. (B) Gene ontology enrichment analysis indicates Cluster 1 is involved in glycolipid metabolism and phosphate starvation response, Cluster 2 in carboxylic acid metabolism and sucrose biosynthesis, and Cluster 3 in protein folding and response to heat. The small dot positioned above Cluster 1 denote an absence of statistically significant GO terms.
Figure 5
Figure 5
Genotype-dependent effects of heat stress on photosynthesis-related genes in siliques. (A) Venn diagrams showing the number of genes significantly regulated by heat, genotype, or both factors in siliques and seeds. Only siliques showed a significant overlap between the two factors (p < 0.05, GeneOverlap test). (B) Histogram showing the distribution of the 121 genes that were regulated by heat and genotype in siliques across clusters 1 and 2, which contain photosynthesis and light response genes. (C) Expression profiles of the photosynthesis-related genes SBPase (cluster 1) and INAP1 (cluster 2) in silique samples under control and heat conditions. SBPase and INAP1 mRNA levels were consistently higher in the Lumen genotype compared to Solar under heat stress based on RNA-seq data, suggesting improved maintenance of photosynthetic gene expression in the heat tolerant Lumen variety. Bars represent means ± SE (n = 3). Asterisks indicate significant differences between genotypes (NS, not significant, * p < 0.05, ** p < 0.01, *** p < 0.001).
Figure 6
Figure 6
Correlation heatmap of gene coexpression modules with yield and quality traits in rapeseed. Heatmap showing Pearson correlation coefficients between module eigengenes and phenotypic traits related to plant growth, seed yield, and quality. The modules were generated by weighted gene coexpression network analysis of transcriptomic data from 28 samples of seeds at 7 days after flowering. Modules are grouped into categories and ordered based on strongest correlations. Red indicates a positive correlation, blue indicates a negative correlation. The largest modules positively correlated with protein content (lightblue3, firebrick), oil content (lightskyblue2), seed number (indianred2), and seed weight (palevioletred) are highlighted. This systems-level analysis reveals major coexpression modules associated with key agronomic traits that determine yield and quality in rapeseed. The module names (e.g., lightblue3, firebrick, indianred2) correspond to coexpression modules identified by the WGCNA algorithm.
Figure 7
Figure 7
Co-expression network analysis reveals regulators of seed number and weight tradeoff. (A) Correlation plot showing the relationship between average expression of indianred2 module genes and seed number/weight across samples. Each point represents the mean expression level of module genes for a sample, with red indicating seed number and blue indicating seed weight. (B) Enriched Gene Ontology terms for the indianred2 module related to translation, protein targeting, and other functions. The x-axis shows statistical significance. GO term enrichment analysis was performed using g:Profiler with a q-value cutoff of 0.05 (C) Inferred gene regulatory network for the indianred2 module. The network was constructed using GENIE3, ARACNE, and CLR algorithms on gene expression data. Nodes represent transcription factors (triangles) and target genes (circles). The 5 transcription factors with highest connectivity (degree) are labeled. Node size corresponds to degree.
Figure 8
Figure 8
Co-expression module associated with seed weight in rapeseed. (A) Scatterplot showing the negative correlation between seed number and the expression pattern of genes in the palevioletred module (r = −0.77, p < 0.0001). Each dot represents a specific sample. (B) Enriched gene ontology (GO) terms for the palevioletred module related to intracellular transport, mRNA metabolism, signaling, and chromatin remodeling. The bar plot shows the number of genes annotated to each term out of the 2416 genes in the module. GO term enrichment analysis was performed using g:Profiler with a q-value cutoff of 0.05. (C) Regulatory network showing predicted transcription factor (TF) regulators of the palevioletred module. The network was constructed using GENIE3, ARACNE, and CLR algorithms on gene expression data. The five transcription factors with highest connectivity (degree) are labeled. Node size corresponds to degree.

References

    1. Cheng W., Sakai H., Yagi K., Hasegawa T. Interactions of elevated [CO2] and night temperature on rice growth and yield. Agric. For. Meteorol. 2009;149:51–58. doi: 10.1016/j.agrformet.2008.07.006. - DOI
    1. Kim H.R., You Y.H. Effects of elevated CO2 concentration and increased temperature on leaf related-physiological responses of Phytolacca insularis (native species) and Phytolacca americana (invasive species) J. Ecol. Environ. 2010;33:195–204. doi: 10.5141/JEFB.2010.33.3.195. - DOI
    1. Ray D.K., West P.C., Clark M., Gerber J.S., Prishchepov A.V., Chatterjee S. Climate change has likely already affected global food production. PLoS ONE. 2019;14:e0217148. doi: 10.1371/journal.pone.0217148. - DOI - PMC - PubMed
    1. IPCC . Climate Change 2021—The Physical Science Basis: Working Group I Contribution to the Sixth Assessment Report of the Intergovernmental Panel on Climate Change. Cambridge University Press; Cambridge, UK: 2023. - DOI
    1. Rivelli G.M., Long M.E.F., Abeledo L.G., Calderini D.F., Miralles D.J., Rondanini D.P. Assessment of heat stress and cloudiness probabilities in post-flowering of spring wheat and canola in the Southern Cone of South America. Theor. Appl. Climatol. 2021;145:1485–1502. doi: 10.1007/s00704-021-03694-x. - DOI