. 2023 Oct 26;24(21):15626.
doi: 10.3390/ijms242115626.

Resistance to 2-Hydroxy-Flutamide in Prostate Cancer Cells Is Associated with the Downregulation of Phosphatidylcholine Biosynthesis and Epigenetic Modifications

Affiliations

Resistance to 2-Hydroxy-Flutamide in Prostate Cancer Cells Is Associated with the Downregulation of Phosphatidylcholine Biosynthesis and Epigenetic Modifications

José María Mora-Rodríguez et al. Int J Mol Sci. .

Abstract

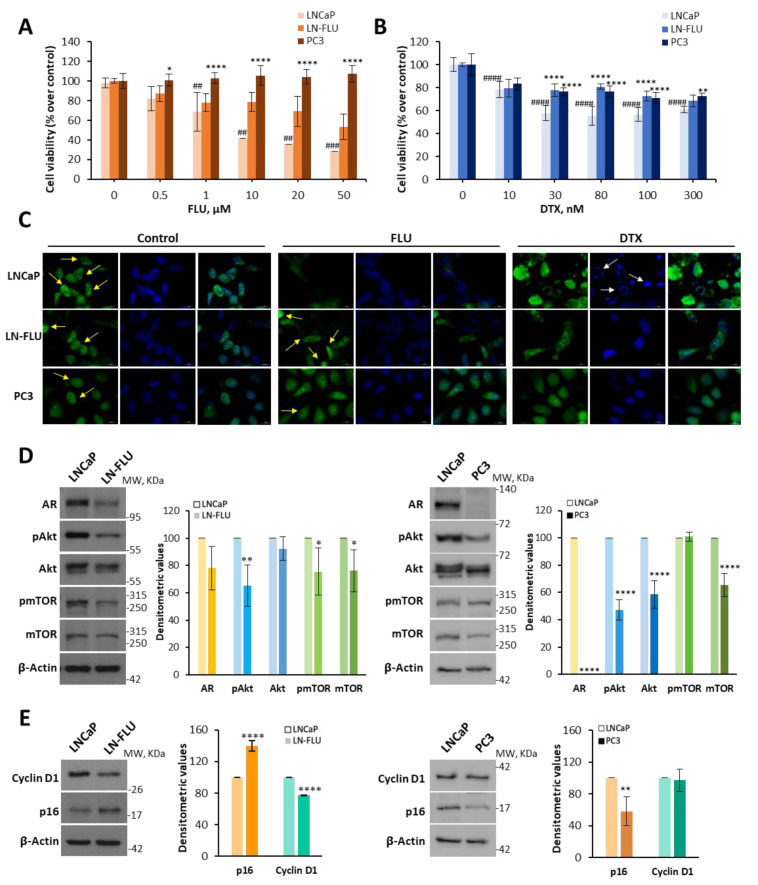
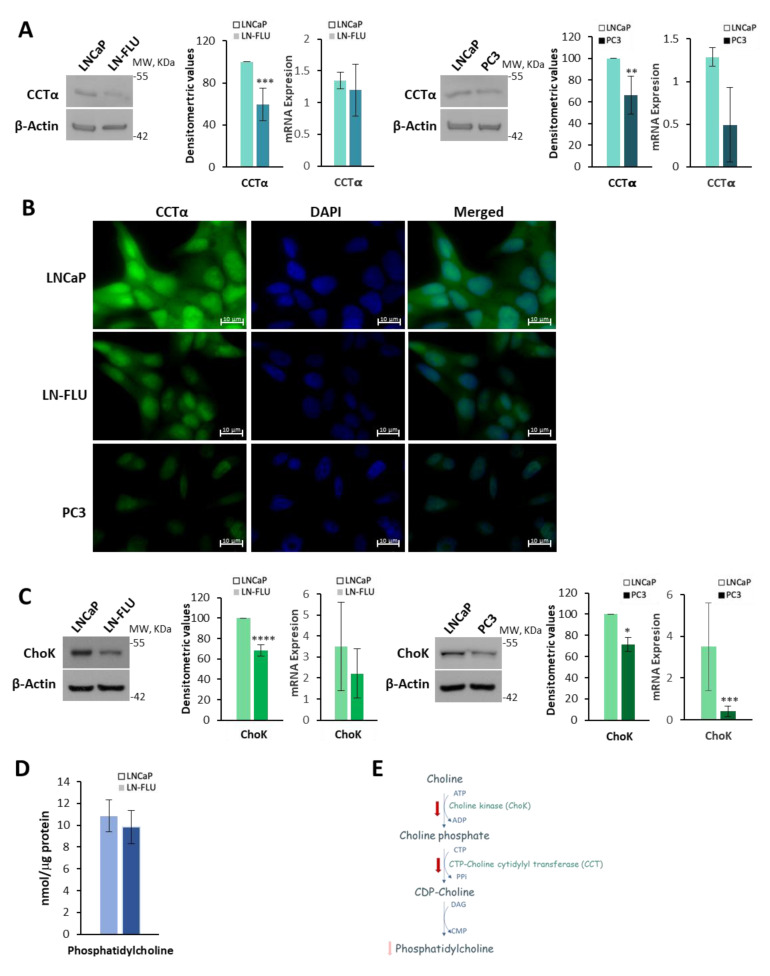
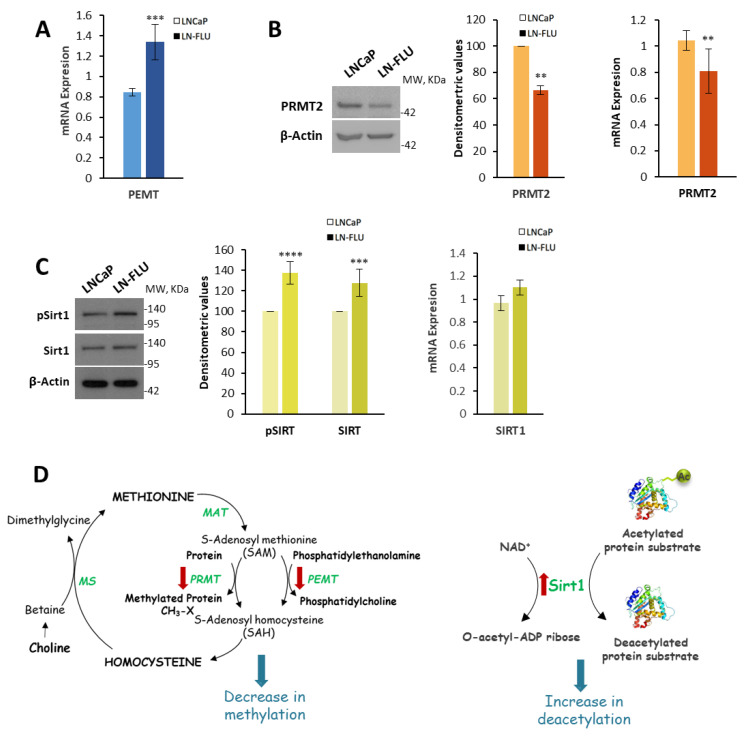
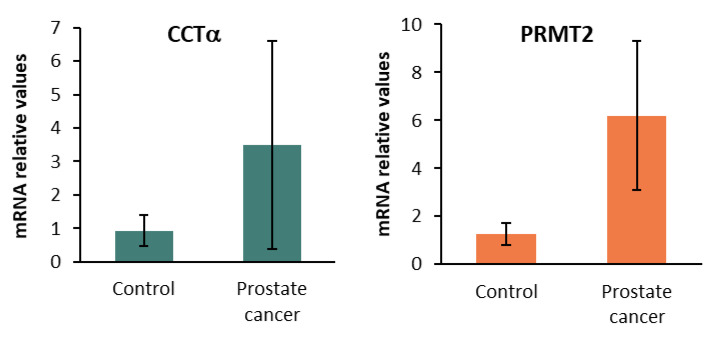
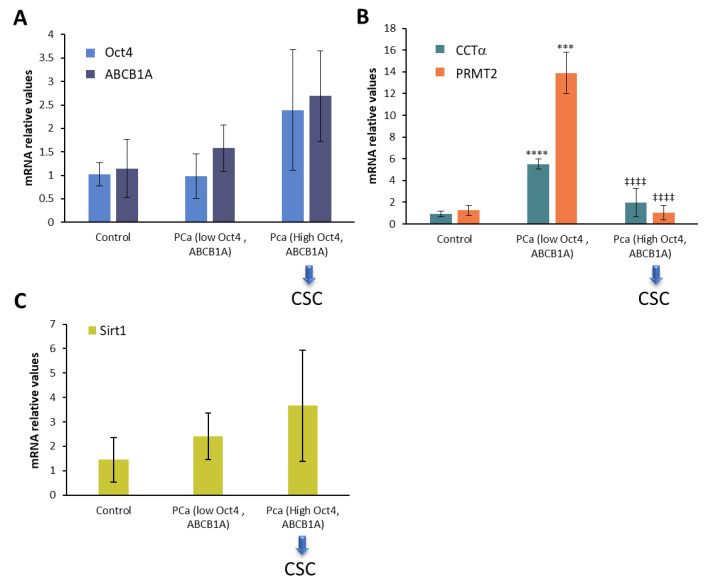
In this study, we examined the metabolic adaptations of a chemoresistant prostate cancer cell line in comparison to a sensitive cell line. We utilized prostate cancer LNCaP cells and subjected them to a stepwise increase in the antiandrogen 2-hydroxy-flutamide (FLU) concentration to generate a FLU-resistant cell line (LN-FLU). These LN-FLU cells displayed characteristics of cancer stem cells, exhibited drug resistance, and showed a significantly reduced expression of Cyclin D1, along with the overexpression of p16, pointing to a proliferation arrest. In comparing the cancer stem-like LN-FLU cells to the LNCaP cells, we observed a decrease in the expression of CTP-choline cytidylyl transferase α (CCTα), as well as a decline in choline kinase, suggesting altogether a downregulation of the phosphatidylcholine biosynthetic pathway. In addition, we found decreased levels of the protein methyl transferase PRMT2 and the upregulation of the histone deacetylase Sirtuin1 (Sirt1). Analysis of the human prostate cancer samples revealed similar results in a population with high expressions of the stem cell markers Oct4 and ABCB1A1. Our findings suggest that the adaptation of prostate cancer cells to antiandrogens could induce reprogramming into stem cells that survive in a low phosphocholine metabolism and cell cycle arrest and display drug resistance.

Keywords: LNCaP cells; antiandrogens; dormant cells; flutamide; phosphatidylcholine metabolism; resistant prostate cancer.


Conflict of interest statement

The authors declare no conflict of interest.

Figures

Figure 1
Figure 1
LN-FLU cells exhibit resistance to chemotherapy and cell cycle arrest. (A) LNCaP, LN-FLU, and PC3 cells were treated with increasing concentrations of 2-hydroxy-flutamide (FLU) or (B) increasing concentrations of docetaxel (DTX) for 24 h. Cell viabilities were determined via MTT assay and are expressed as percentages with respect to the control (DMSO treatment). Data are shown as the mean ± SD of at least two independent experiments. (C) Fluorescence images of anti-BrdU assay of cell division and proliferation. BrdU assay was carried out after cells were treated with 50 μM 2-hydroxy-flutamide (FLU) or 300 nM docetaxel (DTX) for 24 h. The incorporated BrdU was stained with anti-BrdU monoclonal antibody and then with Alexa Fluor 488-conjugated secondary antibody (green color), and the cell nuclei were stained with DAPI (blue color). Yellow arrows show proliferating cells and white arrows show apoptotic bodies. (D) Levels of AR, phosphorylated and total Akt, and mTOR proteins determined via Western blot. (E) Levels of Cyclin D1 and p16 determined via Western blot. To the right of the Western blot images are the densitometric banding analyses represented as the mean ± SD of three different experiments. ## p < 0.01, ### p < 0.001, #### p < 0.0001 indicates significant differences between the treated and control cells via two-way ANOVA and Tukey’s multiple comparisons test. * p < 0.05, ** p < 0.01, **** p < 0.0001 indicate significant differences between sensitive and resistant cells via two-way ANOVA and Sidak’s multiple comparisons test.
Figure 2
Figure 2
LN-FLU cells show features of cancer stem cells. (A) Levels of CD133 and ALDH1A1 in LNCaP and LN-FLU cells determined via Western blot. β-Actin is shown as a loading control. A representative image of three different experiments is shown. Densitometric values (mean ± SD) relative to controls are shown on the right. (B) Quantification of Oct4, Nanog, and ABCB1A mRNA expressions via qPCR in parental LNCaP and resistant LN-FLU cells. Actin was used as a housekeeping gene. * p < 0.05, ** p < 0.01, **** p < 0.0001 indicate significant differences between the LNCaP and LN-FLU cells via two-way ANOVA and Sidak’s multiple comparisons test.
Figure 3
Figure 3
Study of the phosphatidylcholine biosynthetic pathway in LN-FLU and PC3 prostate cells. (A) Levels of CTP:choline cytidylyltransferase (CCTα) determined via Western blot and levels of CCTα mRNA determined via qPCR. Densitometric analysis of the Western blot bands is shown on the right of the image. Results are shown as the mean ± SD of three independent experiments. (B) Labeling of CCTα (green) in LNCaP, LN-FLU, and PC3 cells observed with fluorescence microscopy. Nuclei were labeled with DAPI (blue). A representative image of two different experiments is shown. (C) Levels of choline kinase (ChoK) determined via Western blot and levels of ChoK mRNA determined via qPCR. Densitometric analysis of the Western blot bands is shown on the right of the image. (D) Quantification of total phosphatidylcholine in LNCaP and LN-FLU cells using a phosphatidylcholine fluorometric assay. Phosphatidylcholine nanomoles were normalized by the amount of protein. (E) Diagram of phosphatidylcholine biosynthesis showing the metabolites and enzymes that we found down (red arrows) in LN-FLU cells compared to LNCaP cells. * p < 0.05, ** p < 0.01, *** p < 0.001 and **** p < 0.0001 indicate significant differences between LNCaP and LN-FLU cells via two-way ANOVA and Sidak’s multiple comparisons test.
Figure 4
Figure 4
Enzymes involved in protein methylation and deacetylation in prostate LN-FLU cells. (A) Levels of phosphatidylethanolamine methyl transferase (PEMT) mRNA expression were determined via qPCR using Actin as a housekeeping gene. (B) Levels of protein arginine N-methyl transferase 2 (PRMT2) expression determined via Western blot (left) and qPCR (right). (C) Levels of phosphorylated and total forms of Sirtuin1 (Sirt1) determined via Western blot and densitometric analysis of the Western blot bands from three independent experiments. On the right, levels of Sirt1 mRNA were determined via qPCR using Actin as a housekeeping gene. Data show the mean ± SD of at least three different experiments. ** p < 0.01, *** p < 0.001 and **** p < 0.0001 indicate significant differences between LNCaP and LN-FLU cells via two-way ANOVA and Sidak’s multiple comparisons test. (D) Diagram of the reactions catalyzed by the enzymes analyzed showing the metabolites and enzymes that we found different (red arrows) between LN-FLU cells and LNCaP cells.
Figure 5
Figure 5
Levels of CTP:choline cytidyltransferase α (CCTα) and protein arginine N-methyl transferase 2 (PRMT2) in human prostate cancer simples. Expressions of CCTα and PRMT2 mRNA were determined via qPCR. The data show the relative mRNA expression to Actin, which was used as a housekeeping gene. Data represent the mean ± SD of control human samples (n = 5) and prostate cancer samples (n = 15).
Figure 6
Figure 6
mRNA levels of CTP:choline cytidylyltransferase (CCTα), protein arginin N-methyl transferase 2 (PRMT2), and Sirtuin1 (Sirt1) in human prostate cancer biopsies determined via qPCR. (A) Levels of Oct4 and ABCB1A were determined via qPCR using 18S as a housekeeping gene. Based on the expressions of these genes, prostate biopsies were stratified into three groups: control (n = 5), prostate cancer (PCa) low Oct4 and ABCB1A (n = 7), and PCa high Oct4 and ABCB1A (n = 8) (blue arrows). (B) CCTα and PRMT2 and (C) Sirt1 mRNA levels were measured in prostate biopsies via qPCR using Actin as a housekeeping gene. *** p < 0.001 and **** p < 0.0001 indicate significant differences between control and PCa biopsies via two-way ANOVA and Sidak’s multiple comparisons test. ‡‡‡‡ p < 0.0001 indicates significant differences between PCa low Oct4 and ABCB1A and PCa high Oct4 and ABCB1A biopsies.

Similar articles

Cited by

References

    1. Hanahan D., Weinberg R.A. Hallmarks of cancer: The next generation. Cell. 2011;144:646–674. doi: 10.1016/j.cell.2011.02.013. - DOI - PubMed
    1. Hanahan D. Hallmarks of Cancer: New Dimensions. Cancer Discov. 2022;12:31–46. doi: 10.1158/2159-8290.CD-21-1059. - DOI - PubMed
    1. Morandi A., Indraccolo S. Linking metabolic reprogramming to therapy resistance in cancer. Biochim. Biophys. Acta Rev. Cancer. 2017;1868:1–6. doi: 10.1016/j.bbcan.2016.12.004. - DOI - PubMed
    1. Chen X., Chen S., Yu D. Metabolic Reprogramming of Chemoresistant Cancer Cells and the Potential Significance of Metabolic Regulation in the Reversal of Cancer Chemoresistance. Metabolites. 2020;10:289. doi: 10.3390/metabo10070289. - DOI - PMC - PubMed
    1. Vellky J.E., Ricke W.A. Development and prevalence of castration-resistant prostate cancer subtypes. Neoplasia. 2020;22:566–575. doi: 10.1016/j.neo.2020.09.002. - DOI - PMC - PubMed