. 2023 Nov 2;24(21):15910.
doi: 10.3390/ijms242115910.

The Biological Assessment of Shikonin and β,β-dimethylacrylshikonin Using a Cellular Myxofibrosarcoma Tumor Heterogeneity Model

Affiliations

The Biological Assessment of Shikonin and β,β-dimethylacrylshikonin Using a Cellular Myxofibrosarcoma Tumor Heterogeneity Model

Birgit Lohberger et al. Int J Mol Sci. .

Abstract

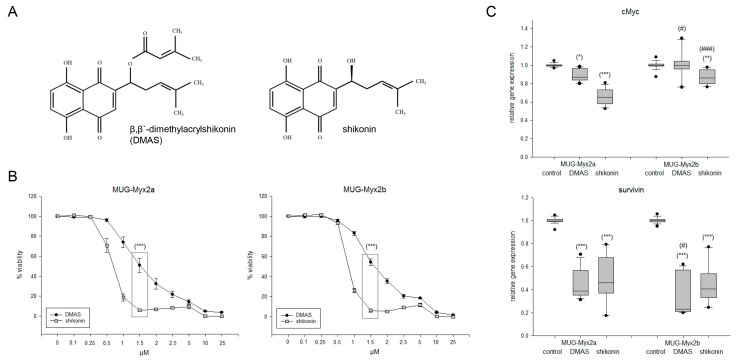
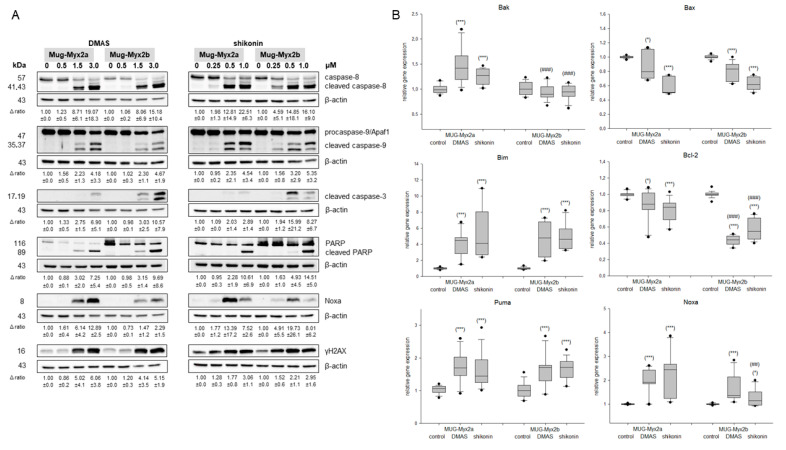
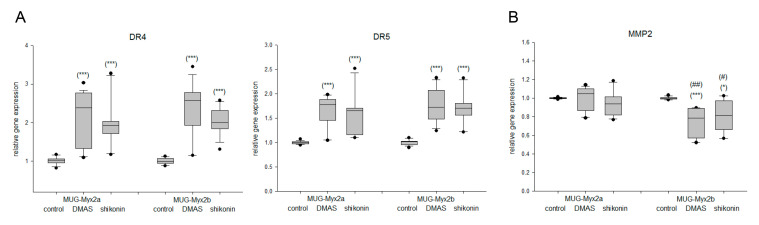
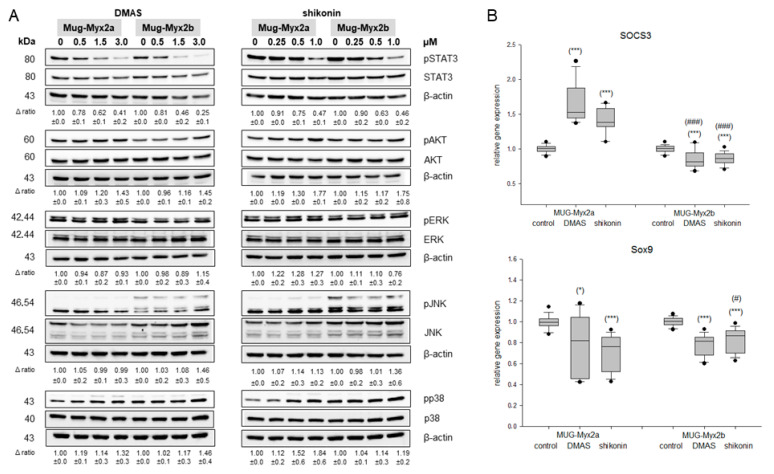
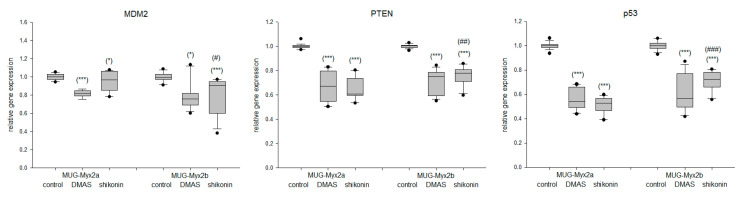
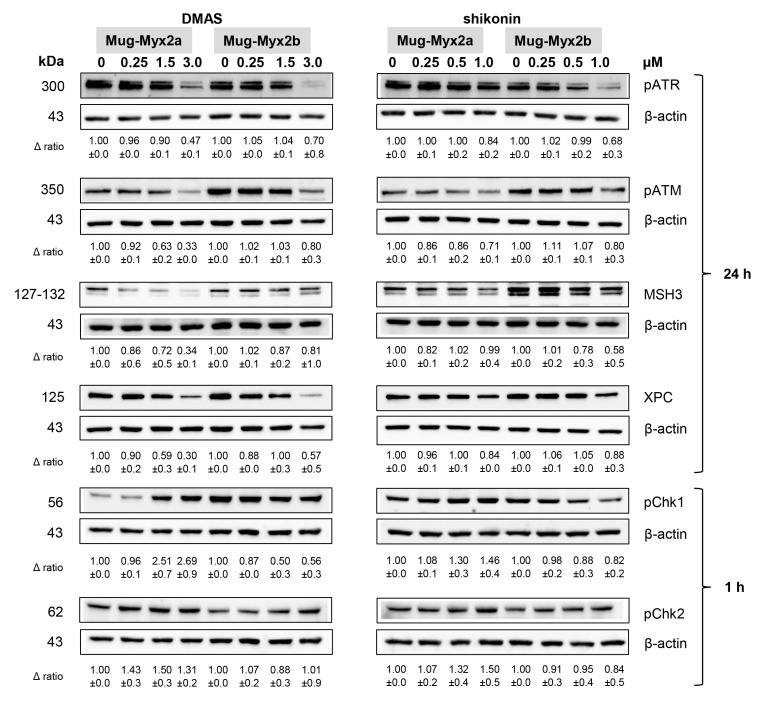
Myxofibrosarcoma (MFS) is a subtype of soft tissue sarcoma of connective tissue, which is characterized by large intra-tumor heterogeneity. Therapy includes surgical resection. Additional chemotherapy is of limited effect. In this study, we demonstrated the potent anticancer activity of shikonin derivatives in our MFS cellular model of tumor heterogeneity for developing a new therapeutic approach. The impact of shikonin and β,β-dimethylacrylshikonin (DMAS) on viability, apoptotic induction, MAPK phosphorylation, and DNA damage response were analyzed by means of two human MFS cell lines, MUG-Myx2a and MUG-Myx2b, derived from a singular tumor tissue specimen. MFS cells showed a dose-dependent inhibition of cell viability and a significant induction of apoptosis. Treatment with shikonin derivatives caused an inhibition of pSTAT3 and an increase in pAKT, pERK, pJNK, and pp38. DMAS and shikonin inhibited the activation of the two master upstream regulators of the DNA damage response, ATR and ATM. MUG-Myx2b, which contains an additional PTEN mutation, was more sensitive in some targets. These data demonstrate the significant antitumorigenic effect of shikonin derivatives in MFS and highlight the importance of intra-tumor heterogeneity in treatment planning.

Keywords: DNA damage response; MAPK signaling; apoptosis; myxofibrosarcoma; shikonin; tumor heterogeneity; β,β-dimethylacrylshikonin.


Conflict of interest statement

The authors declare no conflict of interest.

Figures

Figure 1
Figure 1
Effects of DMAS and shikonin on cell viability and proliferation. (A) Chemical structures of β,β-dimethylacrylshikonin (DMAS) and shikonin. (B) Dose–response relationship showing the dose-dependent reduction in cell growth, where shikonin showed a highly significant, more efficient effect than DMAS at a concentration of 1.5 µM. (C) Relative gene expression of the proliferation markers cMyc and survivin 24 h after treatment with the respective IC50 concentrations of DMAS/shikonin (mean ± SD; n = 6; measured in triplicate). Untreated cells were used as controls (ratio = 1). Statistical significances are defined as follows: */# p < 0.05; ** p < 0.01; ***/### p < 0.001 (controls vs. DMAS/shikonin treated cells were represented with stars; significances between both cell lines were represented with rhombuses).
Figure 2
Figure 2
Apoptotic induction. (A) Protein expression of cleaved caspase-8, -9, and -3, as well as cleaved PARP, Noxa, and the DNA damage marker γH2AX. The apoptotic key players were evaluated by immunoblotting under control conditions (0) and after treatment with 0.5, 1.5, and 3 µM DMAS respectively 0.25, 0.5, and 1.0 µM shikonin. β-actin was used as loading control. Δ ratio, fold change was normalized to non-treated controls (mean ± SD of n = 3). Full-length blots are presented in Supplementary Data. (B) Relative gene expression of the pro-apoptotic markers Bak, Bax and Bim, the anti-apoptotic marker Bcl-2, and the antagonists Puma and Noxa after treatment with DMAS or shikonin for 24 h in MUG-Myx2a and MUG-Myx2b cells (mean ± SD, n = 6, measured in triplicate). Statistical significances to the untreated controls are defined as follows: * p < 0.05; *** p < 0.001. Statistical significances between the two cell lines MUG-Myx2a and MUG-Myx2b are presented as ## p < 0.01; ### p < 0.001.
Figure 3
Figure 3
Altered gene expression of death receptors and MMP2. (A) Relative gene expression analysis of DR4 (TNFRSF10A), DR5 (TNFRSF10B), and (B) the metastasis factor MMP2 after treatment with DMAS and shikonin for 24 h in MFS cells. Untreated control cells served as reference value (ratio = 1; mean ± SD, n = 6, measured in triplicate). Statistical significances to the untreated controls are defined as follows: * p < 0.05; *** p < 0.001. Statistical significances between the two cell lines MUG-Myx2a and MUG-Myx2b were marked by means of # p < 0.05; ## p < 0.01.
Figure 4
Figure 4
MAPK phosphorylation. (A) Protein phosphorylation of STAT3, AKT, ERK, JNK and p38 was analyzed by immunoblotting under control conditions (0) and after treatment with 0.5, 1.5, and 3 µM DMAS, respectively 0.25, 0.5, and 1.0 µM shikonin. β-actin was used as loading control. Δ ratio, fold change normalized to non-treated controls (mean ± SD of n = 3). Full-length blots are presented in Supplementary Data. (B) Relative gene expression of the STAT3 downstream targets SOCS3 and Sox9 after treatment with DMAS or shikonin for 24 h in MUG-Myx2a and MUG-Myx2b cells (mean ± SD, n = 6, measured in triplicate). Statistical significances to the untreated controls are defined as follows: * p < 0.05; *** p < 0.001. Statistical significances between the two cell lines MUG-Myx2a and MUG-Myx2b are presented as # p < 0.05; ### p < 0.001.
Figure 5
Figure 5
Altered gene expression of the MDM2, PTEN, and p53 tumor-suppressor-oncoprotein network. Relative gene expression analysis of MDM2, PTEN, and p53 after treatment with DMAS and shikonin for 24 h in MFS cells. Untreated control cells served as reference value (ratio = 1; mean ± SD, n = 6, measured in triplicate). Statistical significances to the untreated controls are defined as follows: * p < 0.05; *** p < 0.001. Statistical significances between the two cell lines MUG-Myx2a and MUG-Myx2b were marked by means of # p < 0.05; ## p < 0.01; ### p < 0.001.
Figure 6
Figure 6
DNA damage response after DMAS and shikonin treatment. Protein expression and phosphorylation of DNA damage markers pATR, pATM, MSH3, and XPC, as well as pChk1 and pChk2 was analyzed by immunoblotting under control conditions (0) and after treatment with 0.5, 1.5, and 3 µM DMAS, respectively 0.25, 0.5, and 1.0 µM shikonin. β-actin was used as loading control. Δ ratio, fold change normalized to non-treated controls (mean ± SD of n = 3). Full-length blots are presented in Supplementary Data.

References

    1. Nishio J., Iwasaki H., Nabeshima K., Naito M. Cytogenetics and molecular genetics of myxoid soft-tissue sarcomas. Genet. Res. Int. 2011;2011:497148. doi: 10.4061/2011/497148. - DOI - PMC - PubMed
    1. Huang H.Y., Mentzel T.D.W., Shibata T., World Health Organization (WHO) Classification of Soft Tissue and Bone Tumours. 5th ed. International Agency for Research on Cancer (IARC); Lyon, France: 2020. pp. 124–126.
    1. Rhee I., Spazzoli B., Stevens J., Hansa A., Spelman T., Pang G., Guiney M., Powell G., Choong P., di Bella C. Oncologic outcomes in myxofibrosarcomas: The role of a multidisciplinary approach and surgical resection margins. ANZ J. Surg. 2023;93:577–584. doi: 10.1111/ans.18320. - DOI - PubMed
    1. Boughzala-Bennadji R., Stoeckle E., le Péchoux C., Méeus P., Honoré C., Attal J., Duffaud F., de Pinieux G., Bompas E., Thariat J., et al. Localized myxofibrosarcomas: Roles of surgical margins and adjuvant radiation therapy. Int. J. Radiat. Oncol. Biol. Phys. 2018;102:399–406. doi: 10.1016/j.ijrobp.2018.05.055. - DOI - PubMed
    1. Saxby N.E., An Q., Miller B.J. Local recurrence of soft tissue sarcoma revisited: Is there a role for “selective” radiation? Iowa Orthop. J. 2022;42:239–248. - PMC - PubMed