. 2023 Nov 3;24(21):15952.
doi: 10.3390/ijms242115952.

Kiwifruit Resistance to Sclerotinia sclerotiorum and Pseudomonas syringae pv. actinidiae and Defence Induction by Acibenzolar-S-methyl and Methyl Jasmonate Are Cultivar Dependent

Affiliations

Kiwifruit Resistance to Sclerotinia sclerotiorum and Pseudomonas syringae pv. actinidiae and Defence Induction by Acibenzolar-S-methyl and Methyl Jasmonate Are Cultivar Dependent

Tony Reglinski et al. Int J Mol Sci. .

Abstract

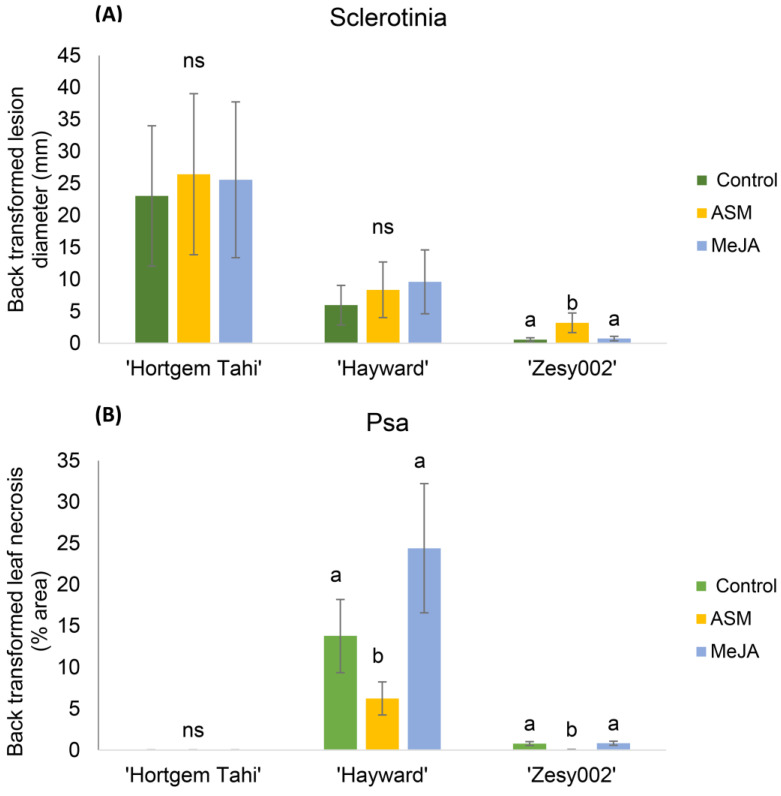
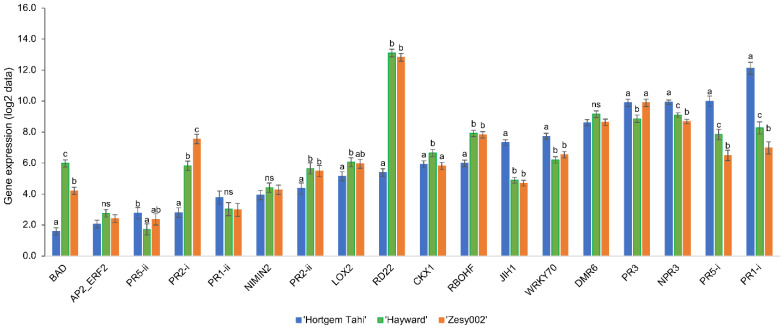
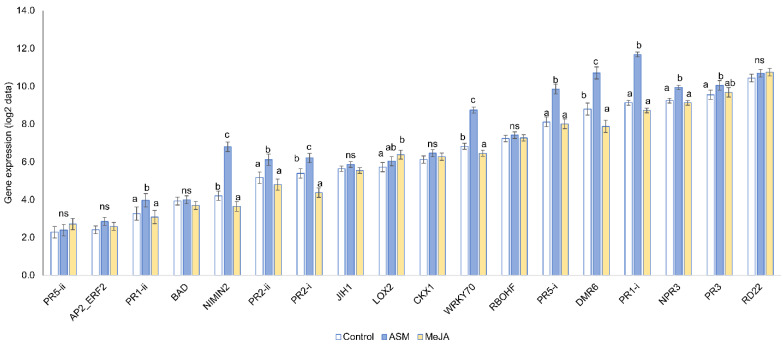
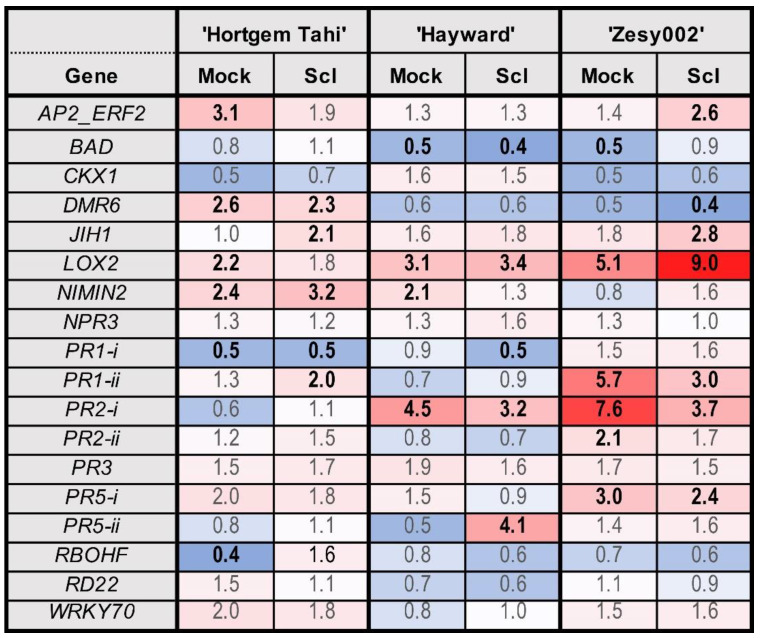
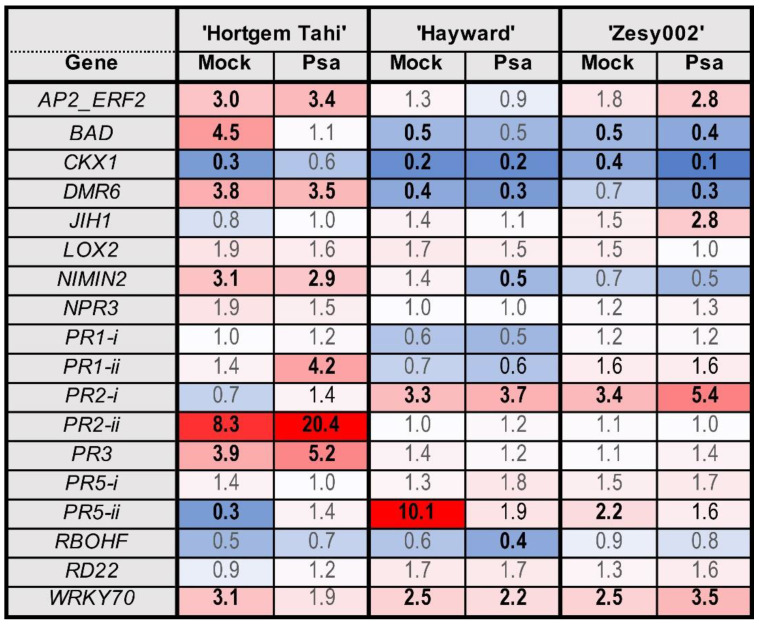
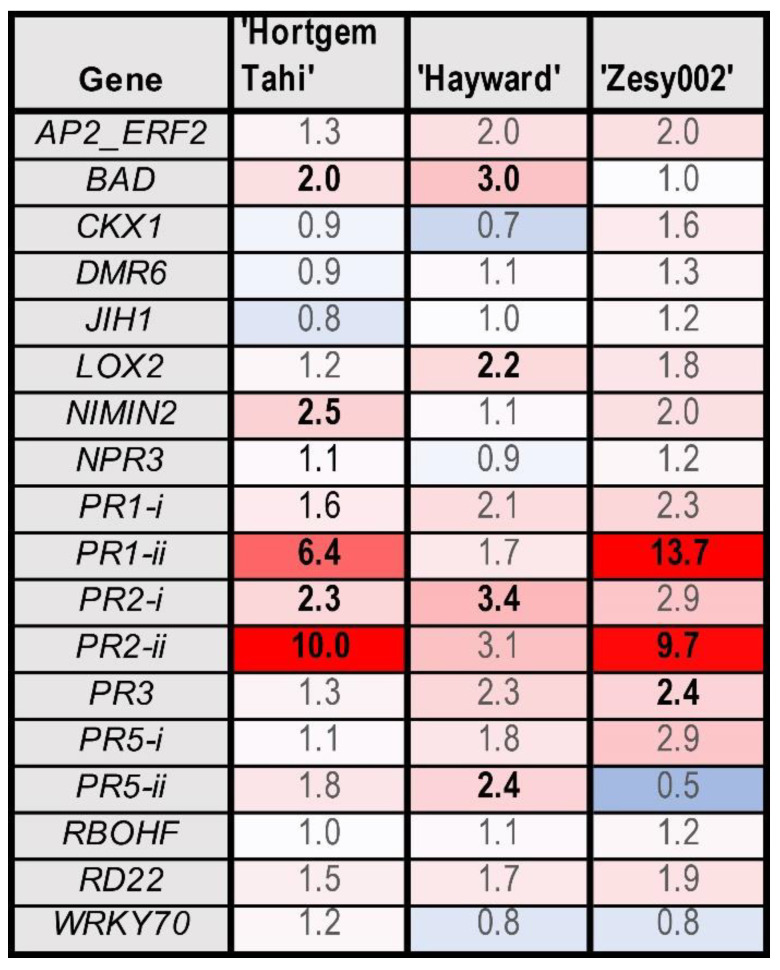
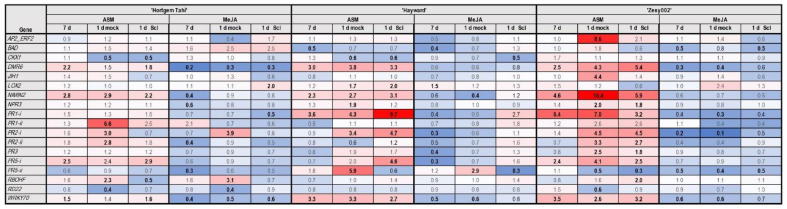
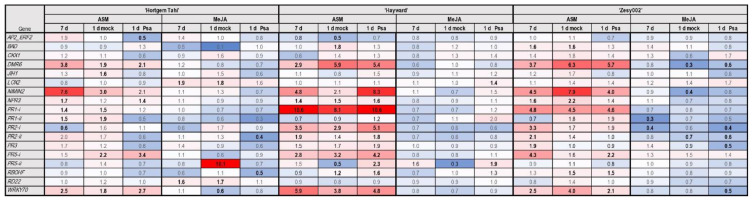
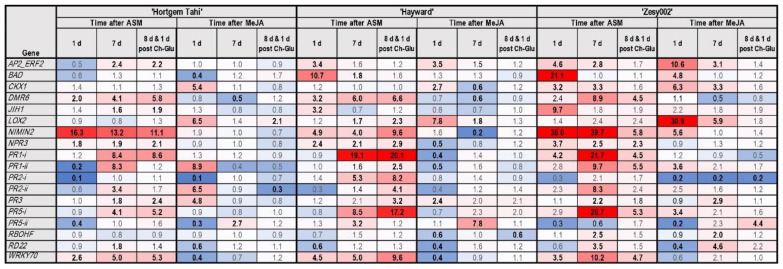
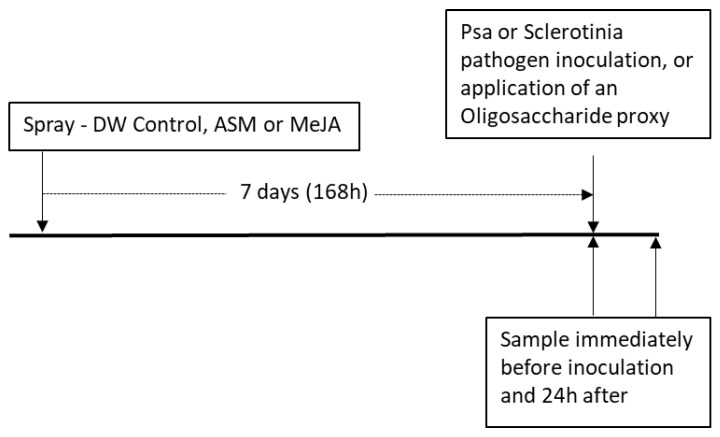
Pathogen susceptibility and defence gene inducibility were compared between the Actinidia arguta cultivar 'Hortgem Tahi' and the two cultivars of A. chinensis 'Hayward' and 'Zesy002'. Plants were treated with acibenzolar-s-methyl (ASM) or methyl jasmonate (MeJA) one week before inoculation with Pseudomonas syringae pv. actinidiae (Psa biovar3) or Sclerotinia sclerotiorum, or secondary induction with chitosan+glucan (Ch-Glu) as a potential pathogen proxy. Defence expression was evaluated by measuring the expression of 18 putative defence genes. 'Hortgem Tahi' was highly susceptible to sclerotinia and very resistant to Psa, whereas 'Zesy002' was highly resistant to both, and 'Hayward' was moderately susceptible to both. Gene expression in 'Hayward' and 'Zesy002' was alike but differed significantly from 'Hortgem Tahi' which had higher basal levels of PR1-i, PR5-i, JIH1, NPR3 and WRKY70 but lower expression of RD22 and PR2-i. Treatment with ASM caused upregulation of NIMIN2, PR1-i, WRKY70, DMR6 and PR5-i in all cultivars and induced resistance to Psa in 'Zesy002' and 'Hayward' but decreased resistance to sclerotinia in 'Zesy002'. MeJA application caused upregulation of LOX2 and downregulation of NIMIN2, DMR6 and PR2-i but did not affect disease susceptibility. The Ch-Glu inducer induced PR-gene families in each cultivar, highlighting its possible effectiveness as an alternative to actual pathogen inoculation. The significance of variations in fundamental and inducible gene expression among the cultivars is explored.

Keywords: Actinidia; MAMP; Pseudomonas syringae pathovar actinidiae (Psa); Sclerotinia sclerotiorum.


Conflict of interest statement

The authors declare no conflict of interest. Data have not been published elsewhere.

Figures

Figure 1
Figure 1
Relative susceptibilities of Actinidia arguta ‘Hortgem Tahi’, A. chinensis var. chinensis ‘Zesy002′ and Actinidia chinensis var. deliciosa ‘Hayward’ potted clonal kiwifruit plants to infection by (A) Sclerotinia sclerotiorum (sclerotinia), or (B) Pseudomonas syringae pv. actinidiae (Psa biovar3). Seven days before inoculation, plants were sprayed with either 0.2 g/L Actigard® (ASM), or 2.25 mmol/L methyl jasmonate (MeJA) plus 0.05% v/v Du-Wett® (DW) surfactant, or 0.05% v/v DW only (control). Disease assessments for Sclerotinia (lesion diameter) and Psa (% leaf area infected) were made 4 and 14 d after inoculation, respectively. Data were log2-transformed for analysis but are presented as back-transformed means. Error bars give the standard errors, and different lettering above the bars indicates significant treatment differences within cultivar comparisons, as shown by Fisher’s least significant difference (LSD), p ≤ 0.05. Non-significant differences are indicated by ‘ns’.
Figure 2
Figure 2
Cultivar effects on gene expression. Basal gene expression data (log2 gene counts) as measured by NanoString PlexSet® in non-induced control plants of Actinidia arguta ‘Hortgem Tahi’, Actinidia chinensis var. deliciosa ‘Hayward’ and A. chinensis var. chinensis ‘Zesy002′ clonal plants that were sprayed with 0.05% v/v Du-Wett® (DW) surfactant seven days before sampling. Data were pooled from all gene expression experiments and were log2-transformed for analysis after normalization against the reference genes 40s, Actin2, GAPDH and PP2A. Different lettering above bars indicates statistically significant differences as determined by LSD (p ≤ 0.05). NS = non-significant differences.
Figure 3
Figure 3
Inducer effects on gene expression. Gene expression data (log2 gene counts) as measured by NanoString PlexSet® in kiwifruit plants that were sprayed with 0.2 g/L Actigard® (ASM) or 2.25 mmol/L methyl jasmonate (MeJA) plus 0.05% v/v Du-Wett® (DW) surfactant, or 0.05% v/v DW only (control) seven days before sampling. Data were pooled from all gene expression experiments, averaged across three cultivars and were log2-transformed for analysis after normalization against the reference genes 40s, Actin2, GAPDH and PP2A. Different lettering above the bars indicates statistically significant differences as determined by LSD (p ≤ 0.05). NS = non-significant differences.
Figure 4
Figure 4
Heat map showing fold-change in gene expression in Actinidia arguta ‘Hortgem Tahi’, Actinidia chinensis var. deliciosa ‘Hayward’ and A. chinensis var. chinensis ‘Zesy002′ kiwifruit plants 1 day after inoculation with Sclerotinia sclerotiorum (Scl) or mock inoculation (with a sterile inoculum plug). Gene counts in leaf tissue were measured by NanoString PlexSet® with normalization against the reference genes 40s, Actin2, GAPDH and PP2A. Fold-change data in red shades indicate an upregulation relative to the control, whilst blue shades represent downregulation relative to the control, with increasing colour intensity indicating larger fold-changes. Statistically significant differences from the control at individual time points, as determined by LSD (p ≤ 0.05), are identified in bold typeface.
Figure 5
Figure 5
Heat map showing fold-change in gene expression in Actinidia arguta ‘Hortgem Tahi’, Actinidia chinensis var. deliciosa ‘Hayward’, and A. chinensis var. chinensis ‘Zesy002′ kiwifruit plants 1 day after inoculation with Pseudomonas syringae pv. actinidiae (Psa biovar 3) or mock inoculation. Gene counts in leaf tissue were measured by NanoString PlexSet® with normalization against the reference genes 40s, Actin2, GAPDH and PP2A. Fold-change data in red shades indicate an upregulation relative to the control, whilst blue shades represent downregulation relative to the control, with increasing colour intensity indicating larger fold-changes. Statistically significant differences from the control at individual time points, as determined by LSD (p ≤ 0.05), are identified in bold typeface.
Figure 6
Figure 6
Heat map showing fold-change in gene expression in Actinidia arguta ‘Hortgem Tahi’, Actinidia chinensis var. deliciosa ‘Hayward’ and A. chinensis var. chinensis ‘Zesy002′ kiwifruit plants resulting from application of Ch-Glu (0.125 g/L each of chitosan and laminarin). Gene counts were measured by NanoString PlexSet® with normalization against the reference genes 40s, Actin2, GAPDH and PP2A. Fold-change data in red shades indicate an upregulation relative to the control, whilst blue shades represent downregulation relative to the control, with increasing colour intensity indicating larger fold-changes. Statistically significant differences from the control at individual time points, as determined by LSD (p ≤ 0.05) are identified in bold typeface.
Figure 7
Figure 7
Heat map representing fold-change in gene expression in Actinidia arguta ‘Hortgem Tahi’, A. chinensis var. chinensis ‘Zesy002′ and Actinidia chinensis var. deliciosa ‘Hayward’ kiwifruit plants elicited by a foliar spray application of 0.2 g/L Actigard® (ASM), or 2.25 mmol/L methyl jasmonate (MeJA) plus 0.05% v/v Du-Wett® (DW) surfactant, or 0.05% v/v DW only (control), 7 days before inoculation with Sclerotinia sclerotiorum (Scl) or mock inoculation (with a sterile inoculum plug). Leaf samples were collected at 7 d post-inducer application, and 1 d post-challenge inoculation. Gene counts were measured by NanoString PlexSet® with normalization against the reference genes 40s, Actin2, GAPDH and PP2A. Fold-change data in red shades indicate an upregulation relative to the control, whilst blue shades represent downregulation relative to the control, with increasing colour intensity indicating larger fold-changes. Statistically significant differences from the control at individual time points, as determined by LSD (p ≤ 0.05), are identified in bold typeface.
Figure 8
Figure 8
Heat map presenting fold-change in gene expression data in Actinidia arguta ‘Hortgem Tahi’, A. chinensis var. chinensis ‘Zesy002′ and Actinidia chinensis var. deliciosa ‘Hayward’ kiwifruit plants elicited by a foliar spray application of 0.2 g/L Actigard® (ASM) or 2.25 mmol/L methyl jasmonate (MeJA) plus 0.05% v/v Du-Wett® (DW) surfactant or 0.05% v/v DW only (control), followed by a challenge inoculation with Pseudomonas syringae pv. actinidiae (Psa biovar 3) or mock inoculation 7 days later. Leaf samples were collected at 7 d post-inducer application, and 1 d post-challenge inoculation. Gene counts were measured by NanoString PlexSet® with normalization against the reference genes 40s, Actin2, GAPDH and PP2A. Fold-change data in red shades indicate an upregulation relative to the control, whilst blue shades represent downregulation relative to the control, with increasing colour intensity indicating larger fold-changes. Statistically significant differences from the control at individual time points, as determined by LSD (p ≤ 0.05), are identified in bold typeface.
Figure 9
Figure 9
Heat map presenting fold-change in gene expression data in Actinidia arguta ‘Hortgem Tahi’, A. chinensis var. chinensis ‘Zesy002′ and Actinidia chinensis var. deliciosa ‘Hayward’ kiwifruit plants sprayed with 0.2 g/L Actigard® (ASM), or 2.25 mmol/L methyl jasmonate (MeJA) plus 0.05% v/v Du-Wett® (DW) surfactant or 0.05% v/v DW only (control), 7 days before treatment with Ch-Glu (0.125 g/L each of chitosan and laminarin). Gene expression was measured at 1 and 7 days post-inducer application, and 1 d post-Ch-Glu application (i.e., 8 days post-inducer application). Gene counts were measured by NanoString PlexSet® with normalization against the reference genes 40s, Actin2, GAPDH and PP2A. Fold-change data in red shades indicate an upregulation relative to the control, whilst blue shades represent downregulation relative to the control, with increasing colour intensity indicating larger fold-changes. Statistically significant differences from the control at individual time points, as determined by LSD (p ≤ 0.05), are identified in bold typeface.
Figure 10
Figure 10
Schematic outline of the general experimental protocol and timeline. Original spray treatments consisted of spray application of distilled water (DW), Acibenzolar-S-methyl (ASM, 0.2 g/L) and methyl jasmonate (MeJA, 2.25 mmol/L). Pathogens used were Sclerotinia sclerotiorum (sclerotinia) and Pseudomonas syringae pv. actinidiae (Psa biovar 3).

References

    1. Pieterse C.M.J., Van der Does D., Zamioudis C., Leon-Reyes A., Van Wees S.C.M. Hormonal modulation of plant immunity. In: Schekman R., editor. Annual Review of Cell and Developmental Biology. Volume 28. Annual Reviews; Palo Alto, CA, USA: 2012. pp. 489–521. - PubMed
    1. Mauch-Mani B., Baccelli I., Luna E., Flors V. Defense Priming: An Adaptive Part of Induced Resistance. In: Merchant S.S., editor. Annual Review of Plant Biology. Volume 68. Annual Reviews; Palo Alto, CA, USA: 2017. pp. 485–512. - PubMed
    1. Walters D.R., Ratsep J., Havis N.D. Controlling crop diseases using induced resistance: Challenges for the future. J. Exp. Bot. 2013;64:1263–1280. doi: 10.1093/jxb/ert026. - DOI - PubMed
    1. Aerts N., Mendes M.P., Van Wees S.C.M. Multiple levels of crosstalk in hormone networks regulating plant defense. Plant J. 2021;105:489–504. doi: 10.1111/tpj.15124. - DOI - PMC - PubMed
    1. Vos I.A., Moritz L., Pieterse C.M.J., Van Wees S.C.M. Impact of hormonal crosstalk on plant resistance and fitness under multi-attacker conditions. Front. Plant Sci. 2015;6:13. doi: 10.3389/fpls.2015.00639. - DOI - PMC - PubMed

Substances

Supplementary concepts