. 2023 Nov 3;12(21):6918.
doi: 10.3390/jcm12216918.

The Role of Chest Compressions on Ventilation during Advanced Cardiopulmonary Resuscitation

Affiliations

The Role of Chest Compressions on Ventilation during Advanced Cardiopulmonary Resuscitation

Izaskun Azcarate et al. J Clin Med. .

Abstract

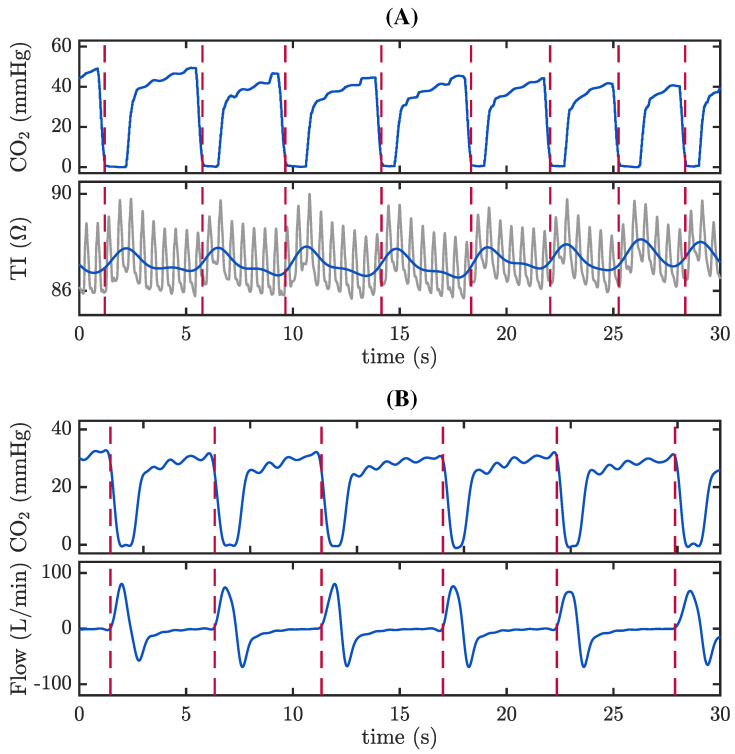
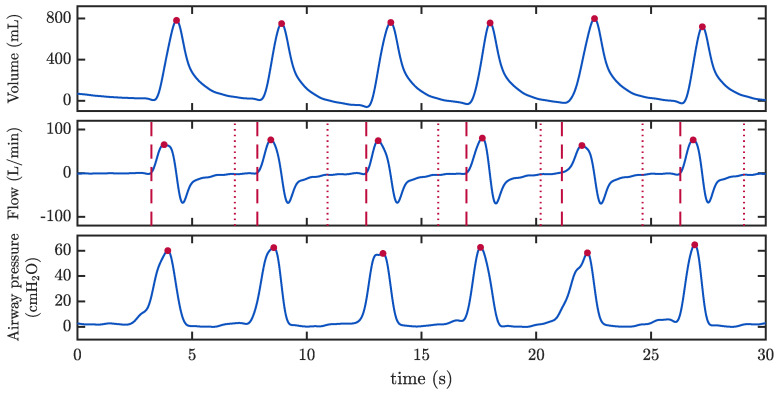
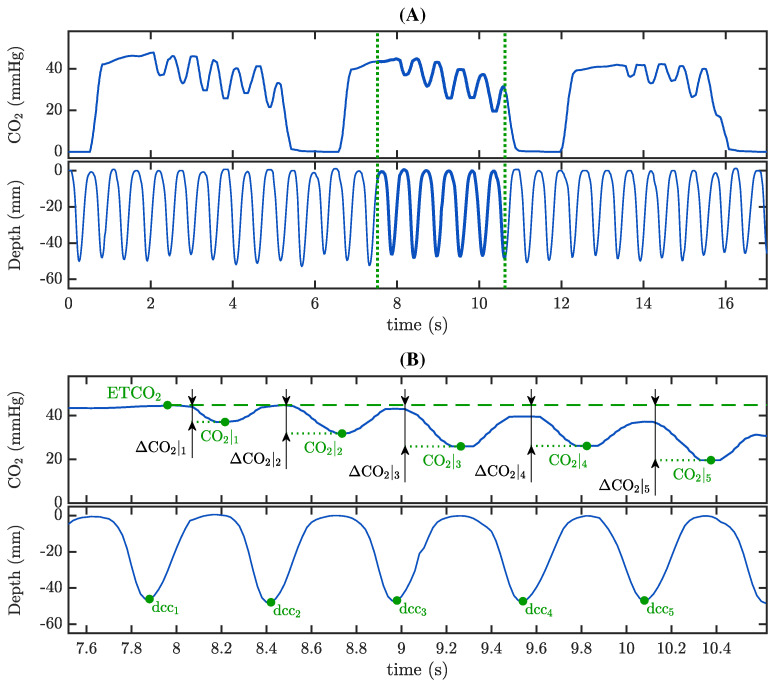
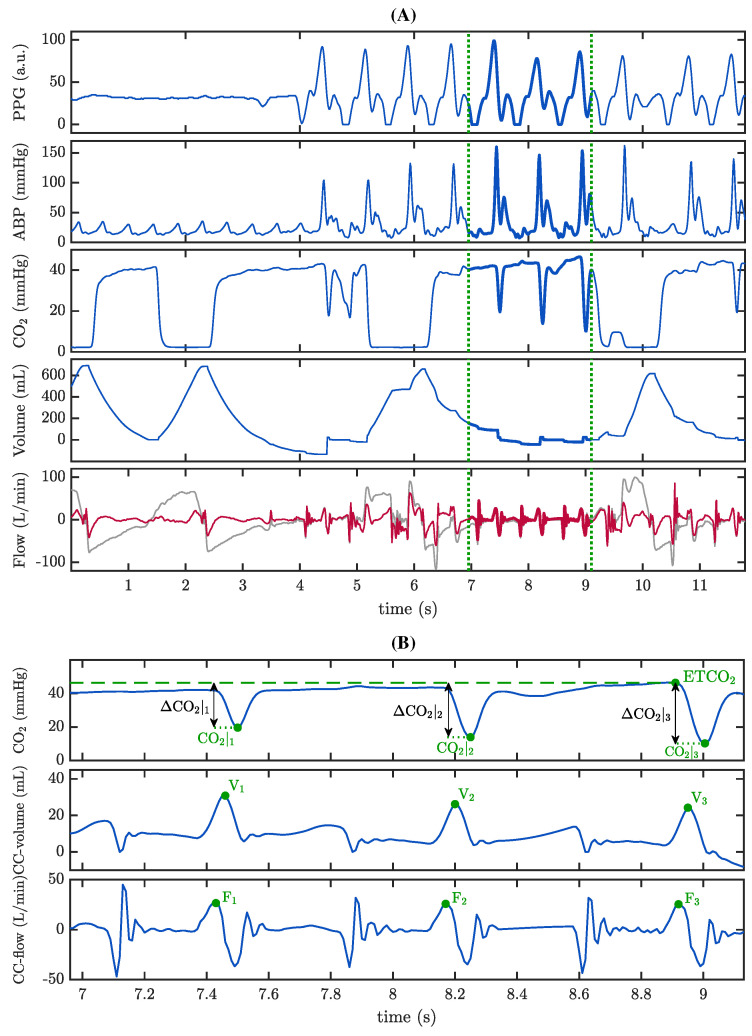
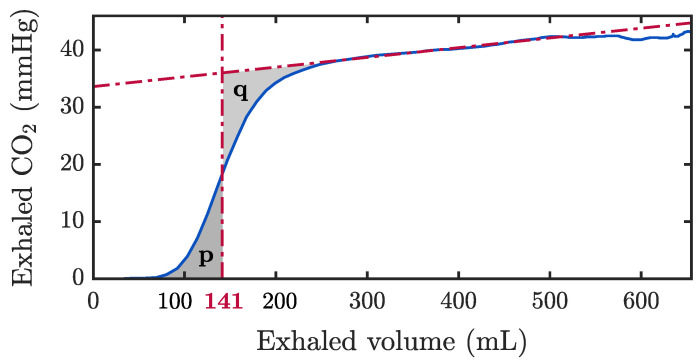
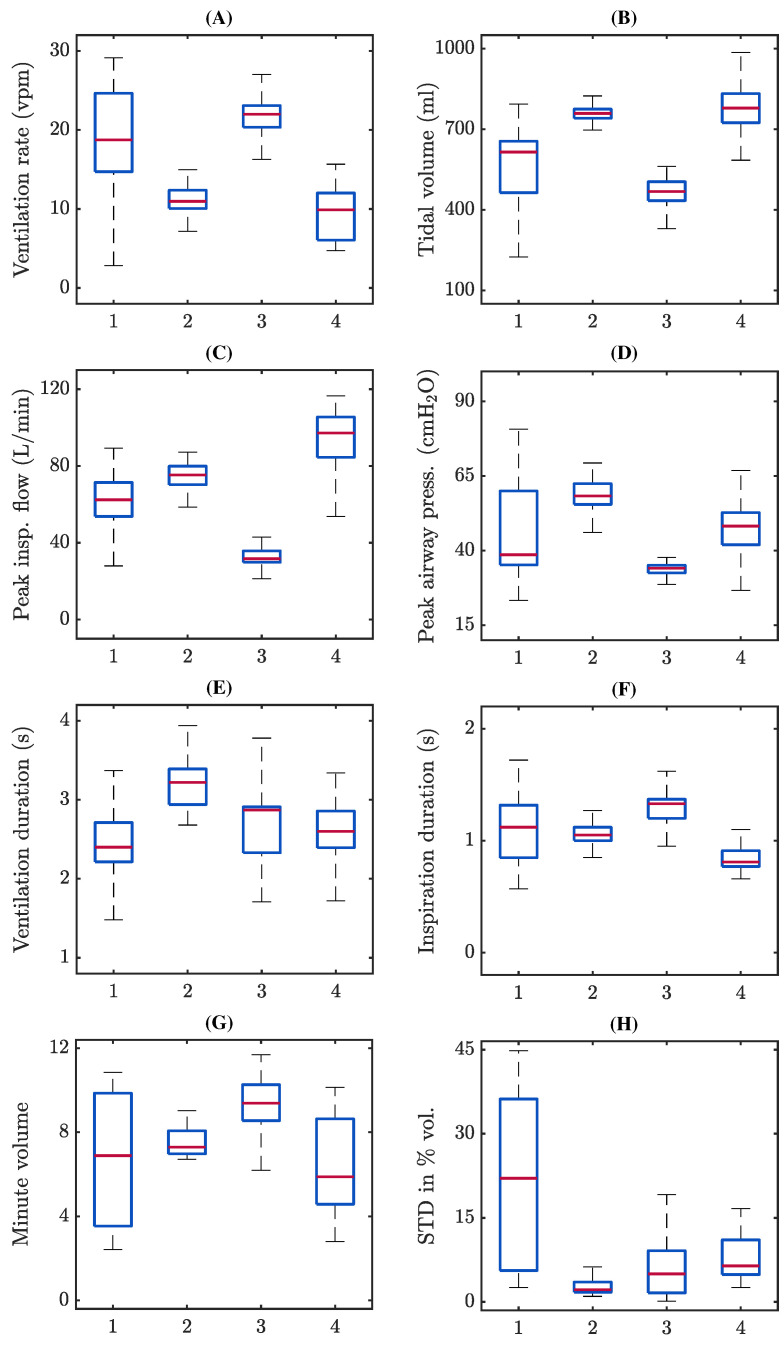
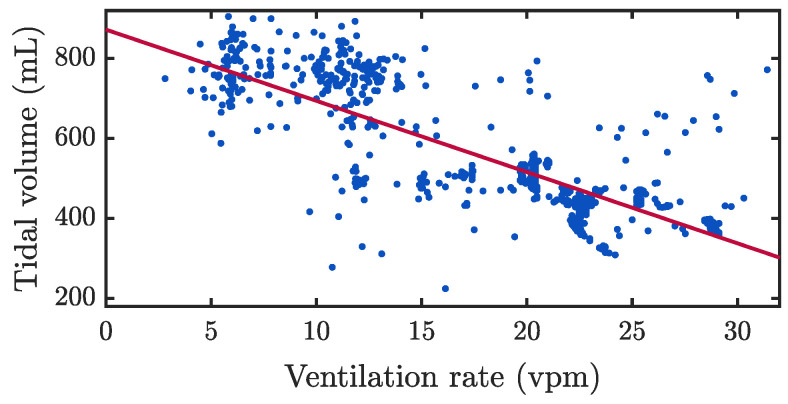
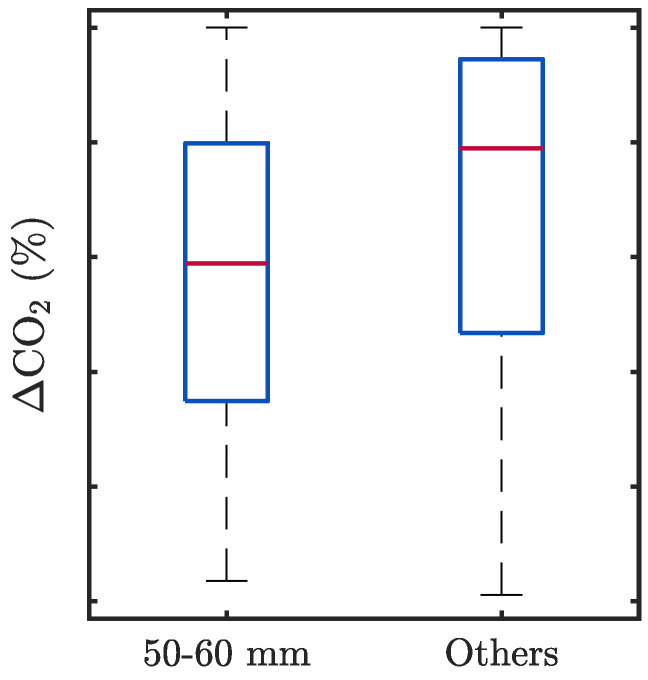
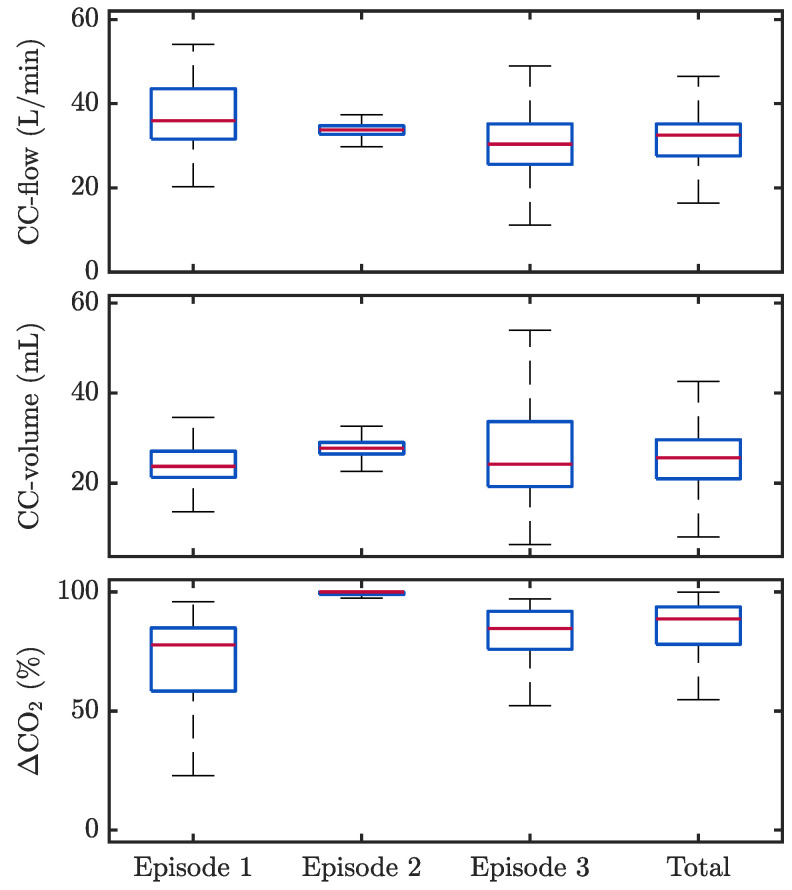
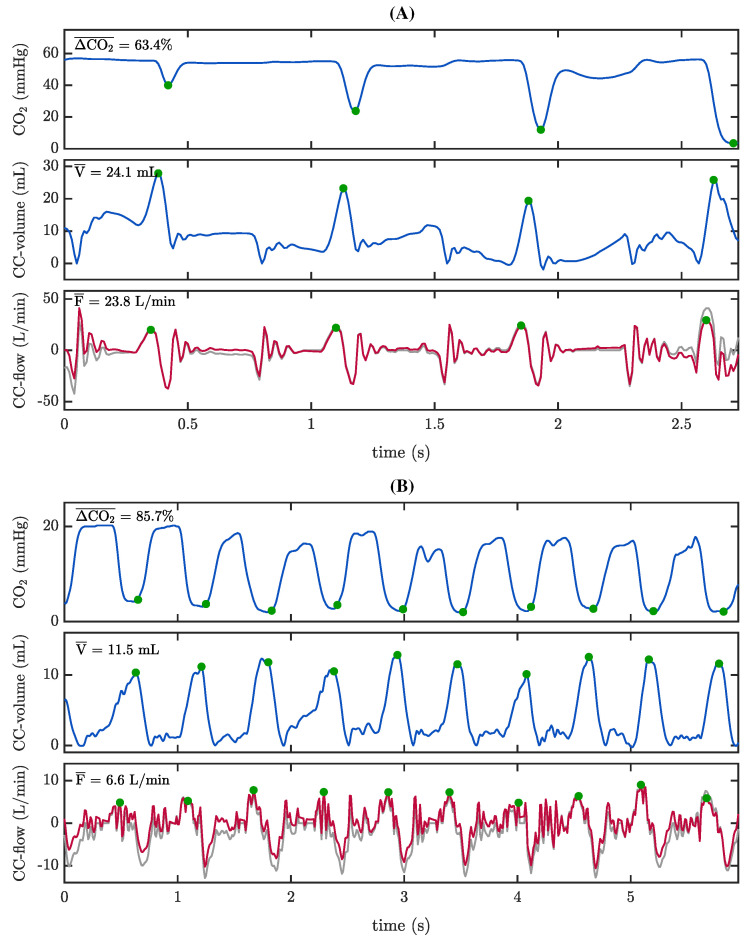
Background: There is growing interest in the quality of manual ventilation during cardiopulmonary resuscitation (CPR), but accurate assessment of ventilation parameters remains a challenge. Waveform capnography is currently the reference for monitoring ventilation rate in intubated patients, but fails to provide information on tidal volumes and inspiration-expiration timing. Moreover, the capnogram is often distorted when chest compressions (CCs) are performed during ventilation compromising its reliability during CPR. Our main purpose was to characterize manual ventilation during CPR and to assess how CCs may impact on ventilation quality. Methods: Retrospective analysis were performed of CPR recordings fromtwo databases of adult patients in cardiac arrest including capnogram, compression depth, and airway flow, pressure and volume signals. Using automated signal processing techniques followed by manual revision, individual ventilations were identified and ventilation parameters were measured. Oscillations on the capnogram plateau during CCs were characterized, and its correlation with compression depth and airway volume was assessed. Finally, we identified events of reversed airflow caused by CCs and their effect on volume and capnogram waveform. Results: Ventilation rates were higher than the recommended 10 breaths/min in 66.7% of the cases. Variability in ventilation rates correlated with the variability in tidal volumes and other ventilatory parameters. Oscillations caused by CCs on capnograms were of high amplitude (median above 74%) and were associated with low pseudo-volumes (median 26 mL). Correlation between the amplitude of those oscillations with either the CCs depth or the generated passive volumes was low, with correlation coefficients of -0.24 and 0.40, respectively. During inspiration and expiration, reversed airflow events caused opposed movement of gases in 80% of ventilations. Conclusions: Our study confirmed lack of adherence between measured ventilation rates and the guideline recommendations, and a substantial dispersion in manual ventilation parameters during CPR. Oscillations on the capnogram plateau caused by CCs did not correlate with compression depth or associated small tidal volumes. CCs caused reversed flow during inspiration, expiration and in the interval between ventilations, sufficient to generate volume changes and causing oscillations on capnogram. Further research is warranted to assess the impact of these findings on ventilation quality during CPR.

Keywords: advanced life support (ALS); airway flow; cardiopulmonary resuscitation (CPR); chest compressions; tidal volume; ventilation; ventilation rate.


Conflict of interest statement

The authors declare no conflict of interest.

Figures

Figure 1
Figure 1
Example of ventilation annotation in the TVF&R (A) and MUV (B) databases. The red dashed lines represent each individual ventilation. (A) Ventilations were annotated using the capnogram (top) and the TI signal (bottom). The raw TI (grey) was low pass filtered to suppress fast oscillations caused by CCs and enhance the ventilation TI component (blue). (B) Ventilations annotated using the capnogram (top) and the airflow signal (bottom).
Figure 2
Figure 2
Example of data annotation of additional ventilation parameters in the MUV database. From top to bottom: volume signal with the peak volume per ventilation annotated with red dots; airway flow signal showing the beginning (red dashed lines) and end (red dotted lines) of each ventilation and the peak inspiratory flow (red dots); airway pressure signal with the peak value per ventilation (red dots).
Figure 3
Figure 3
Annotation of parameter ΔCO2|i and corresponding CC-depth, dcci, in the TVF&R database. (A) Capnogram tracing (top) showing oscillations caused by CCs, which can be distinguished in the compression depth signal (bottom). (B) Expansion of the segment between green dotted lines in panel A, illustrating in detail the annotations.
Figure 4
Figure 4
Annotation of parameter ΔCO2|i, CC-volume Vi and CC-flow Fi in the MUV database. (A) From top to bottom: PPG and ABP signals showing the onset of CCs from second 4 onwards. Third panel: the capnogram tracing is affected by CCs. Forth and fifth panels: volume and airflow signals. The raw flow (grey line) was high pass filtered to enhance CCs activity (CC-flow. red line). a.u.: arbitrary units. (B) Expansion of the segment between green dotted lines in panel A, illustrating in detail the annotations.
Figure 5
Figure 5
Volumetric capnogram of a ventilatory cycle annotated in the MUV database, representing the exhaled CO2 as a function of the exhaled volume in a single ventilation. The red dashed-dotted vertical line, where the areas p and q are equal, indicates the volume of the anatomical dead space.
Figure 6
Figure 6
Distributions of the analysed ventilation parameters in the MUV database using boxplots. On each box, the red mark indicates the median, and the bottom and top edges of the box indicate the 25th and 75th percentiles, respectively. The whiskers extend to the most extreme data points not considered outliers. From panel (AH): ventilation rate, tidal volume, peak inspiratory flow, peak airway pressure, ventilation duration, inspiration duration, minute volume and coefficient of variation of tidal volume. A large variability was observed intra-patient and inter-patent, confirming that homogeneity in the application of manual ventilation is far from being achieved.
Figure 7
Figure 7
Scatter plot of tidal volume versus ventilation rate (MUV database), with the resulting regression line yielding a Pearson correlation coefficient R of 0.8 (strong negative correlation).
Figure 8
Figure 8
Distributions using boxplots of ΔCO2|i values for CCs with and without adherence to guidelines recommendations for compression depth (from TVF&R database). Despite the absence of correlation between ΔCO2|i and dcci, differences in the two groups were observed.
Figure 9
Figure 9
Boxplots of the maximum CC-flow (top), CC-volume (middle), and ΔCO2|i values (bottom) per patient and for the whole population (MUV database). A noticeable variability between patients was observed. Note the stable measurements in patient 2, in contrast with the dispersion in the other cases.
Figure 10
Figure 10
Scatter plot of ΔCO2|i versus passive volume, Vi, caused by CCs (MUV database). The red line corresponds to the linear regression model, which yielded a Pearson correlation coefficient R of 0.4 (moderate positive correlation).
Figure 11
Figure 11
Examples of distorted capnogram plateau (similar to the representation in Figure 4B), showing different behaviour in relation to CO2 drop, passive CC-volume and CC-flow (green dots) (MUV database). (A) Increasing ΔCO2 values despite stable CC-volumes. (B) Stable ΔCO2 values and CC-volumes. Top, left labels: Mean values of the annotations along the whole time interval.
Figure 12
Figure 12
RF events causing capnogram oscillations (bottom panel, green arrows). Red arrows on top of the figure indicate individual CCs. Red dashed lines indicate the onset of inspiration and red dotted lines the offset of expiration. Events of RF cause distortion in the volume signal (middle panel) that affect differently the capnogram pattern. Upward oscillations in the capnogram baseline (green down-arrowhead) and downward oscillations in the plateau (green up-arrowhead) resemble pseudo-expirations and pseudo-inspirations, respectively. Segments extracted from the MUV database.

References

    1. Meaney P.A., Bobrow B.J., Mancini M.E., Christenson J., De Caen A.R., Bhanji F., Abella B.S., Kleinman M.E., Edelson D.P., Berg R.A., et al. Cardiopulmonary resuscitation quality: Improving cardiac resuscitation outcomes both inside and outside the hospital: A consensus statement from the American Heart Association. Circulation. 2013;128:417–435. doi: 10.1161/CIR.0b013e31829d8654. - DOI - PubMed
    1. Gul S.S., Cohen S.A., Avery K.L., Balakrishnan M.P., Balu R., Chowdhury M.A.B., Crabb D., Huesgen K.W., Hwang C.W., Maciel C.B., et al. Cardiac arrest: An interdisciplinary review of the literature from 2018. Resuscitation. 2020;148:66–82. doi: 10.1016/j.resuscitation.2019.12.030. - DOI - PubMed
    1. Neth M.R., Idris A., McMullan J., Benoit J.L., Daya M.R. A review of ventilation in adult out-of-hospital cardiac arrest. J. Am. Coll. Emerg. Physicians Open. 2020;1:190–201. doi: 10.1002/emp2.12065. - DOI - PMC - PubMed
    1. Dorph E., Wik L., Strømme T., Eriksen M., Steen P. Oxygen delivery and return of spontaneous circulation with ventilation: Compression ratio 2: 30 versus chest compressions only CPR in pigs. Resuscitation. 2004;60:309–318. doi: 10.1016/j.resuscitation.2003.12.001. - DOI - PubMed
    1. Idris A.H., Banner M.J., Wenzel V., Fuerst R.S., Becker L.B., Melker R.J. Ventilation caused by external chest compression is unable to sustain effective gas exchange during CPR: A comparison with mechanical ventilation. Resuscitation. 1994;28:143–150. doi: 10.1016/0300-9572(94)90087-6. - DOI - PubMed

LinkOut - more resources