. 2023 Oct 24;12(21):3666.
doi: 10.3390/plants12213666.

Anti-Melanogenic Effects of Lilium lancifolium Root Extract via Downregulation of PKA/CREB and MAPK/CREB Signaling Pathways in B16F10 Cells

Affiliations

Anti-Melanogenic Effects of Lilium lancifolium Root Extract via Downregulation of PKA/CREB and MAPK/CREB Signaling Pathways in B16F10 Cells

Seokmuk Park et al. Plants (Basel). .

Abstract

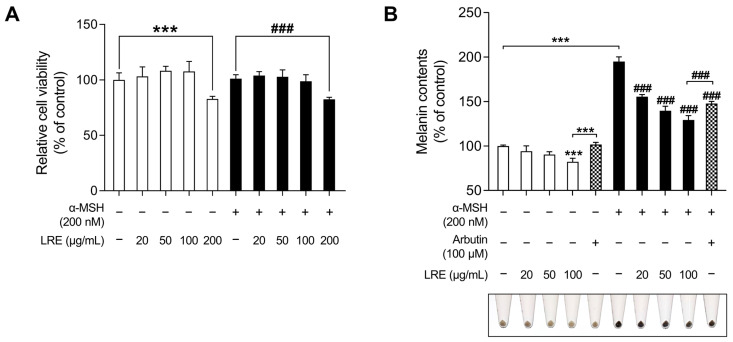
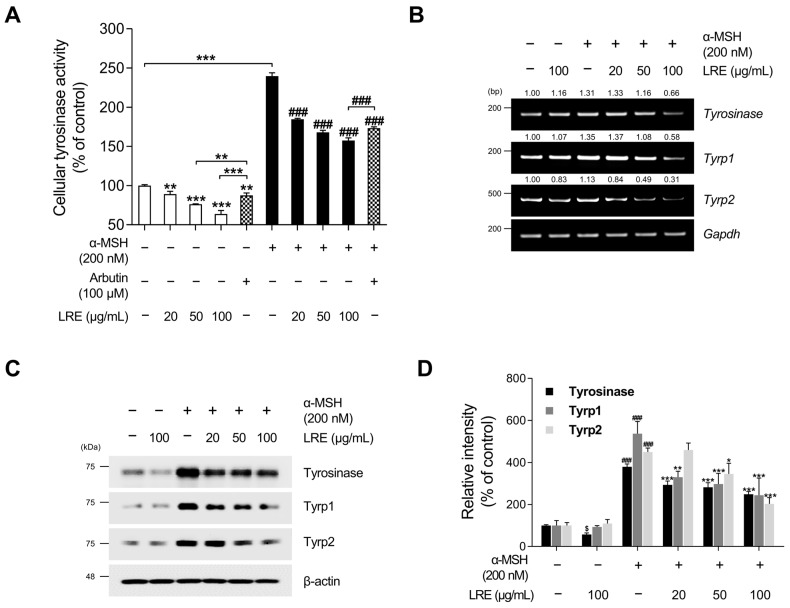
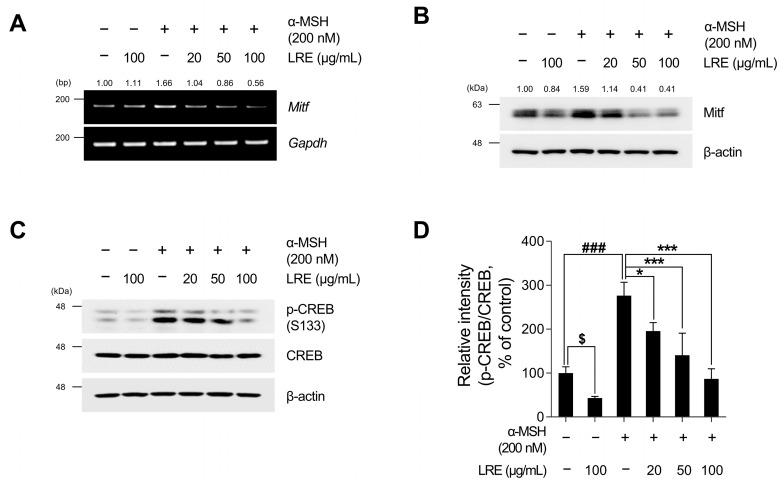
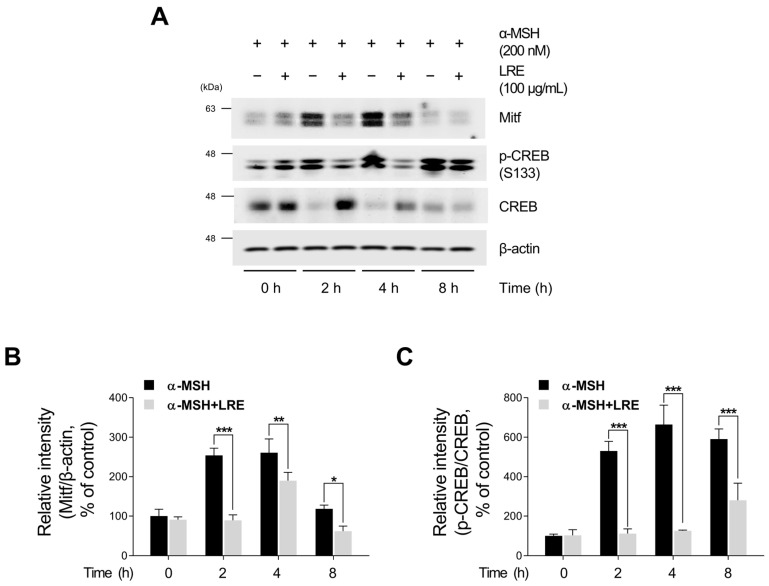
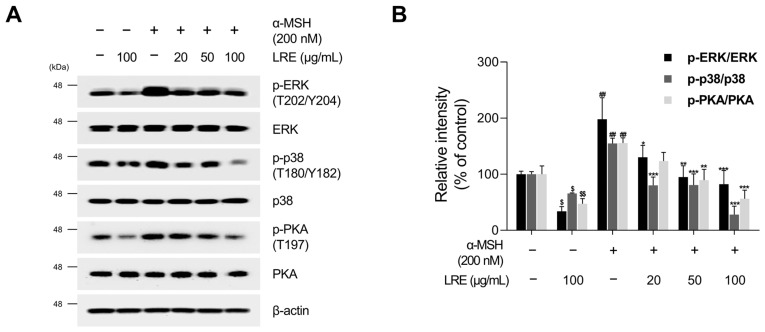
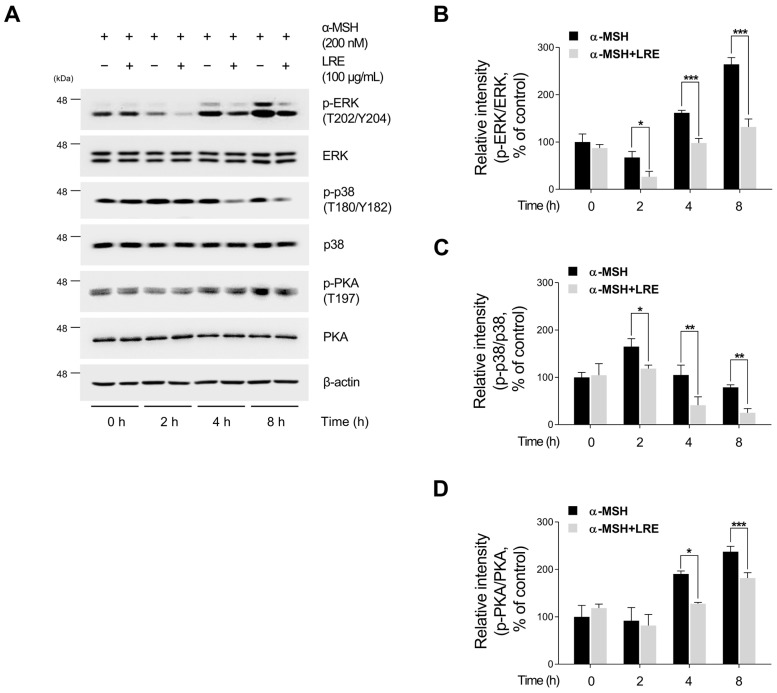
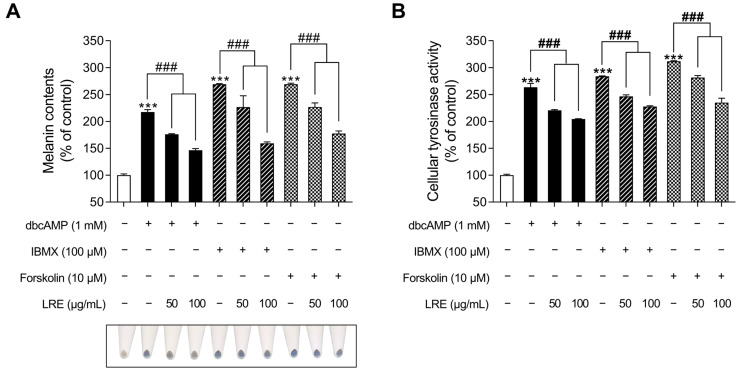
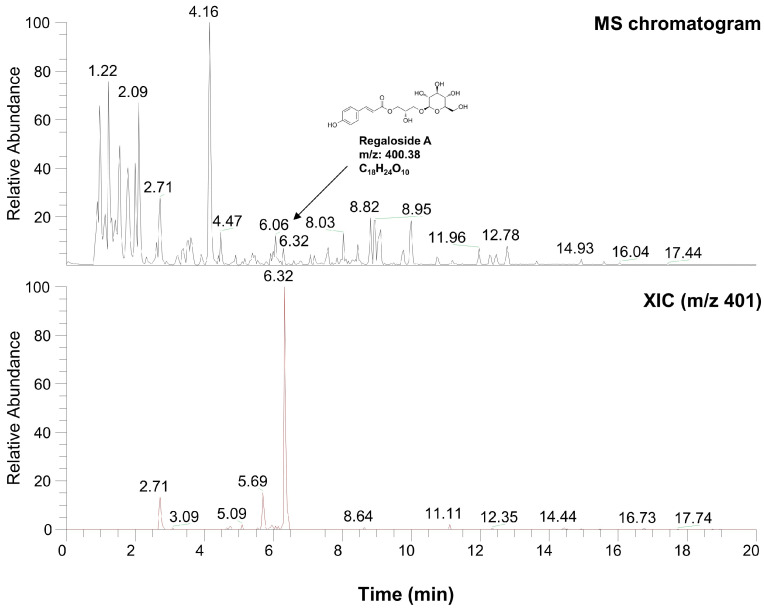
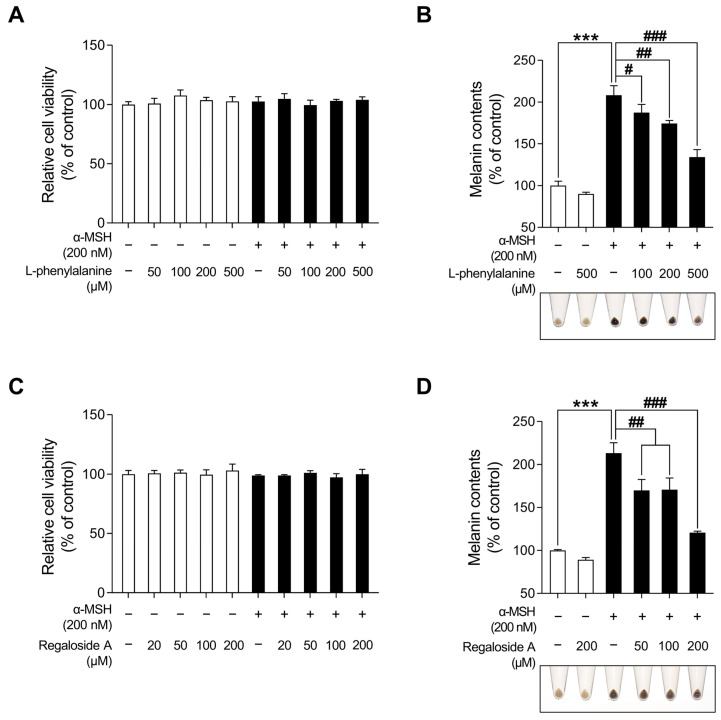
Hyperpigmentation disorders causing emotional distress require the topical use of depigmenting agents of natural origin. In this study, the anti-melanogenic effects of the Lilium lancifolium root extract (LRE) were investigated in B16F10 cells. Consequently, a non-cytotoxic concentration of the extract reduced intracellular melanin content and tyrosinase activity in a dose-dependent manner, correlating with the diminished expression of core melanogenic enzymes within cells. LRE treatment also inhibited cyclic adenosine monophosphate (cAMP) response element-binding protein (CREB)/microphthalmia-associated transcription factor signaling, which regulates the expression of tyrosinase-related genes. Upon examining these findings from a molecular mechanism perspective, LRE treatment suppressed the phosphorylation of protein kinase A (PKA), p38, and extracellular signal-related kinase (ERK), which are upstream regulators of CREB. In addition, L-phenylalanine and regaloside A, specifically identified within the LRE using liquid chromatography-mass spectrometry, exhibited inhibitory effects on melanin production. Collectively, these results imply that LRE potentially suppresses cAMP-mediated melanogenesis by downregulating PKA/CREB and mitogen-activated protein kinase (MAPK)/CREB signaling pathways. Therefore, it can be employed as a novel therapeutic ingredient of natural origin to ameliorate hyperpigmentation disorders.

Keywords: B16F10; L-phenylalanine; Lilium lancifolium; anti-melanogenic effect; melanin; melanogenesis; regaloside A; α-melanocyte stimulating hormone (α-MSH).


Conflict of interest statement

The authors declare no conflict of interest.

Figures

Figure 1
Figure 1
Effects of Lilium lancifolium (L. lancifolium) root extract on cell viability and melanin production in B16F10 cells. (A) B16F10 cells were seeded in 96-well plates (2 × 10³ cells/well) and incubated for 24 h. The cells were treated with the indicated concentrations of LRE and α-MSH for 48 h. Cell viability of B16F10 was measured via a WST-1 assay. (B) The cells were seeded in 60 mm dishes (1 × 10⁵ cells) and incubated for 24 h. The cells were treated with indicated concentrations of LRE, α-MSH, and arbutin for 48 h. Arbutin was utilized as the positive control. Intracellular melanin content was measured following stimulation with or without α-MSH and subsequent treatment with LRE. The results are presented as the mean ± SD of three independent experiments and were analyzed using a one-way analysis of variance followed by Tukey’s test. LRE, Lilium lancifolium root extract; WST-1, water-soluble tetrazolium salt-1; α-MSH, alpha-melanocyte-stimulating hormone. ###, *** p < 0.001.
Figure 2
Figure 2
Effects of L. lancifolium root extract on cellular tyrosinase activity and melanogenic enzyme expression. (A) B16F10 cells were seeded in 60 mm dishes (1 × 10⁵ cells) and incubated for 24 h. The cells were treated with the indicated concentrations of LRE, α-MSH, and arbutin for 48 h. Intracellular tyrosinase activity was assessed following treatment of B16F10 cells with LRE and stimulation with or without α-MSH. (B) B16F10 cells were seeded in 60 mm dishes (1 × 10⁵ cells) and incubated for 24 h. The cells were then treated with the indicated concentrations of LRE and α-MSH for 24 h. mRNA levels of tyrosinase-related genes (tyrosinase, Tyrp1, and Tyrp2) were detected via RT-PCR, with GAPDH serving as a loading control. (C) B16F10 cells were incubated with the indicated concentrations of LRE and α-MSH for 48 h. Protein levels of tyrosinase-related enzymes (tyrosinase, Tyrp1, and Tyrp2) were analyzed via Western blotting, with β-actin serving as a loading control. (D) Quantitation of protein level was conducted using ImageJ software version 1.53t. The results are presented as the mean ± SD of three independent experiments and were analyzed using a one-way analysis of variance followed by Tukey’s test. RT-PCR, reverse-transcription polymerase chain reaction; mRNA, messenger RNA. $, * p < 0.05; ** p < 0.01; ###, *** p < 0.001.
Figure 3
Figure 3
Effects of L. lancifolium root extract on the CREB/Mitf signaling pathway. (A) B16F10 cells were seeded in 60 mm dishes (2 × 10⁵ cells) and incubated for 24 h. The cells were treated with the indicated concentrations of LRE and α-MSH for 24 h. The mRNA levels of Mitf were detected via RT-PCR, with GAPDH serving as a loading control. (B) The cells were incubated with the indicated concentrations of LRE and α-MSH for 24 h. The Mitf protein levels were analyzed via Western blotting, while β-actin served as a loading control. (C) The cells were incubated with the indicated concentrations of LRE and α-MSH for 12 h. The protein levels and phosphorylation of CREB were analyzed via Western blotting, while β-actin served as a loading control. (D) Quantitation of protein levels was conducted using ImageJ software version 1.53t. The results are presented as the mean ± SD of three independent experiments and were analyzed using a one-way analysis of variance followed by Tukey’s test. CREB, cyclic adenosine monophosphate response element-binding protein; Mitf, microphthalmia-associated transcription factor. $, * p < 0.05; ###, *** p < 0.001.
Figure 4
Figure 4
Effects of L. lancifolium root extract on the CREB/Mitf signaling pathway, depending on treatment duration. (A) Mitf, p-CREB, and CREB protein levels were examined at different time points after co-treatment with LRE (100 µg/mL) and α-MSH (200 nM). The protein levels were determined via Western blotting, while β-actin served as a loading control. (B,C) Quantitation of protein levels was conducted using ImageJ software version 1.53t. The results are presented as the mean ± SD of three independent experiments and were analyzed using a one-way analysis of variance followed by Tukey’s test. * p < 0.05; ** p < 0.01; *** p < 0.001.
Figure 5
Figure 5
Effects of L. lancifolium root extract on the PKA/CREB and MAPK/CREB signaling pathways. (A) B16F10 cells were seeded in 60 mm dishes (2 × 10⁵ cells) and incubated for 24 h. The cells were treated with the indicated concentrations of LRE and α-MSH for 12 h. The protein levels of CREB upstream signaling were assessed via Western blotting, with β-actin serving as a loading control. (B) Protein levels were quantified using ImageJ software version 1.53t. The results are presented as the mean ± SD of three independent experiments and were analyzed using a one-way analysis of variance followed by Tukey’s test. PKA, protein kinase A; MAPK, mitogen-activated protein kinase. *, $ p < 0.05; **, ##, $$ p < 0.01; *** p < 0.001.
Figure 6
Figure 6
Effects of L. lancifolium root extract on the PKA/CREB and MAPK/CREB signaling pathways depending on treatment duration. (A) B16F10 cells were seeded in 60 mm dishes (2 × 10⁵ cells) and incubated for 24 h. The cells were treated with the indicated concentrations of LRE and α-MSH for 2, 4, and 8 h. The protein levels of CREB upstream signaling were assessed via Western blotting, with β-actin serving as a loading control. (BD) Protein levels were quantified using ImageJ software version 1.53t. The results are presented as the mean ± SD of three independent experiments and were analyzed using a one-way analysis of variance followed by Tukey’s test. ERK, extracellular signal-related kinase. * p < 0.05; ** p < 0.01; *** p < 0.001.
Figure 7
Figure 7
Effects of L. lancifolium root extract on cAMP-mediated melanogenesis. (A) B16F10 cells were seeded in 60 mm dishes (1 × 10⁵ cells) and incubated for 24 h. The cells were treated with indicated concentrations of LRE and cAMP inducer (dbcAMP, IBMX, and FSK) for 48 h. Intracellular melanin contents were determined following stimulation with or without cAMP inducer and treatment with LRE. (B) The cells were seeded in 60 mm dishes (1 × 10⁵ cells) and incubated for 24 h. The cells were treated with the indicated concentrations of LRE and cAMP inducer for 48 h. Intracellular tyrosinase activity was determined following treatment of B16F10 cells with LRE and stimulation with or without cAMP inducer. The results are presented as the mean ± SD of three independent experiments and were analyzed using a one-way analysis of variance followed by Tukey’s test. dbcAMP, dibutyryl-cAMP; IBMX, 3-isobutyl-1-methylxanthine; FSK, forskolin; cAMP, cyclic adenosine monophosphate. ***, ### p < 0.001.
Figure 8
Figure 8
Characterization of compounds from L. lancifolium extract using high-performance liquid chromatography-high-resolution mass spectrometry analysis.
Figure 9
Figure 9
Effects of L-phenylalanine and regaloside A on cell viability and melanin production in B16F10 cells. (A,C) B16F10 cells were seeded in 96-well plates (2 × 10³ cells/well) and incubated for 24 h. The cells were treated with the indicated concentrations of L-phenylalanine or reglaoside A, with or without α-MSH for 48 h. Cell viability of B16F10 was measured via the WST-1 assay. (B,D) The cells were seeded in 60 mm dishes (1 × 10⁵ cells) and incubated for 24 h. The cells were treated with the indicated concentrations of L-phenylalanine or regaloside A, with or without α-MSH for 48 h. Intracellular melanin contents were determined following stimulation with or without α-MSH and treatment with L-phenylalanine or regaloside A. The results are presented as the mean ± SD of three independent experiments and were analyzed using a one-way analysis of variance analysis followed by Tukey’s test. # p < 0.05; ## p < 0.01; ***, ### p < 0.001.

Similar articles

Cited by

References

    1. Brenner M., Hearing V.J. The protective role of melanin against UV damage in human skin. Photochem. Photobiol. 2008;84:539–549. doi: 10.1111/j.1751-1097.2007.00226.x. - DOI - PMC - PubMed
    1. Montagna W., Carlisle K. The architecture of black and white facial skin. J. Am. Acad. Dermatol. 1991;24:929–937. doi: 10.1016/0190-9622(91)70148-U. - DOI - PubMed
    1. Swalwell H., Latimer J., Haywood R.M., Birch-Machin M.A. Investigating the role of melanin in UVA/UVB-and hydrogen peroxide-induced cellular and mitochondrial ROS production and mitochondrial DNA damage in human melanoma cells. Free Radic. Biol. Med. 2012;52:626–634. doi: 10.1016/j.freeradbiomed.2011.11.019. - DOI - PubMed
    1. Bourhim T., Villareal M.O., Gadhi C., Hafidi A., Isoda H. Depigmenting effect of argan press-cake extract through the down-regulation of Mitf and melanogenic enzymes expression in B16 murine melanoma cells. Cytotechnology. 2018;70:1389–1397. doi: 10.1007/s10616-018-0232-6. - DOI - PMC - PubMed
    1. Lerner A.B., Fitzpatrick T.B. Biochemistry of melanin formation. Physiol. Rev. 1950;30:91–126. doi: 10.1152/physrev.1950.30.1.91. - DOI - PubMed

LinkOut - more resources