. 2023 Oct 25;12(21):3687.
doi: 10.3390/plants12213687.

Genome-Wide Characterization of bHLH Family Genes and Expression Analysis in Response to Osmotic Stress in Betula platyphylla

Affiliations

Genome-Wide Characterization of bHLH Family Genes and Expression Analysis in Response to Osmotic Stress in Betula platyphylla

Leifei Zhao et al. Plants (Basel). .

Abstract

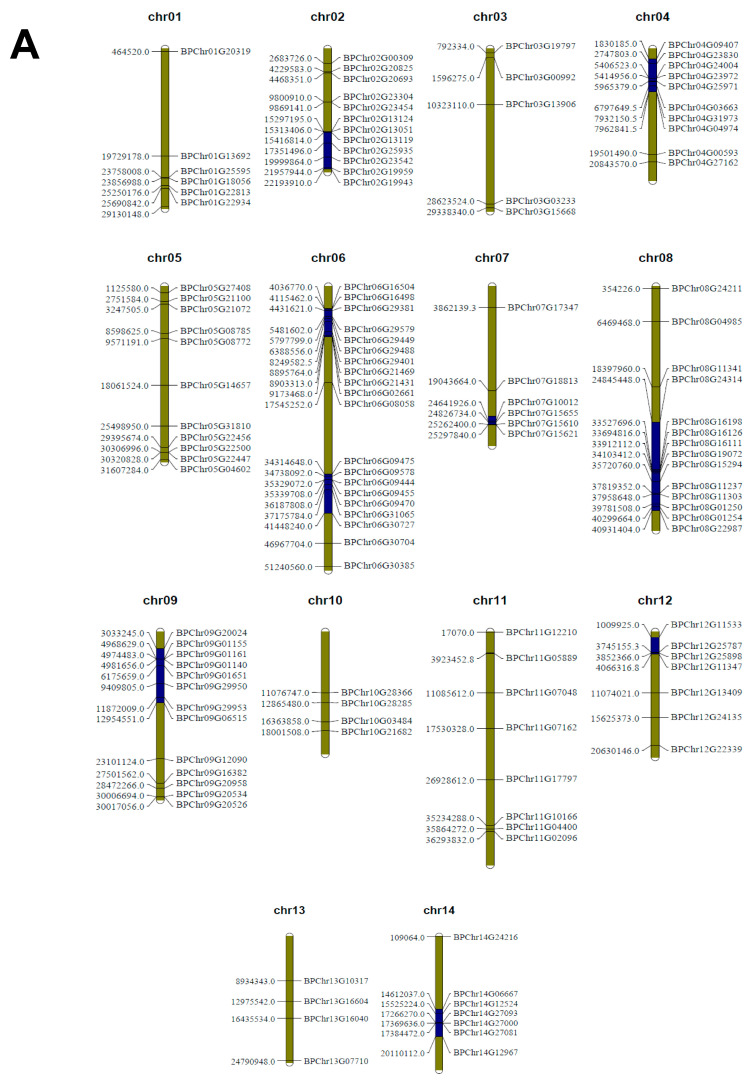
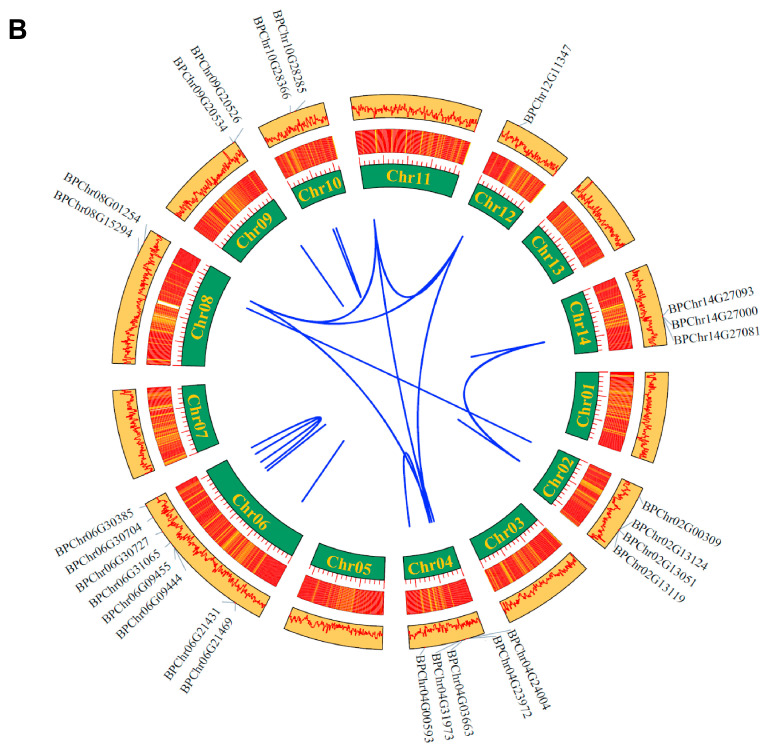
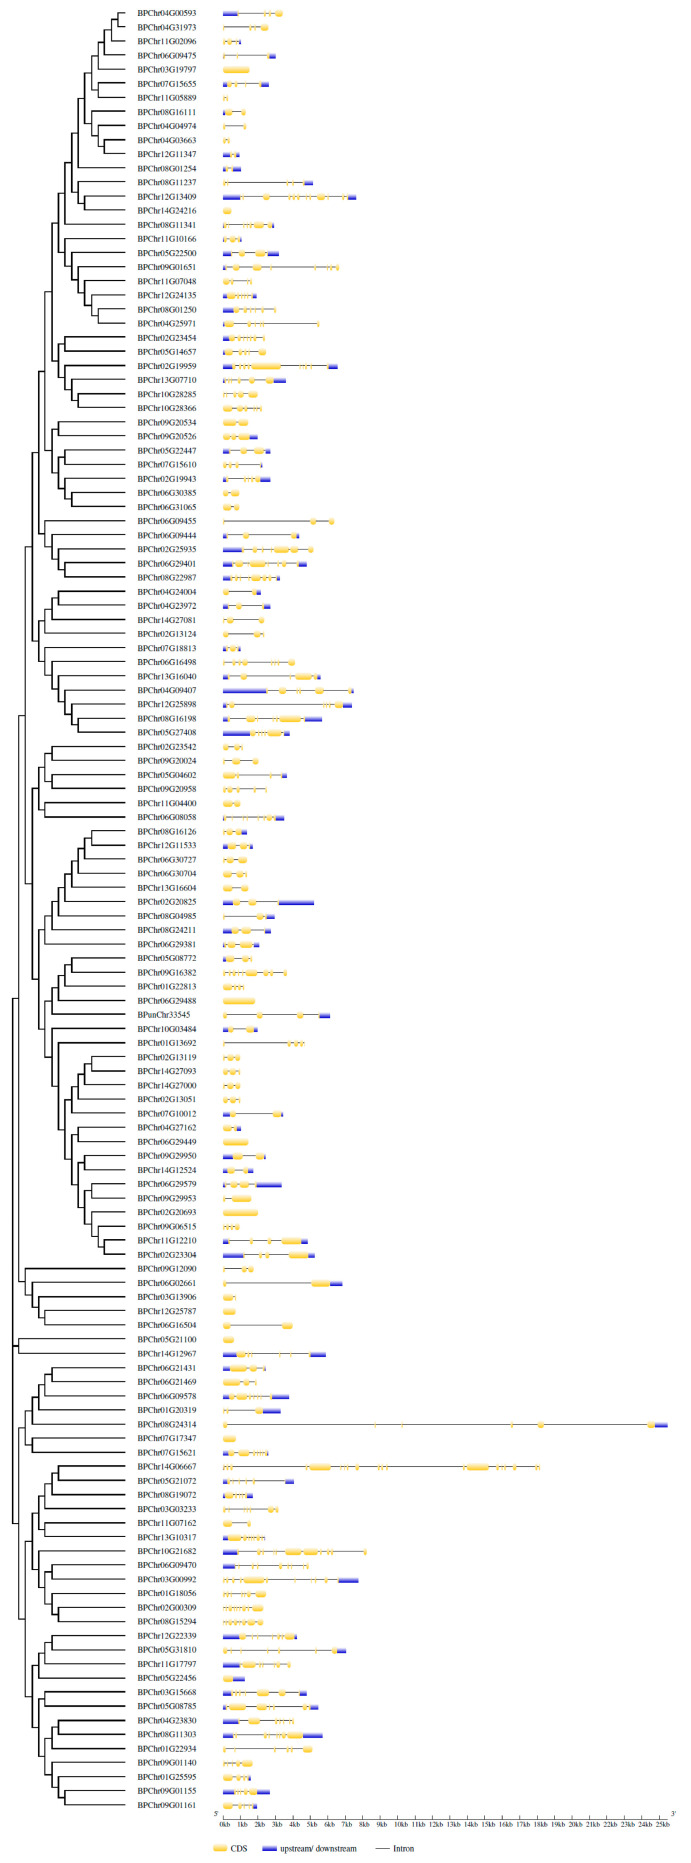
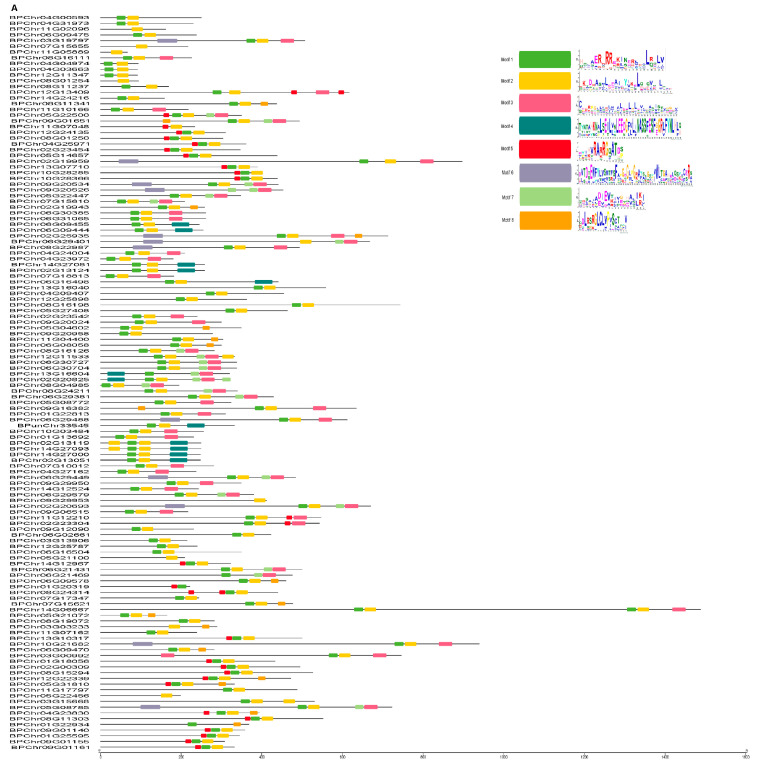
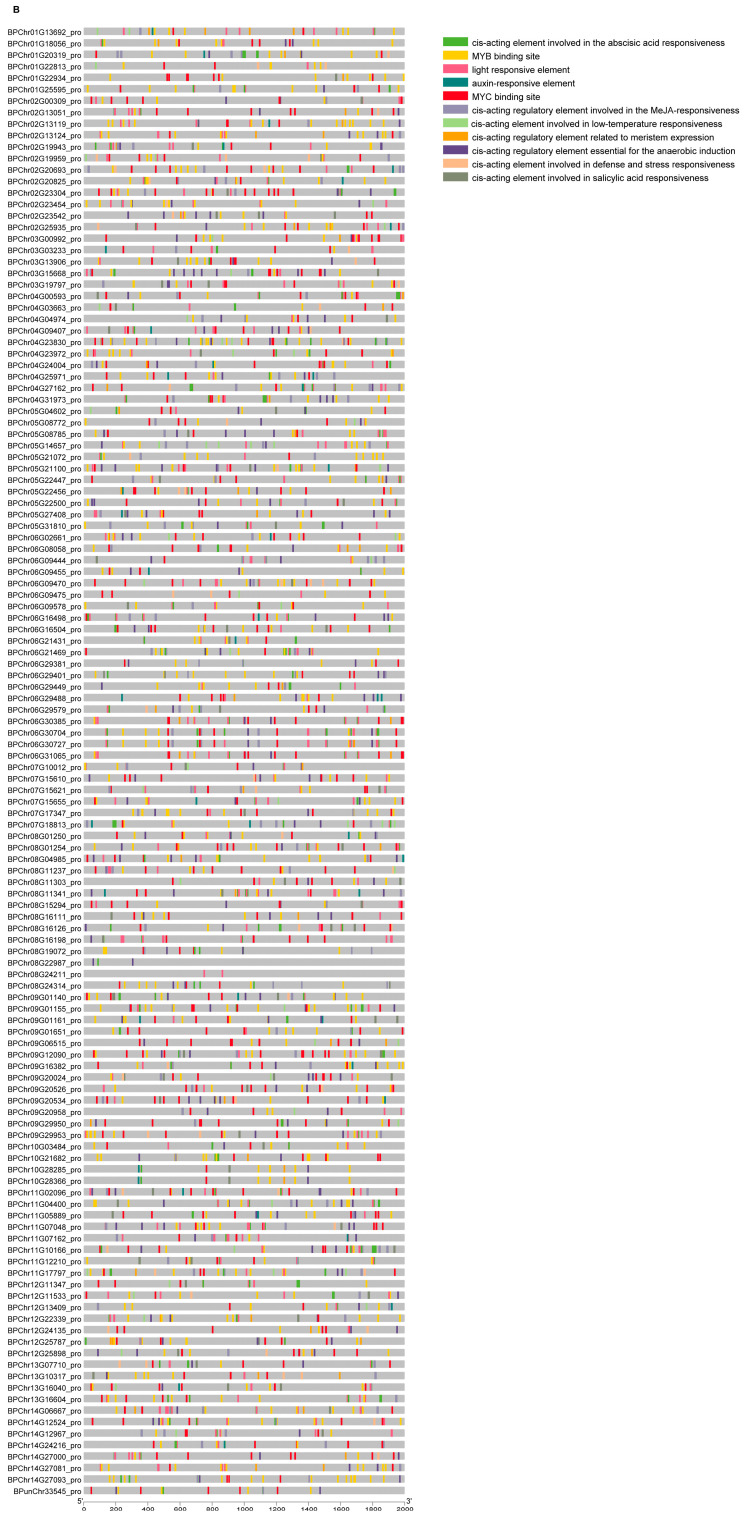
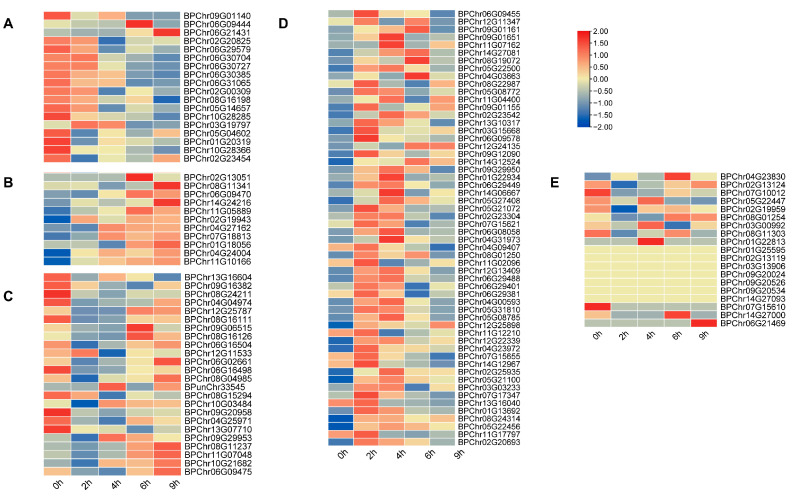
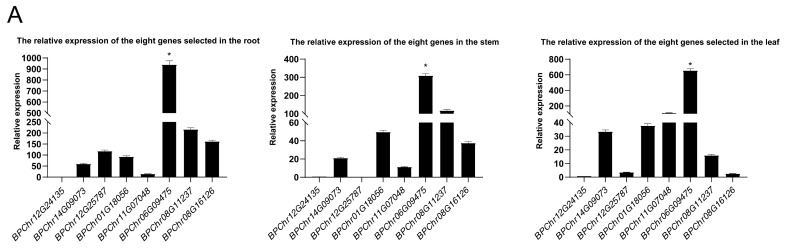
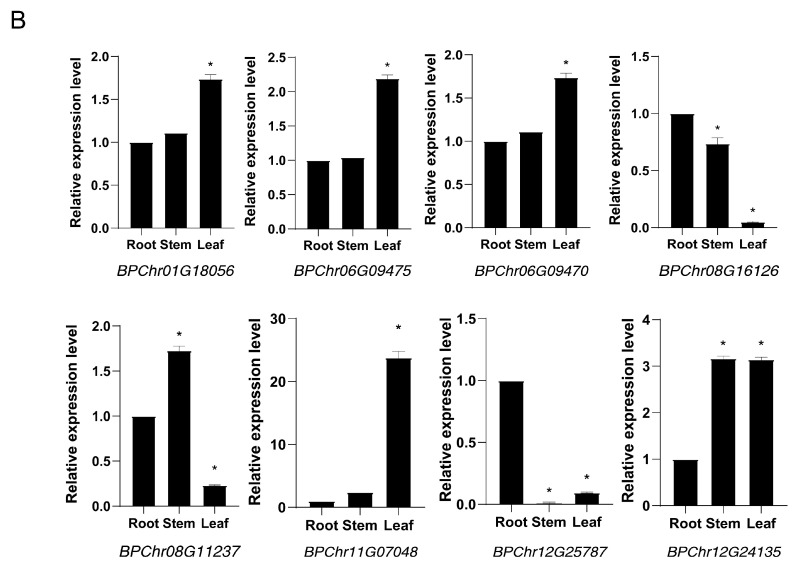
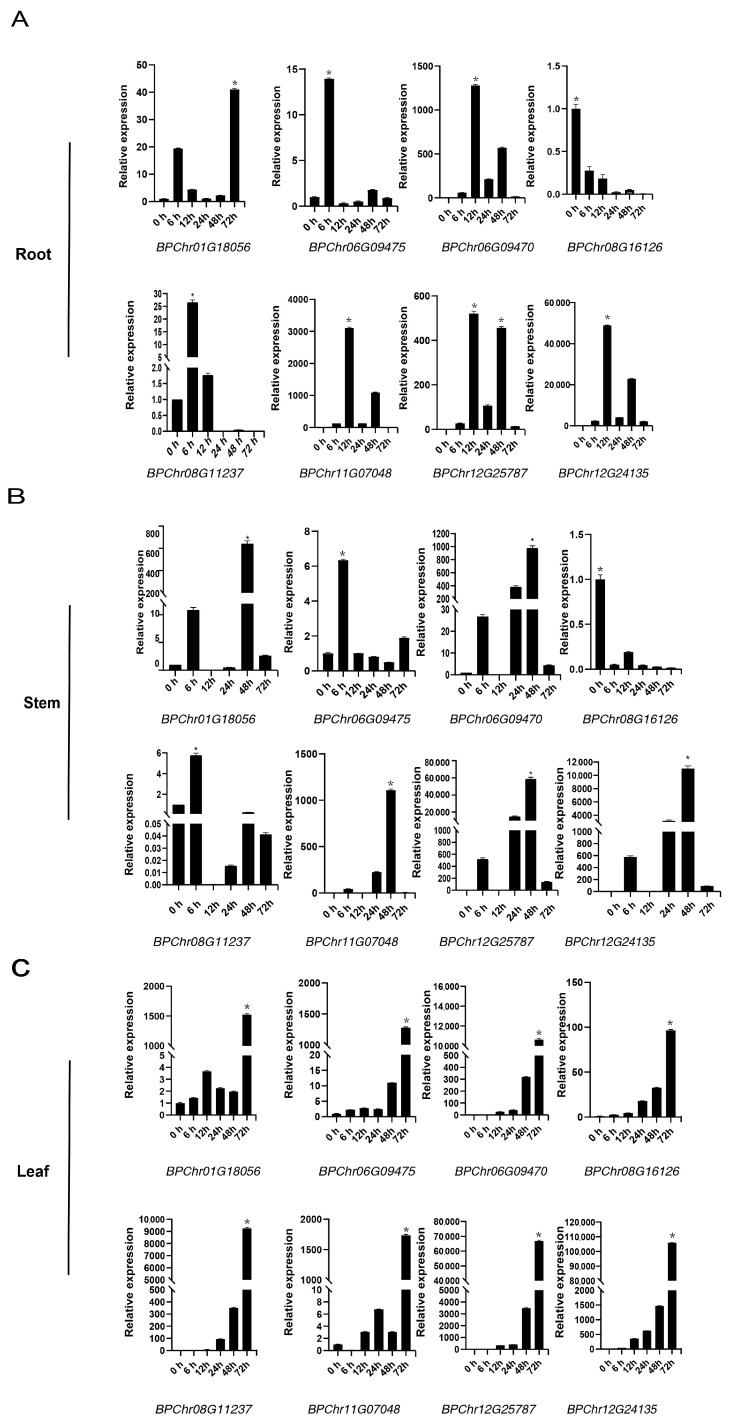
The bHLH family, as a superfamily of transcription factors (TFs), has special functional characteristics in plants and plays a crucial role in a plant's growth and development and helping the plant cope with various stresses. In this study, 128 bHLH family genes were screened in the birch (B. platyphylla) genome using conservative domain scan and blast analysis. These genes are clustered into 21 subfamilies based on the phylogenetic tree construction and are unevenly distributed among the 14 birch chromosomes. In all, 22 segmental duplication pairs with 27 BpbHLH genes were identified. The duplications were distributed on eight chromosomes. Analysis of gene structures and protein motifs revealed intra-group conservation of BpbHLHs. Of the BpbHLH family genes, 16 contain only one intron each. The BPChr14G06667 gene contains the most introns, that is, 19. The cis-elements, which respond to plant hormones, light, defense, and stress, were found on the promoter of BHLH family genes. As per RNA-seq data analysis, under PEG osmotic stress, most BpbHLH genes were differentially expressed, and eight were highly differentially expressed. The qRT-PCR analysis results further indicated that BPChr06G09475 was the gene with the highest expression level in leaves, roots, and stems, and that the expression of these eight genes was higher in leaves than in roots and stems and upregulated in all three tissues under osmotic stress compared to the controls. The above analysis suggests that the BpbHLH family genes have a certain biological effect under drought stress that provides a basis for molecular breeding for stress resistance in birch.

Keywords: RNA-seq; bHLH; birch; drought stress; genome-wide; qRT-PCR.


Conflict of interest statement

The authors declare no conflict of interest.

Figures

Figure 1
Figure 1
Chromosomal localization and collinearity analysis of BpbHLH family genes. (A) Distribution of BpbHLH family genes in the 14 birch chromosomes. The vertical strips represent the birch chromosomes. The chromosome number is located at the top of each chromosome. The left side of the chromosome represents the position of the gene on the chromosome, and the right side of the chromosome is the gene ID. (B) Collinearity analysis of bHLH genes in birch. The circle plot represents the chromosomes of birch, and the identified collinear genes are linked by blue lines.
Figure 1
Figure 1
Chromosomal localization and collinearity analysis of BpbHLH family genes. (A) Distribution of BpbHLH family genes in the 14 birch chromosomes. The vertical strips represent the birch chromosomes. The chromosome number is located at the top of each chromosome. The left side of the chromosome represents the position of the gene on the chromosome, and the right side of the chromosome is the gene ID. (B) Collinearity analysis of bHLH genes in birch. The circle plot represents the chromosomes of birch, and the identified collinear genes are linked by blue lines.
Figure 2
Figure 2
Gene structure of BpbHLH family proteins. For gene structure analysis, exons and introns are shown in yellow boxes and black solid lines, respectively. Cluster analysis was carried out according to the results of phylogeny.
Figure 3
Figure 3
Protein motif and analysis of the cis-regulatory element in the promoter of BpbHLH family genes. (A) Analysis of protein motifs. Different motifs are displayed in boxes of different colors. (B) Prediction of cis-elements in the BpbHLH gene promoter. On the left is the gene ID, and different patterns on the right represent different cis-elements.
Figure 3
Figure 3
Protein motif and analysis of the cis-regulatory element in the promoter of BpbHLH family genes. (A) Analysis of protein motifs. Different motifs are displayed in boxes of different colors. (B) Prediction of cis-elements in the BpbHLH gene promoter. On the left is the gene ID, and different patterns on the right represent different cis-elements.
Figure 4
Figure 4
Expression profiles and gene replication events of BpbHLH family genes. The heatmap reflects the expression changes in BpbHLH genes in response to osmotic stress of whole plant for 0, 2, 4, 6, and 9 h. Red represents upregulation, and green represents downregulation. Class (A) represents genes that are downregulated under osmotic drought, Class (B) represents genes that are upregulated under osmotic drought, and Class (C) represents genes that are downregulated in early BHLH gene expression and upregulated in late BHLH gene expression during osmotic drought; Class (D) represents genes that upregulate the expression of BHLH genes in the early stage and downregulate BHLH genes in the late stage of osmotic drought, while Class (E) represents genes that do not show significant changes or responses to osmotic drought. The expression values were converted by log2. The error bar indicates the standard deviation (STD) of the three biological replicates (p < 0.05).
Figure 5
Figure 5
Expression of eight selected bHLH genes in different tissues of birch. Tissues from 3-month-old plants were used for the analysis. The relative expression of BPChr12G24135 in different tissues of birch was set as 1 to normalize its expression in other tissues. (A) The relative expression of eight selected bHLH genes in the roots, stems, and leaves of birch. (B) The relative expression level of eight different genes in the roots was set to 1 to normalize the expression of other genes in the stems and leaves. The relative expression levels of the eight selected genes in the roots, stems, and leaves. The expression value is 2−ΔΔt. The error bar indicates the standard deviation (STD) of the three biological replicates. The asterisk (*) represents significant difference compared with BPChr12G24135 (p < 0.05).
Figure 5
Figure 5
Expression of eight selected bHLH genes in different tissues of birch. Tissues from 3-month-old plants were used for the analysis. The relative expression of BPChr12G24135 in different tissues of birch was set as 1 to normalize its expression in other tissues. (A) The relative expression of eight selected bHLH genes in the roots, stems, and leaves of birch. (B) The relative expression level of eight different genes in the roots was set to 1 to normalize the expression of other genes in the stems and leaves. The relative expression levels of the eight selected genes in the roots, stems, and leaves. The expression value is 2−ΔΔt. The error bar indicates the standard deviation (STD) of the three biological replicates. The asterisk (*) represents significant difference compared with BPChr12G24135 (p < 0.05).
Figure 6
Figure 6
Three-month-old Betula platyphylla was treated with 20% PEG6000 for 0, 12, 24, 48, and 72 h. The relative expression of eight bHLH genes in roots, stems, and leaves was obtained. (A) Relative expression of the eight bHLH genes in the roots of B. platyphylla at different time points. (B) Relative expression of the eight bHLH genes in the stems of B. platyphylla at different time points. (C) Relative expression of the eight bHLH genes in the leaves of B. platyphylla at different time points. The expression value is 2−ΔΔt. The error bar indicates the standard deviation (STD) of the three biological replicates. The asterisk (*) represents significant difference compared with 0 h (p < 0.05).

Similar articles

Cited by

References

    1. Fang Y., Xiong L. General mechanisms of drought response and their application in drought resistance improvement in plants. Cell. Mol. Life Sci. 2015;72:673–689. doi: 10.1007/s00018-014-1767-0. - DOI - PMC - PubMed
    1. Sun X., Wang Y., Sui N. Transcriptional regulation of bHLH during plant response to stress. Biochem. Biophys. Res. Commun. 2018;503:397–401. doi: 10.1016/j.bbrc.2018.07.123. - DOI - PubMed
    1. Liu J.-X., Wu B., Feng K., Li M.-Y., Duan A.-Q., Shen D., Yin L., Xu Z.-S., Xiong A.-S. A celery transcriptional repressor AgERF8 negatively modulates abscisic acid and salt tolerance. Mol. Genet. Genom. 2020;296:179–192. doi: 10.1007/s00438-020-01738-x. - DOI - PubMed
    1. Han X., Zhao Y., Chen Y., Xu J., Jiang C., Wang X., Zhuo R., Lu M.-Z., Zhang J. Lignin biosynthesis and accumulation in response to abiotic stresses in woody plants. For. Res. 2022;2:9. doi: 10.48130/FR-2022-0009. - DOI
    1. Tikhomirova Tatyana S., Krutovsky Konstantin V., Shestibratov Konstantin A. Molecular Traits for Adaptation to Drought and Salt Stress in Birch, Oak and Poplar Species. Forests. 2022;14:7. doi: 10.3390/f14010007. - DOI