

Genome-Wide Investigation and Expression Analysis of the Catalase Gene Family in Oat Plants (Avena sativa L.)
- PMID: 37960051
- PMCID: PMC10650400
- DOI: 10.3390/plants12213694
Genome-Wide Investigation and Expression Analysis of the Catalase Gene Family in Oat Plants (Avena sativa L.)
Abstract
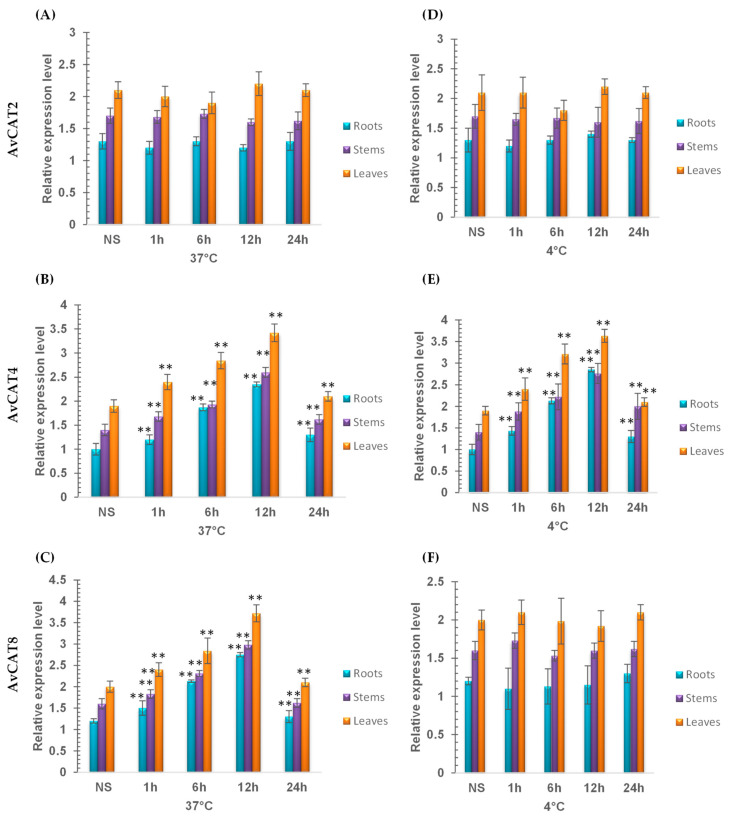
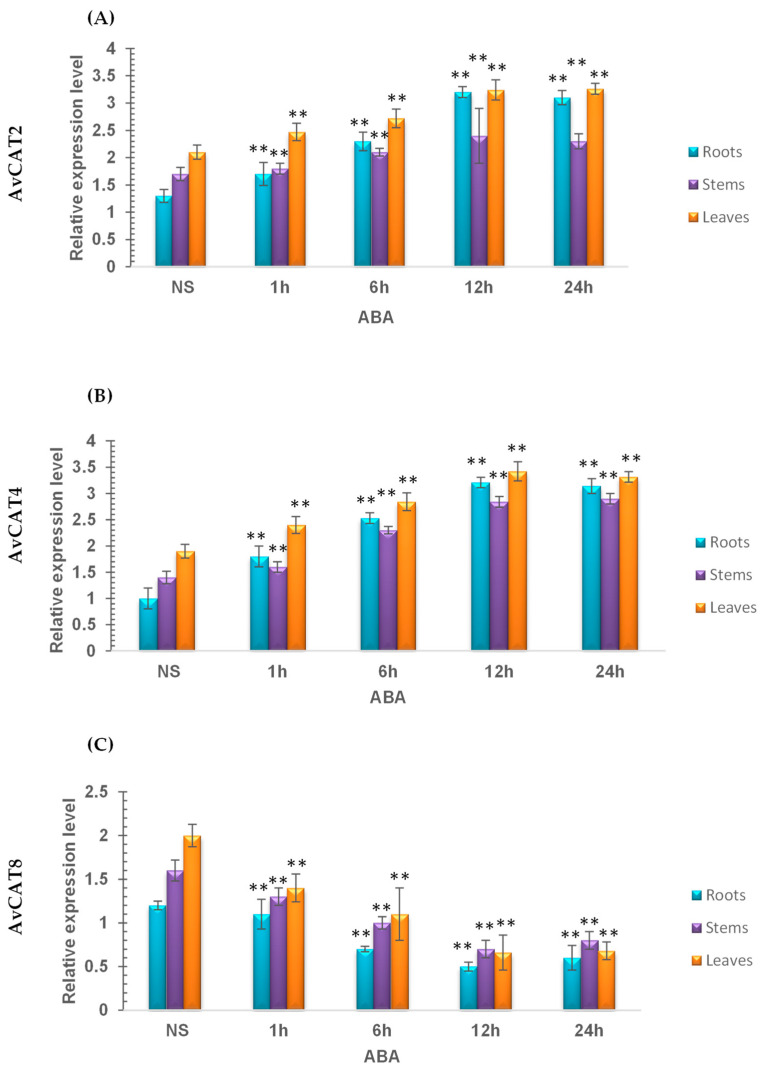
Through the degradation of reactive oxygen species (ROS), different antioxidant enzymes, such as catalase (CAT), defend organisms against oxidative stress. These enzymes are crucial to numerous biological functions, like plant development and defense against several biotic and abiotic stresses. However, despite the major economic importance of Avena sativa around the globe, little is known about the CAT gene's structure and organization in this crop. Thus, a genome-wide investigation of the CAT gene family in oat plants has been carried out to characterize the potential roles of those genes under different stressors. Bioinformatic approaches were used in this study to predict the AvCAT gene's structure, secondary and tertiary protein structures, physicochemical properties, phylogenetic tree, and expression profiling under diverse developmental and biological conditions. A local Saudi oat variety (AlShinen) was used in this work. Here, ten AvCAT genes that belong to three groups (Groups I-III) were identified. All identified CATs harbor the two conserved domains (pfam00199 and pfam06628), a heme-binding domain, and a catalase activity motif. Moreover, identified AvCAT proteins were located in different compartments in the cell, such as the peroxisome, mitochondrion, and cytoplasm. By analyzing their promoters, different cis-elements were identified as being related to plant development, maturation, and response to different environmental stresses. Gene expression analysis revealed that three different AvCAT genes belonging to three different subgroups showed noticeable modifications in response to various stresses, such as mannitol, salt, and ABA. As far as we know, this is the first report describing the genome-wide analysis of the oat catalase gene family, and these data will help further study the roles of catalase genes during stress responses, leading to crop improvement.
Keywords: Avena sativa L.; antioxidant enzymes; bioinformatic analysis; catalase; cis-elements regulators; oxidative stress.
Conflict of interest statement
The authors declare no conflict of interest.
Figures


Similar articles
-
Genome-Wide Identification and Expression Analysis of Catalase Gene Families in Triticeae.Plants (Basel). 2023 Dec 19;13(1):11. doi: 10.3390/plants13010011. Plants (Basel). 2023. PMID: 38202319 Free PMC article.
-
Catalase Gene Family in Durum Wheat: Genome-Wide Analysis and Expression Profiling in Response to Multiple Abiotic Stress Conditions.Plants (Basel). 2023 Jul 21;12(14):2720. doi: 10.3390/plants12142720. Plants (Basel). 2023. PMID: 37514334 Free PMC article.
-
Catalase (CAT) Gene Family in Rapeseed (Brassica napus L.): Genome-Wide Analysis, Identification, and Expression Pattern in Response to Multiple Hormones and Abiotic Stress Conditions.Int J Mol Sci. 2021 Apr 20;22(8):4281. doi: 10.3390/ijms22084281. Int J Mol Sci. 2021. PMID: 33924156 Free PMC article.
-
Genome-Wide Analysis of the Oat (Avena sativa) HSP90 Gene Family Reveals Its Identification, Evolution, and Response to Abiotic Stress.Int J Mol Sci. 2024 Feb 15;25(4):2305. doi: 10.3390/ijms25042305. Int J Mol Sci. 2024. PMID: 38396983 Free PMC article.
-
Epigenomics in stress tolerance of plants under the climate change.Mol Biol Rep. 2023 Jul;50(7):6201-6216. doi: 10.1007/s11033-023-08539-6. Epub 2023 Jun 9. Mol Biol Rep. 2023. PMID: 37294468 Review.
Cited by
-
Genome-Wide Identification and Expression Analysis of Catalase Gene Families in Triticeae.Plants (Basel). 2023 Dec 19;13(1):11. doi: 10.3390/plants13010011. Plants (Basel). 2023. PMID: 38202319 Free PMC article.
-
Trends and Directions in Oats Research under Drought and Salt Stresses: A Bibliometric Analysis (1993-2023).Plants (Basel). 2024 Jul 10;13(14):1902. doi: 10.3390/plants13141902. Plants (Basel). 2024. PMID: 39065428 Free PMC article. Review.
-
Genome-wide analysis of the COMT gene family in Avena sativa: insights into lignin biosynthesis and disease defense mechanisms.Front Plant Sci. 2025 Jun 19;16:1609698. doi: 10.3389/fpls.2025.1609698. eCollection 2025. Front Plant Sci. 2025. PMID: 40612596 Free PMC article.
-
Genome-wide analysis of the SWEET gene family and its response to powdery mildew and leaf spot infection in the common oat (Avena sativa L.).BMC Genomics. 2024 Oct 24;25(1):995. doi: 10.1186/s12864-024-10933-8. BMC Genomics. 2024. PMID: 39448896 Free PMC article.
-
Isolation and characterization of Avena sativa catalase 1 gene (AsCAT1) with potential role in plant response to abiotic stress conditions.Protoplasma. 2025 Jul 3. doi: 10.1007/s00709-025-02090-w. Online ahead of print. Protoplasma. 2025. PMID: 40610761
References
-
- Tuteja N. Mechanisms of High Salinity Tolerance in Plants. Methods Enzymol. 2007;428:419–438. - PubMed
-
- Sharma P., Jha A.B., Dubey R.S., Pessarakli M. Reactive Oxygen Species, Oxidative Damage, and Antioxidative Defense Mechanism in Plants under Stressful Conditions. J. Bot. 2012;2012:217037. doi: 10.1155/2012/217037. - DOI
LinkOut - more resources
Full Text Sources
Research Materials
Miscellaneous
