

QTL Verification and Candidate Gene Screening of Fiber Quality and Lint Percentage in the Secondary Segregating Population of Gossypium hirsutum
- PMID: 37960093
- PMCID: PMC10650182
- DOI: 10.3390/plants12213737
QTL Verification and Candidate Gene Screening of Fiber Quality and Lint Percentage in the Secondary Segregating Population of Gossypium hirsutum
Abstract
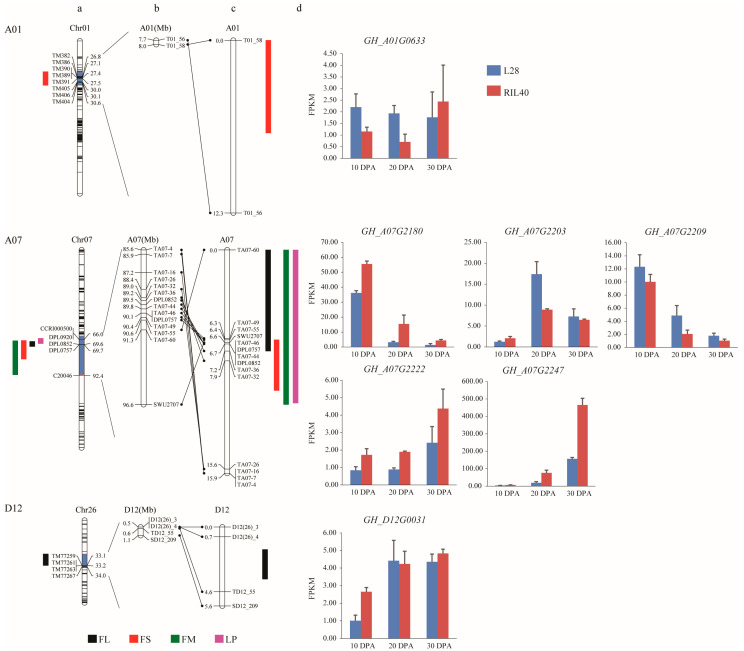
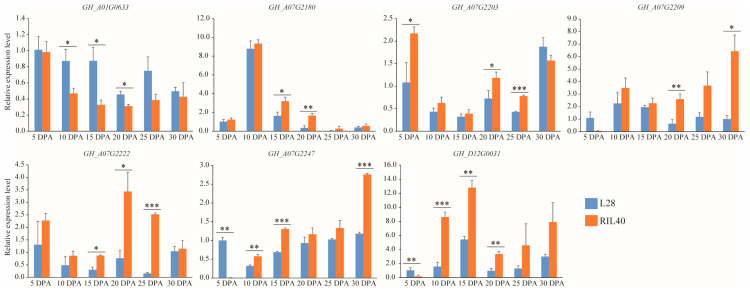
Fiber quality traits, especially fiber strength, length, and micronaire (FS, FL, and FM), have been recognized as critical fiber attributes in the textile industry, while the lint percentage (LP) was an important indicator to evaluate the cotton lint yield. So far, the genetic mechanism behind the formation of these traits is still unclear. Quantitative trait loci (QTL) identification and candidate gene validation provide an effective methodology to uncover the genetic and molecular basis of FL, FS, FM, and LP. A previous study identified three important QTL/QTL cluster loci, harboring at least one of the above traits on chromosomes A01, A07, and D12 via a recombinant inbred line (RIL) population derived from a cross of Lumianyan28 (L28) × Xinluzao24 (X24). A secondary segregating population (F2) was developed from a cross between L28 and an RIL, RIL40 (L28 × RIL40). Based on the population, genetic linkage maps of the previous QTL cluster intervals on A01 (6.70-10.15 Mb), A07 (85.48-93.43 Mb), and D12 (0.40-1.43 Mb) were constructed, which span 12.25, 15.90, and 5.56 cM, with 2, 14, and 4 simple sequence repeat (SSR) and insertion/deletion (Indel) markers, respectively. QTLs of FL, FS, FM, and LP on these three intervals were verified by composite interval mapping (CIM) using WinQTL Cartographer 2.5 software via phenotyping of F2 and its derived F2:3 populations. The results validated the previous primary QTL identification of FL, FS, FM, and LP. Analysis of the RNA-seq data of the developing fibers of L28 and RIL40 at 10, 20, and 30 days post anthesis (DPA) identified seven differentially expressed genes (DEGs) as potential candidate genes. qRT-PCR verified that five of them were consistent with the RNA-seq result. These genes may be involved in regulating fiber development, leading to the formation of FL, FS, FM, and LP. This study provides an experimental foundation for further exploration of these functional genes to dissect the genetic mechanism of cotton fiber development.
Keywords: Gossypium hirsutum; QTL; fiber quality; lint percentage; secondary segregating population.
Conflict of interest statement
The authors declare that the research was conducted in the absence of any commercial or financial relationship that could be construed as potential conflict of interest.
Figures

Similar articles
-
Identification of Candidate Genes for Lint Percentage and Fiber Quality Through QTL Mapping and Transcriptome Analysis in an Allotetraploid Interspecific Cotton CSSLs Population.Front Plant Sci. 2022 Apr 29;13:882051. doi: 10.3389/fpls.2022.882051. eCollection 2022. Front Plant Sci. 2022. PMID: 35574150 Free PMC article.
-
High-density linkage map construction and QTL analyses for fiber quality, yield and morphological traits using CottonSNP63K array in upland cotton (Gossypium hirsutum L.).BMC Genomics. 2019 Nov 21;20(1):889. doi: 10.1186/s12864-019-6214-z. BMC Genomics. 2019. PMID: 31771502 Free PMC article.
-
Fine mapping and RNA-Seq unravels candidate genes for a major QTL controlling multiple fiber quality traits at the T1 region in upland cotton.BMC Genomics. 2016 Apr 19;17:295. doi: 10.1186/s12864-016-2605-6. BMC Genomics. 2016. PMID: 27094760 Free PMC article.
-
Inheritance, QTLs, and Candidate Genes of Lint Percentage in Upland Cotton.Front Genet. 2022 Mar 31;13:855574. doi: 10.3389/fgene.2022.855574. eCollection 2022. Front Genet. 2022. PMID: 35450216 Free PMC article. Review.
-
Genome-wide association study reveals novel quantitative trait loci and candidate genes of lint percentage in upland cotton based on the CottonSNP80K array.Theor Appl Genet. 2022 Jul;135(7):2279-2295. doi: 10.1007/s00122-022-04111-1. Epub 2022 May 16. Theor Appl Genet. 2022. PMID: 35570221 Review.
References
-
- Islam M.S., Zeng L., Thyssen G.N., Delhom C.D., Kim H.J., Li P., Fang D.D. Mapping by sequencing in cotton (Gossypium hirsutum) line MD52ne identified candidate genes for fiber strength and its related quality attributes. Theor. Appl. Genet. 2016;129:1071–1086. doi: 10.1007/s00122-016-2684-4. - DOI - PubMed
-
- Song C., Li W., Pei X., Liu Y., Ren Z., He K., Zhang F., Sun K., Zhou X., Ma X., et al. Dissection of the genetic variation and candidate genes of lint percentage by a genome-wide association study in upland cotton. Theor. Appl. Genet. 2019;132:1991–2002. doi: 10.1007/s00122-019-03333-0. - DOI - PubMed
Grants and funding
- CAAS-ASTIP-2016-ICR/China Agriculture Research System of MOF and MARA, the National Agricultural Science and Technology Innovation Project for Chinese Academy of Agricultural Sciences
- 32070560, 32070563/the grants from the National Natural Science Foundation of China
- B21HJ0210/Hainan Yazhou Bay Seed Lab
- 2021D01B114/the Natural Science Foundation of Xinjiang Uygur Autonomous Region
LinkOut - more resources
Full Text Sources
Other Literature Sources
Miscellaneous
