. 2023 Oct 31;23(21):8877.
doi: 10.3390/s23218877.

WATCH-BPM-Comparison of a WATCH-Type Blood Pressure Monitor with a Conventional Ambulatory Blood Pressure Monitor and Auscultatory Sphygmomanometry

Affiliations

WATCH-BPM-Comparison of a WATCH-Type Blood Pressure Monitor with a Conventional Ambulatory Blood Pressure Monitor and Auscultatory Sphygmomanometry

Mathini Vaseekaran et al. Sensors (Basel). .

Abstract

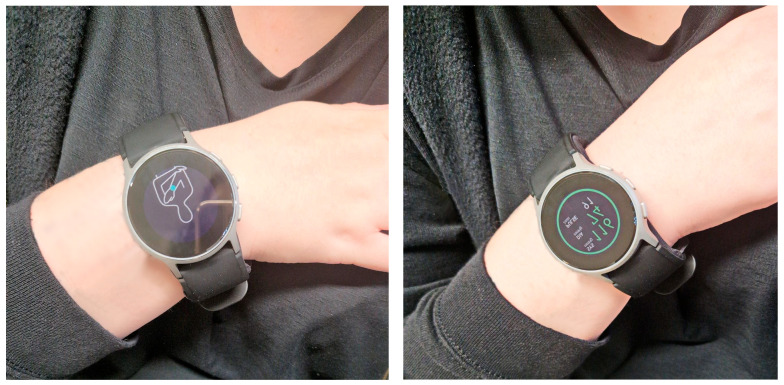
Background: Smart devices that are able to measure blood pressure (BP) are valuable for hypertension or heart failure management using digital technology. Data regarding their diagnostic accuracy in comparison to standard noninvasive measurement in accordance to Riva-Rocci are sparse. This study compared a wearable watch-type oscillometric BP monitor (Omron HeartGuide), a wearable watch-type infrared BP monitor (Smart Wear), a conventional ambulatory BP monitor, and auscultatory sphygmomanometry.

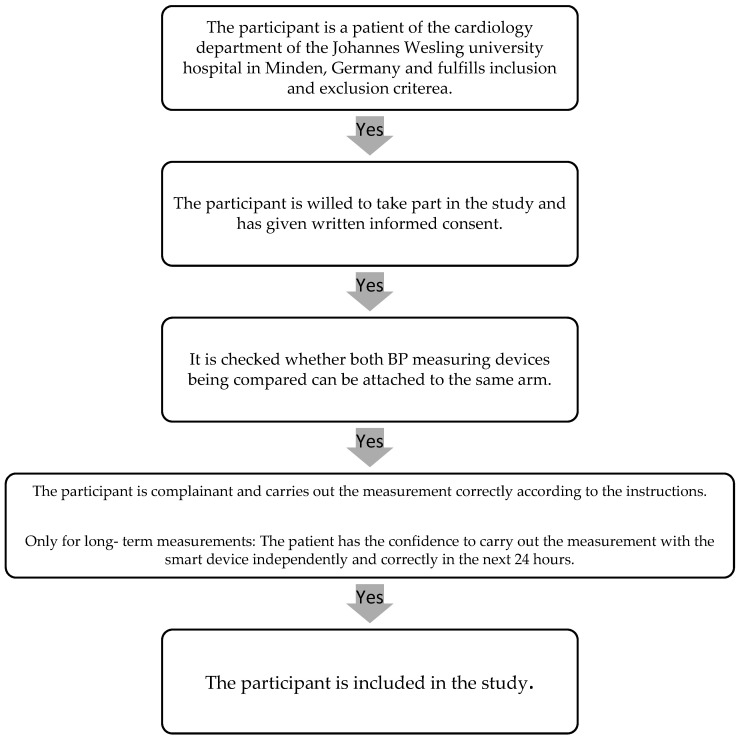
Methods: Therefore, 159 consecutive patients (84 male, 75 female, mean age 64.33 ± 16.14 years) performed observed single measurements with the smart device compared to auscultatory sphygmomanometry (n = 109) or multiple measurements during 24 h compared to a conventional ambulatory BP monitor on the upper arm (n = 50). The two BP monitoring devices were simultaneously worn on the same arm throughout the monitoring period. In a subgroup of 50 patients, single measurements were also performed with an additional infrared smart device.

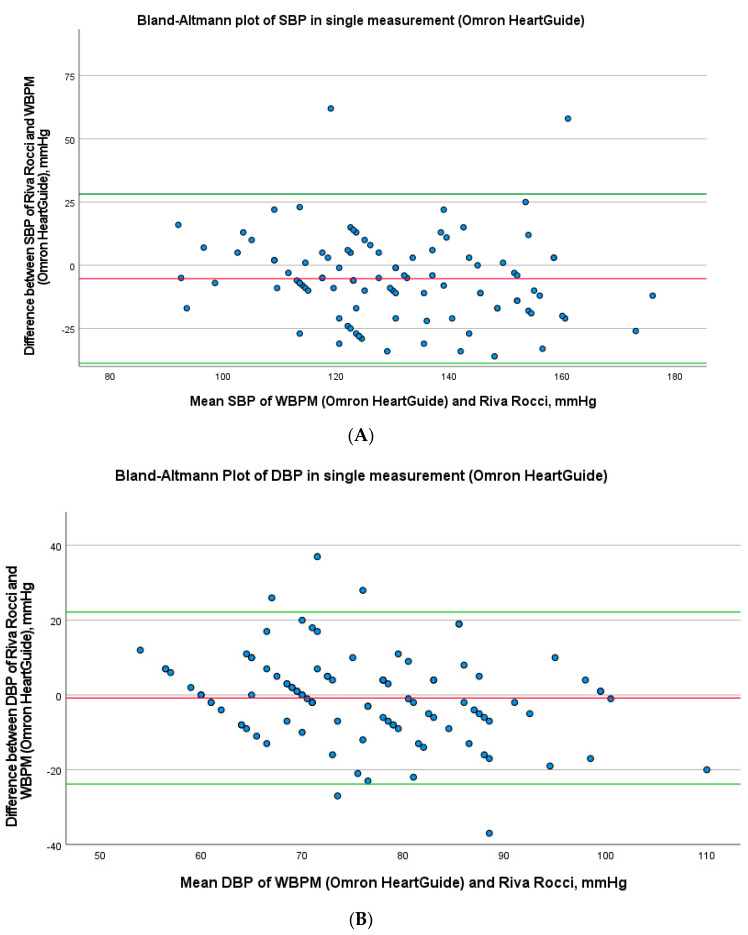
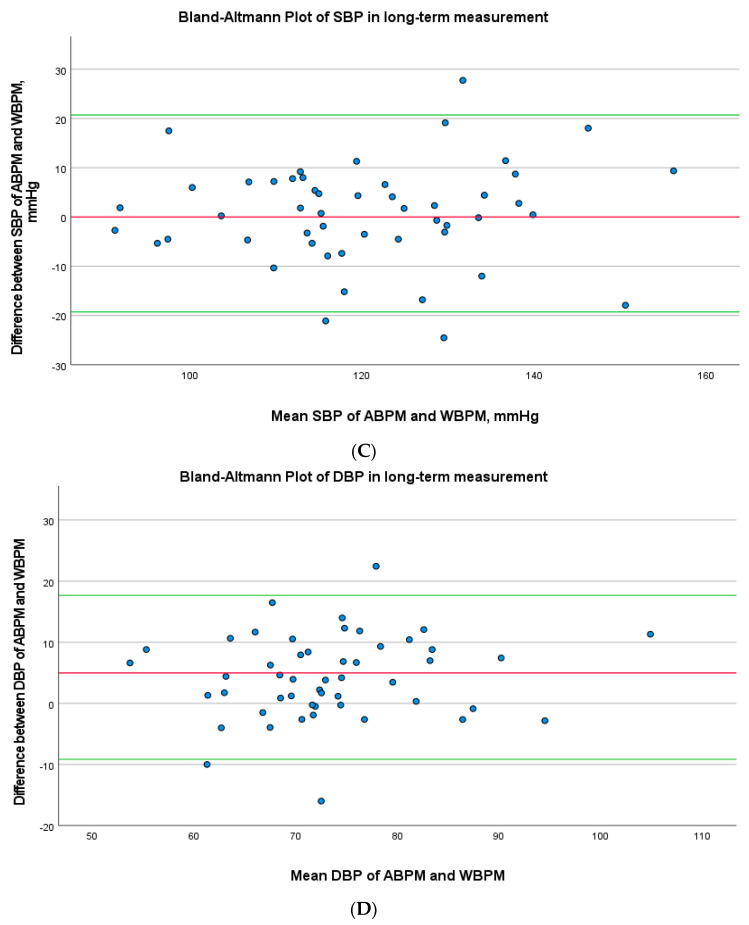
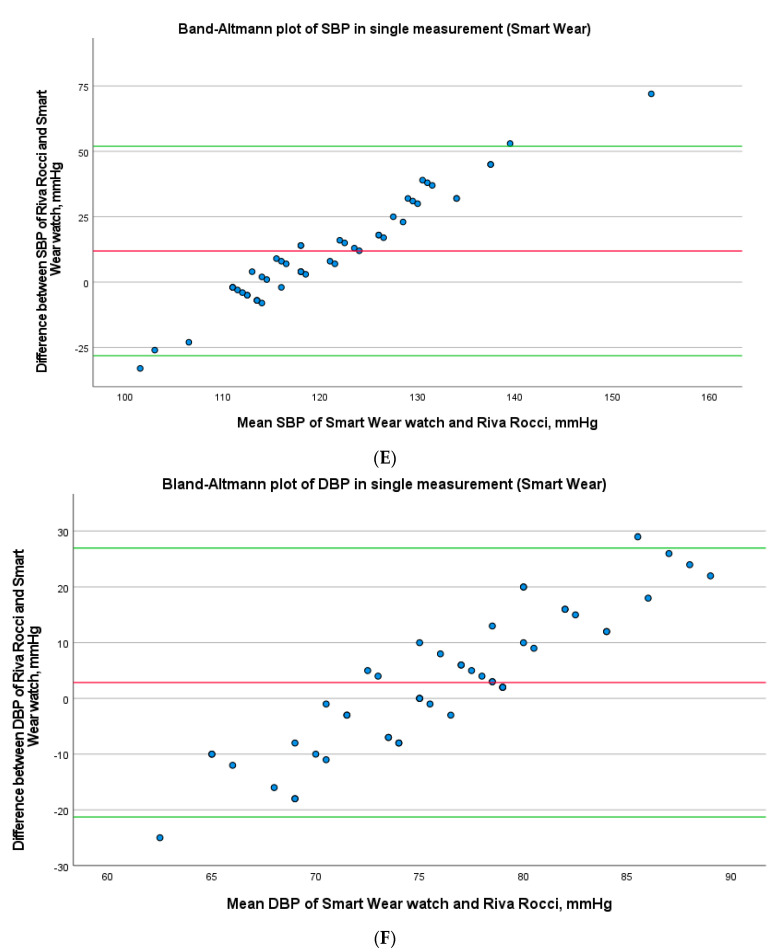
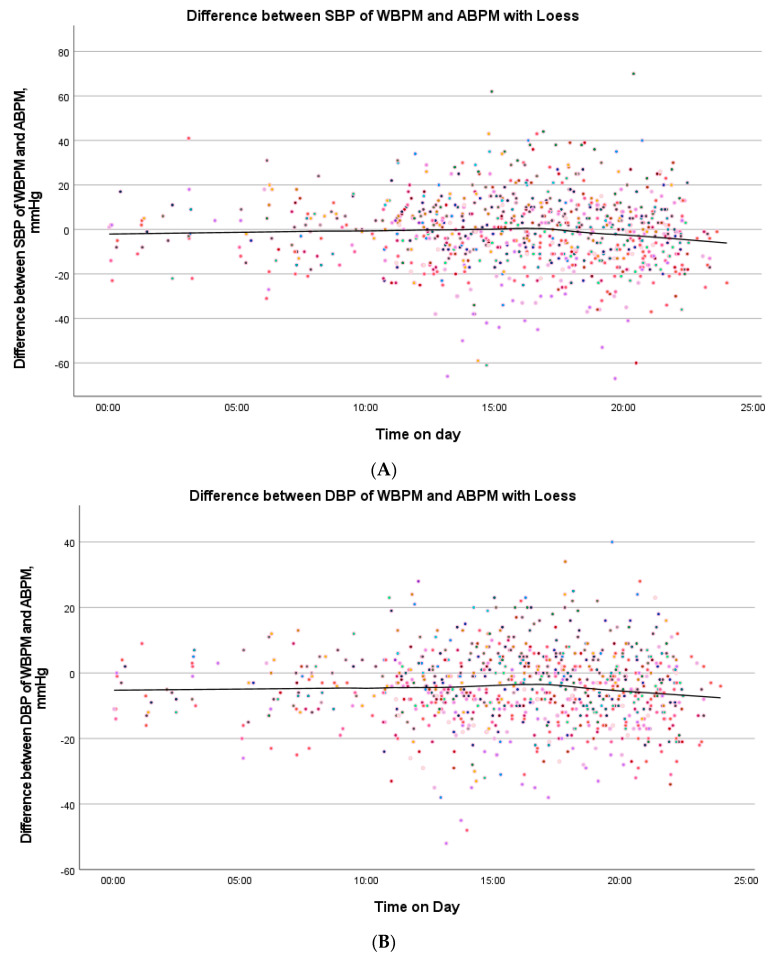
Results: The intraclass correlation coefficient (ICC) between the difference and the mean of the oscillometric Omron HeartGuide and the conventional method for the single measurement was calculated for both systole (0.765) and diastole (0.732). This is exactly how the ICC was calculated for the individual mean values calculated over the 24 h long-term measurement of the individual patients for both systole (0.880) and diastole (0.829). The ICC between the infrared device and the conventional method was "bad" for SBP (0.329) and DBP (0.025). Therefore, no further long-term measurements were performed with the infrared device.

Conclusion: The Omron HeartGuide device provided comparable BP values to the standard devices for single and long-term measurements. The infrared smart device failed to acquire valid measurement data.

Keywords: cardiovascular diagnostics; hypertension; out-patient monitoring; smartwatch; telemedicine.


Conflict of interest statement

The authors declare no conflict of interest.

Figures

Figure 1
Figure 1
Participant selection process.
Figure 2
Figure 2
Measurement procedure: The device is positioned at heart level in accordance to the instructions on the display (left); after the measurement, blood pressure values are displayed (right).
Figure 3
Figure 3
(A) Bland–Altman Plot of SBP in single measurement (Omron HeartGuide). Bland–Altman plots for the SBP differences between Riva-Rocci and readings of the WBPM in the single measurement. Thick red solid line = mean difference; green line = ±1.96 standard deviations of the mean difference. Abbreviations: WBPM, wearable blood pressure monitoring; SBP, systolic blood pressure. (B) Bland–Altman plot of DBP in single measurement (Omron HeartGuide). Bland–Altman plots for the DBP differences between Riva-Rocci and readings of the WBPM in the single measurement. Thick red solid line = mean difference; green line = ±1.96 standard deviations of the mean difference. Abbreviations: WBPM, wearable blood pressure monitoring; DBP, diastolic blood pressure. (C) Bland–Altman Plot of SBP in long-term measurement. Bland–Altman plots for the SBP differences between ABPM and readings of the WBPM in the long-term measurement. Thick red solid line = mean difference; green line = ±1.96 standard deviations of the mean difference. Abbreviations: WBPM, wearable blood pressure monitoring; ABPM, ambulatory blood pressure monitoring; SBP, systolic blood pressure. (D) Bland–Altman plot of DBP in long-term measurement. Bland–Altman plots for the DBP differences between ABPM and readings of the WBPM in the long-term measurement. Thick red solid line = mean difference; green line = ±1.96 standard deviations of the mean difference. Abbreviations: WBPM, wearable blood pressure monitoring; ABPM, ambulatory blood pressure monitoring; DBP, diastolic blood pressure. (E) Bland–Altman Plot of SBP in single measurement (Smart Wear watch). Bland–Altman plots for the SBP differences between Riva-Rocci and readings of the Smart Wear watch in the single measurement. Thick red solid line = mean difference; green line = ±1.96 standard deviations of the mean difference. Abbreviations: SBP, systolic blood pressure. (F) Bland–Altman Plot of DBP in single measurement (Smart Wear watch). Bland–Altman plots for the DBP differences between Riva-Rocci and readings of the Smart Wear watch in the single measurement. Thick red solid line = mean difference; green line = ±1.96 standard deviations of the mean difference. Abbreviations: DBP, diastolic blood pressure.
Figure 3
Figure 3
(A) Bland–Altman Plot of SBP in single measurement (Omron HeartGuide). Bland–Altman plots for the SBP differences between Riva-Rocci and readings of the WBPM in the single measurement. Thick red solid line = mean difference; green line = ±1.96 standard deviations of the mean difference. Abbreviations: WBPM, wearable blood pressure monitoring; SBP, systolic blood pressure. (B) Bland–Altman plot of DBP in single measurement (Omron HeartGuide). Bland–Altman plots for the DBP differences between Riva-Rocci and readings of the WBPM in the single measurement. Thick red solid line = mean difference; green line = ±1.96 standard deviations of the mean difference. Abbreviations: WBPM, wearable blood pressure monitoring; DBP, diastolic blood pressure. (C) Bland–Altman Plot of SBP in long-term measurement. Bland–Altman plots for the SBP differences between ABPM and readings of the WBPM in the long-term measurement. Thick red solid line = mean difference; green line = ±1.96 standard deviations of the mean difference. Abbreviations: WBPM, wearable blood pressure monitoring; ABPM, ambulatory blood pressure monitoring; SBP, systolic blood pressure. (D) Bland–Altman plot of DBP in long-term measurement. Bland–Altman plots for the DBP differences between ABPM and readings of the WBPM in the long-term measurement. Thick red solid line = mean difference; green line = ±1.96 standard deviations of the mean difference. Abbreviations: WBPM, wearable blood pressure monitoring; ABPM, ambulatory blood pressure monitoring; DBP, diastolic blood pressure. (E) Bland–Altman Plot of SBP in single measurement (Smart Wear watch). Bland–Altman plots for the SBP differences between Riva-Rocci and readings of the Smart Wear watch in the single measurement. Thick red solid line = mean difference; green line = ±1.96 standard deviations of the mean difference. Abbreviations: SBP, systolic blood pressure. (F) Bland–Altman Plot of DBP in single measurement (Smart Wear watch). Bland–Altman plots for the DBP differences between Riva-Rocci and readings of the Smart Wear watch in the single measurement. Thick red solid line = mean difference; green line = ±1.96 standard deviations of the mean difference. Abbreviations: DBP, diastolic blood pressure.
Figure 4
Figure 4
(A) Difference between the SBP of WBPM and ABPM with Loess. Loess plot with the SBP difference of WBPM and ABPM throughout the day in long-term measurement. Colored dots represent values of individual participants. Abbreviations: WBPM, wearable blood pressure monitoring; ABPM, ambulatory blood pressure monitoring; SBP, systolic blood pressure; DBP, diastolic blood pressure. (B) Difference between the DBP of WBPM and ABPM with Loess. Loess plot with the DBP difference of WBPM and ABPM throughout the day in long-term measurement. Abbreviations are similar to (A).

References

    1. Lewington S., Clarke R., Qizilbash N., Peto R., Collins R. Age-specific relevance of usual blood pressure to vascular mortality: A meta-analysis of individual data for one million adults in 61 prospective studies. Lancet. 2002;360:1903–1913. doi: 10.1016/S0140-6736(02)11911-8. - DOI - PubMed
    1. Pickering T.G., Schwartz J.E., James G.D. Ambulatory blood pressure monitoring for evaluating the relationships between lifestyle, hypertension and cardiovascular risk. Clin. Exp. Pharmacol. Physiol. 1995;22:226–231. doi: 10.1111/j.1440-1681.1995.tb01986.x. - DOI - PubMed
    1. Miceli F., Presta V., Citoni B., Canichella F., Figliuzzi I., Ferrucci A., Volpe M., Tocci G. Conventional and new electrocardiographic criteria for hypertension-mediated cardiac organ damage: A narrative review. J. Clin. Hypertens. 2019;21:1863–1871. doi: 10.1111/jch.13726. - DOI - PMC - PubMed
    1. Welser L., Pfeiffer K.A., Silveira J.F.d.C., Valim A.R.d.M., Renner J.D.P., Reuter C.P. Incidência de Hipertensão Arterial está Associada com Adiposidade em Crianças e Adolescentes. Arq. Bras. Cardiol. 2023;120:e20220070. doi: 10.36660/abc.20220070. - DOI - PMC - PubMed
    1. Thijs L., Den Hond E., Nawrot T., Staessen J.A. Prevalence, pathophysiology and treatment of isolated systolic hypertension in the elderly. Expert Rev. Cardiovasc. Ther. 2004;2:761–769. doi: 10.1586/14779072.2.5.761. - DOI - PubMed