. 2023 Dec;22(12):e14009.
doi: 10.1111/acel.14009. Epub 2023 Nov 13.

3D reconstruction of murine mitochondria reveals changes in structure during aging linked to the MICOS complex

Affiliations

3D reconstruction of murine mitochondria reveals changes in structure during aging linked to the MICOS complex

Zer Vue et al. Aging Cell. 2023 Dec.

Abstract

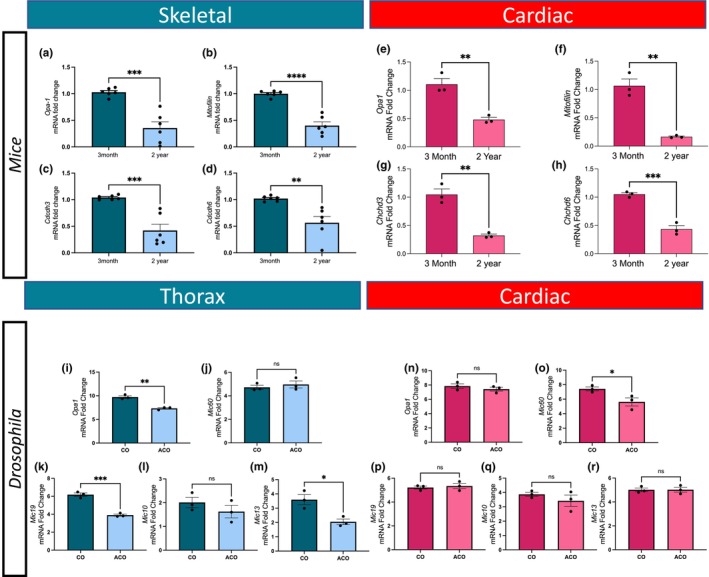
During aging, muscle gradually undergoes sarcopenia, the loss of function associated with loss of mass, strength, endurance, and oxidative capacity. However, the 3D structural alterations of mitochondria associated with aging in skeletal muscle and cardiac tissues are not well described. Although mitochondrial aging is associated with decreased mitochondrial capacity, the genes responsible for the morphological changes in mitochondria during aging are poorly characterized. We measured changes in mitochondrial morphology in aged murine gastrocnemius, soleus, and cardiac tissues using serial block-face scanning electron microscopy and 3D reconstructions. We also used reverse transcriptase-quantitative PCR, transmission electron microscopy quantification, Seahorse analysis, and metabolomics and lipidomics to measure changes in mitochondrial morphology and function after loss of mitochondria contact site and cristae organizing system (MICOS) complex genes, Chchd3, Chchd6, and Mitofilin. We identified significant changes in mitochondrial size in aged murine gastrocnemius, soleus, and cardiac tissues. We found that both age-related loss of the MICOS complex and knockouts of MICOS genes in mice altered mitochondrial morphology. Given the critical role of mitochondria in maintaining cellular metabolism, we characterized the metabolomes and lipidomes of young and aged mouse tissues, which showed profound alterations consistent with changes in membrane integrity, supporting our observations of age-related changes in muscle tissues. We found a relationship between changes in the MICOS complex and aging. Thus, it is important to understand the mechanisms that underlie the tissue-dependent 3D mitochondrial phenotypic changes that occur in aging and the evolutionary conservation of these mechanisms between Drosophila and mammals.

Keywords: Drosophila; 3D morphometry; MICOS; aging; mitochondria; mitochondrial disease; mitochondrion; reconstruction; reticulum; serial block-face SEM; skeletal muscle.


Conflict of interest statement

All authors declare that they have no conflict of interest.

Figures

FIGURE 1
FIGURE 1
Decreased mitochondrial size and volume in the gastrocnemius, soleus, and cardiac muscle of aged mice in SBF‐SEM 3D reconstructions. (a, b) Representative SBF‐SEM orthoslices for male murine gastrocnemius, (c, d) soleus, and (e, f) cardiac tissues. (a′, b′) 3D reconstructions of mitochondria (various colors) in gastrocnemius, (c′, d′) soleus, and (e′, f′) cardiac tissues from 3‐month‐old and 2‐year‐old mice overlaid on ortho slices. (a″, b″) Pseudo‐colored individual mitochondria in gastrocnemius, (c″, d″) soleus, and (e″, f″) cardiac tissues identify micro‐level changes. (g–x) Quantification of 3D reconstructions, with each dot representing the average for all mitochondria quantified for one mouse. (g) Mitochondrial volume in the gastrocnemius muscle from 3‐month‐old and 2‐year‐old mice and (h) mitochondrial volume distributed as the percent of total mitochondria to visualize relative heterogeneity. (i) Mitochondrial 3D area in gastrocnemius muscle from 3‐month‐old and 2‐year‐old mice and (j) mitochondrial area distributed as the percent of total mitochondria to visualize relative heterogeneity. (k) Mitochondrial perimeter in gastrocnemius muscle from 3‐month‐old and 2‐year‐old mice and (l) mitochondrial perimeter distributed as the percent of total mitochondria to visualize relative heterogeneity. These quantifications are also displayed in (m–r) soleus and (s–x) cardiac tissues. Cartoon representations of metrics to calculate (y) mitochondrial volume, perimeter, and perimeter. Approximately 550 mitochondria were analyzed for each tissue type and age cohort (n = 3 mice per age cohort). Significance values: **** represents p ≤ 0.0001.
FIGURE 2
FIGURE 2
SBF‐SEM 3D reconstruction in gastrocnemius, soleus, and cardiac muscle of aged mice showed altered mitochondrial networks. Representative examples of 3D reconstruction of mitochondria in (a) gastrocnemius, (b) soleus, and (c) cardiac tissue of 3‐month‐old and 2‐year‐old mice organized by volume to show the mitochondrial phenotypes. (d) Mitochondrial complexity index (MCI), analogous to sphericity, in the gastrocnemius muscle from 3‐month‐old and 2‐year‐old mice, and (e) MCI distributed as the percent of total mitochondria to visualize relative heterogeneity. (f) Sphericity in the gastrocnemius muscle from 3‐month‐old and 2‐year‐old mice and (g) mitochondrial sphericity distributed as the percent of total mitochondria to visualize relative heterogeneity. These quantifications are also displayed in (h–k) soleus and (l–o) cardiac tissues. Cartoon representations of metrics to calculate (p) MCI and (q) sphericity. Approximately 550 mitochondria were analyzed for each tissue type and age cohort (n = 3 mice per age cohort). Significance values: *p ≤ 0.05; ****p ≤ 0.0001.
FIGURE 3
FIGURE 3
Changes in mRNA transcripts of Opa1 and MICOS genes in aged mouse tissue and Drosophila. (a–d) Fold changes in the amount of Opa1 and MICOS gene transcripts in mitochondria of skeletal muscle from 3‐month‐old and 2‐year‐old mice as measured by RT‐qPCR. (a) Opa1, (b) Mitofilin, (c) Chchd3, and (d) Chchd6 transcripts in skeletal muscle. (e–h) Fold changes in transcripts of Opa1 and MICOS genes in 3‐month‐old and 2‐year‐old murine cardiac tissue. (e) Opa1, (f) Mitofilin, (g) Chchd3, (h) and Chchd6 transcripts. (i–r) Altered Drosophila mitochondrial genes with age. Fold changes in transcripts of Opa1 and MICOS genes in aging Drosophila in (i) Opa1, (j) Mic60 (Mitofilin), (k) Mic19 (Chchd3), (l) Mic10 (MICOS10), and (m) Mic13 (QIL1) transcripts in thorax. Fold changes in transcripts of Opa1 and MICOS genes in aging Drosophila in (n) Opa1, (o) Mic60 (Mitofilin), (p) Mic19 (Chchd3), (q) Mic10 (MICOS10), and (r) Mic13 (QIL1) transcripts in cardiac tissue. Significance values: *p ≤ 0.05; **p ≤ 0.01; ***p ≤ 0.001; ****p ≤ 0.0001. For all RT‐qPCR experiments, n = 6.
FIGURE 4
FIGURE 4
Knockout of Opa1, Mitofilin, Chchd3, or Chchd6 in myotubes resulted in structural changes of mitochondria and cristae in TEM and 3D reconstruction. (a–e) Representative images of mitochondria and cristae from myotubes of Opa1, Mitofilin, Chchd3, and Chchd6 knockout mice compared to WT. (f) Mitochondrial area in myotubes of Opa1, Mitofilin, Chchd3, and Chchd6 knockout mice compared to WT. (g) Circularity index, measuring the roundness and symmetry of mitochondria, in myotubes of Opa1, Mitofilin, Chchd3, and Chchd6 knockout mice compared to WT. (h) The number of mitochondria in myotubes of Opa1, Mitofilin, Chchd3, and Chchd6 knockout mice compared to WT. (i) The number of individual cristae in myotubes of Opa1, Mitofilin, Chchd3, and Chchd6 knockout mice compared to WT. (j) Cristae scores measuring the uniformity and idealness of cristae in myotubes of Opa1, Mitofilin, Chchd3, and Chchd6 knockout mice compared to WT. (k) The surface area of the average cristae in myotubes of Opa1, Mitofilin, Chchd3, and Chchd6 knockout mice compared to WT. (l–p) Representative images showing 3D reconstructions of mitochondria in myotubes of Opa1, Mitofilin, Chchd3, and Chchd6 knockout mice compared to WT. (q) Mitochondrial 3D length in myotubes of Opa1, Mitofilin, Chchd3, and Chchd6 knockout mice compared to WT. (r) Mitochondrial volume on a log scale in myotubes of Opa1, Mitofilin, Chchd3, and Chchd6 knockout mice compared to WT. (s–v) Altered Drosophila mitochondrial structure resulting from loss of the MICOS complex and mitochondrial proteins. (s) Actin‐mitochondria staining for Drosophila flight tissue in knockouts of MICOS complex and mitochondrial proteins. TEM quantification of mitochondrial changes in Drosophila flight tissue for (t) mitochondrial area, (u) circularity, and (v) quantity per sarcomere upon knockout of MICOS complex and mitochondrial proteins. Significance values: *p ≤ 0.05; **p ≤ 0.01; ***p ≤ 0.001; ****p ≤ 0.0001. Dots represent the number of mitochondria quantified.
FIGURE 5
FIGURE 5
Knockout of the MICOS complex in myotubes resulted in changes in oxygen consumption rates and metabolomics. (a) OCR in myotubes of Opa1 and Mitofilin knockout mice compared to WT. (b) Basal OCR, the net respiration rate once non‐mitochondrial respiration has been removed, in myotubes of Opa1 and Mitofilin knockout mice compared to WT. (c) ATP‐dependent respiration, shown from intervals 4–7 in the OCR graphs, was determined by the addition of oligomycin (an inhibitor of respiration) in myotubes of Opa1 and Mitofilin knockout mice compared to WT. (d) Maximum OCR represented by the peak from intervals 7–11 once non‐mitochondrial respiration was deducted, in myotubes of Opa1 and Mitofilin knockout mice compared to WT. (e) The reserve capacity, the difference between basal OCR and maximum OCR, in myotubes of Opa1 and Mitofilin knockout mice compared to WT. (f) Proton leak, representing non‐phosphorylating electron transfer, in myotubes of Opa1 and Mitofilin knockout mice compared to WT. (g–j) Metabolomic analysis in Mitofilin knockout mice. (g) Metabolite PCA and (h) T‐test comparing myotubes for control versus Mitofilin knockout mice. (i) Heatmap showing the relative abundance of ions and (j) enrichment analysis of metabolites, which links similarly functioning metabolites with the relative abundance for the Mitofilin knockout. (k) OCR in myotubes of Chchd3, Chchd6, and Opa1 knockout mice compared to WT. (l) Basal OCR in myotubes of Chchd3, Chchd6, and Opa1 knockout mice compared to WT. (m) ATP‐linked respiration in myotubes of Chchd3, Cchchd6, and Opa1 knockout mice compared to WT. (n) Maximum OCR in myotubes of Chchd3, Chchd6, and Opa1 knockout mice compared to WT. (o) The reserve capacity in myotubes of Chchd3, Chchd6, and Opa1 knockout mice compared to WT. (p) Proton leak in myotubes of Opa1, Chchd3, and Chchd6, knockout mice compared to WT. (q–t) Metabolomic analysis in Chchd3 or Chchd6 knockout mice. (q) Metabolite PCA and (r) ANOVA test comparing control to myotubes of Chchd3 and Chchd6 knockout mice (s) Heatmap showing the relative abundance of ions for control and (t) enrichment analysis metabolites for Chchd3 and Chchd6 knockout mice. Significance values: *p ≤ 0.05; **p ≤ 0.01; ***p ≤ 0.001; ****p ≤ 0.0001. For Seahorse analysis, n = 6 plates for experimental knockouts and n = 16 for controls.
FIGURE 6
FIGURE 6
Metabolomics analysis and lipidomic profiling revealed metabolic dysregulation and disruptions in lipid classes with age in gastrocnemius, soleus, and cardiac muscles. (a) Metabolic heatmap showing the relative abundance of metabolites and (b) the lipidome in young and aged gastrocnemius, (c, d) soleus, and (e, f) cardiac samples. For each tissue and metabolite in the heatmaps, the aged samples were normalized to the median of the young samples and then log2 transformed. Significantly different lipid classes represented in the figures are those with adjusted p‐values < 0.05 (note: p‐values were adjusted to correct for multiple comparisons using an FDR procedure) and log fold changes greater than 1 or less than −1. Young, n = 4; aged, n = 4. For all panels, error bars indicate SEM, ** indicates p < 0.01; and *p < 0.05, calculated with Student's t‐test.

References

    1. Abrigo, J. , Gonzalez, F. , Aguirre, F. , Tacchi, F. , Gonzalez, A. , Meza, M. P. , Simon, F. , Cabrera, D. , Arrese, M. , Karpen, S. , & Cabello‐Verrugio, C. (2021). Cholic acid and deoxycholic acid induce skeletal muscle atrophy through a mechanism dependent on TGR5 receptor. Journal of Cellular Physiology, 236, 260–272. - PubMed
    1. Adusumilli, R. , & Mallick, P. (2017). Data conversion with ProteoWizard msConvert. In Comai L., Katz J. E., & Mallick P. (Eds.), Proteomics: Methods and protocols (pp. 339–368). Springer. - PubMed
    1. An, J. , Shi, J. , He, Q. , Lui, K. , Liu, Y. , Huang, Y. , & Sheikh, M. S. (2012). CHCM1/CHCHD6, novel mitochondrial protein linked to regulation of mitofilin and mitochondrial cristae morphology. Journal of Biological Chemistry, 287, 7411–7426. - PMC - PubMed
    1. Anand, R. , Wai, T. , Baker, M. J. , Kladt, N. , Schauss, A. C. , Rugarli, E. , & Langer, T. (2014). The i‐AAA protease YME1L and OMA1 cleave OPA1 to balance mitochondrial fusion and fission. The Journal of Cell Biology, 204, 919–929. - PMC - PubMed
    1. Bannwarth, S. , Ait‐El‐Mkadem, S. , Chaussenot, A. , Genin, E. C. , Lacas‐Gervais, S. , Fragaki, K. , Berg‐Alonso, L. , Kageyama, Y. , Serre, V. , Moore, D. G. , Verschueren, A. , Rouzier, C. , Le Ber, I. , Augé, G. , Cochaud, C. , Lespinasse, F. , N'Guyen, K. , de Septenville, A. , Brice, A. , … Paquis‐Flucklinger, V. (2014). A mitochondrial origin for frontotemporal dementia and amyotrophic lateral sclerosis through CHCHD10 involvement. Brain, 137, 2329–2345. - PMC - PubMed

Publication types

LinkOut - more resources