[Preprint]. 2023 Oct 25:2023.10.23.563611.
doi: 10.1101/2023.10.23.563611.

Multilayer network associations between the exposome and childhood brain development

Affiliations

Multilayer network associations between the exposome and childhood brain development

Ivan L Simpson-Kent et al. bioRxiv. .

Abstract

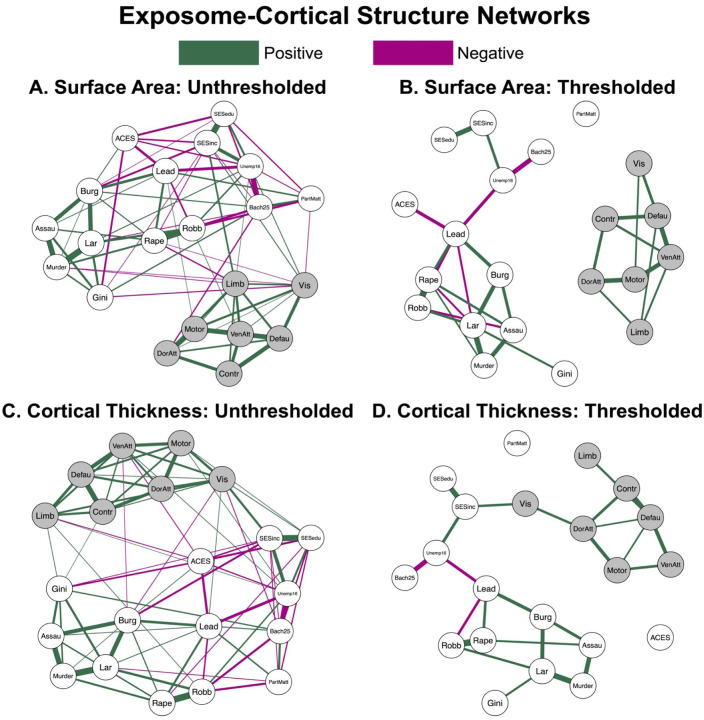
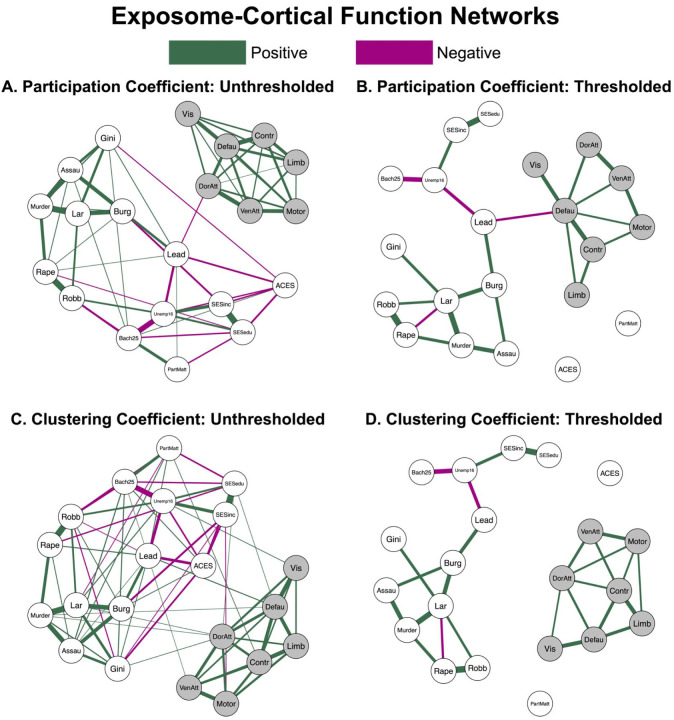
Growing up in a high poverty neighborhood is associated with elevated risk for academic challenges and health problems. Here, we take a data-driven approach to exploring how measures of children's environments relate to the development of their brain structure and function in a community sample of children between the ages of 4 and 10 years. We constructed exposomes including measures of family socioeconomic status, children's exposure to adversity, and geocoded measures of neighborhood socioeconomic status, crime, and environmental toxins. We connected the exposome to two structural measures (cortical thickness and surface area, n = 170) and two functional measures (participation coefficient and clustering coefficient, n = 130). We found dense connections within exposome and brain layers and sparse connections between exposome and brain layers. Lower family income was associated with thinner visual cortex, consistent with the theory that accelerated development is detectable in early-developing regions. Greater neighborhood incidence of high blood lead levels was associated with greater segregation of the default mode network, consistent with evidence that toxins are deposited into the brain along the midline. Our study demonstrates the utility of multilayer network analysis to bridge environmental and neural explanatory levels to better understand the complexity of child development.


Figures

Figure 1.
Figure 1.. Exposome-Cortical Structure Networks.
Multilayer networks were estimated using the Extended Bayesian Information Criterion graphical least absolute shrinkage and selection operator (EBICglasso). We set the tuning parameter to 0.5 and used pairwise deletion to account for data missingness. Partial correlation coefficients (edge weights) were calculated using Pearson method. Green solid lines show positive associations. Magenta lines show negative associations. Thickness of the edge weights indicate the magnitude of the partial correlation (thicker edges show larger partial correlations between nodes). Cortical systems are defined from a seven system parcellation (Yeo et al., 2011): visual (Vis), somatomotor (Motor), dorsal attention (DorAtt), ventral attention (VenAtt), executive control (Contr), default mode (Defau), limbic (Limb). Three exposome variables are reported by parents: income (SESinc), parent education (SESedu), child adverse childhood experiences (ACEs). The other exposome measures are geocoded from census block (see Supplementary Table 1): neighborhood incidence of murder (Murder), aggravated assault (Assau), larceny (Lar), rape (Rape), robbery (Robb), burglary (Burg), unemployment over the age of 16 (Unemp16), percent of people over the age of 25 with a Bachelor’s degree or higher (Bach25), Gini index of income inequality (Gini), particulate matter 2.5 (PartMatt), blood lead levels (Lead). A. Surface Area: Unthresholded. B. Surface Area: Thresholded. Edges that are not larger than the threshold of both the EBICglasso computation of all considered models and the final returned model are set to zero. C. Cortical Thickness: Unthresholded. D. Cortical Thickness: Thresholded. Edges that are not larger than the threshold of both the EBICglasso computation of all considered models and the final returned model are set to zero.
Figure 2.
Figure 2.. Normalized centrality metrics for the unthresholded exposome-cortical structure networks.
A. Surface Area: Bridge Strength. B. Surface Area: Bridge Expected Influence. C. Cortical Thickness: Bridge Strength. D. Cortical Thickness: Bridge Expected Influence.
Figure 3.
Figure 3.. Exposome-Cortical Function Networks.
Multilayer networks were estimated using the Extended Bayesian Information Criterion graphical least absolute shrinkage and selection operator (EBICglasso). We set the tuning parameter to 0.5 and used pairwise deletion to account for data missingness. Partial correlation coefficients (edge weights) were calculated using Pearson method. Green solid lines show positive associations. Magenta lines show negative associations. Thickness of the edge weights indicate the magnitude of the partial correlation (thicker edges show larger partial correlations between nodes). Cortical systems are defined from a seven system parcellation (Yeo et al., 2011): visual (Vis), somatomotor (Motor), dorsal attention (DorAtt), ventral attention (VenAtt), executive control (Contr), default mode (Defau), limbic (Limb). Three exposome variables are reported by parents: income (SESinc), parent education (SESedu), child adverse childhood experiences (ACEs). The other exposome measures are geocoded from census block (see Supplementary Table 1): neighborhood incidence of murder (Murder), aggravated assault (Assau), larceny (Lar), rape (Rape), robbery (Robb), burglary (Burg), unemployment over the age of 16 (Unemp16), percent of people over the age of 25 with a Bachelor’s degree or higher (Bach25), Gini index of income inequality (Gini), particulate matter 2.5 (PartMatt), blood lead levels (Lead). A. Participation Coefficient: Unthresholded. B. Participation Coefficient: Thresholded. Edges that are not larger than the threshold of both the EBICglasso computation of all considered models and the final returned model are set to zero. C. Clustering Coefficient: Unthresholded. D. Clustering Coefficient: Thresholded. Edges that are not larger than the threshold of both the EBICglasso computation of all considered models and the final returned model are set to zero.
Figure 4.
Figure 4.. Normalized centrality metrics for the unthresholded exposome-clustering coefficient network.
A. Bridge Strength. B. Bridge Expected Influence.

Similar articles

References

    1. Achard S., Salvador R., Whitcher B., Suckling J., Bullmore E., 2006. A Resilient, Low-Frequency, Small-World Human Brain Functional Network with Highly Connected Association Cortical Hubs. J. Neurosci. 26, 63–72. 10.1523/JNEUROSCI.3874-05.2006 - DOI - PMC - PubMed
    1. Alexander-Bloch A., Clasen L., Stockman M., Ronan L., Lalonde F., Giedd J., Raznahan A., 2016. Subtle in-scanner motion biases automated measurement of brain anatomy from in vivo MRI: Motion Bias in Analyses of Structural MRI. Hum. Brain Mapp. 37, 2385–2397. 10.1002/hbm.23180 - DOI - PMC - PubMed
    1. Avants B.B., Yushkevich P., Pluta J., Minkoff D., Korczykowski M., Detre J., Gee J.C., 2010. The optimal template effect in hippocampus studies of diseased populations. NeuroImage 49, 2457–2466. 10.1016/j.neuroimage.2009.09.062 - DOI - PMC - PubMed
    1. Bahrami M., Simpson S.L., Burdette J.H., Lyday R.G., Quandt S.A., Chen H., Arcury T.A., Laurienti P.J., 2022. Altered default mode network associated with pesticide exposure in Latinx children from rural farmworker families. NeuroImage 256, 119179. 10.1016/j.neuroimage.2022.119179 - DOI - PMC - PubMed
    1. Bartolomei F., Bosma I., Klein M., Baayen J.C., Reijneveld J.C., Postma T.J., Heimans J.J., Van Dijk B.W., De Munck J.C., De Jongh A., Cover K.S., Stam C.J., 2006. Disturbed functional connectivity in brain tumour patients: Evaluation by graph analysis of synchronization matrices. Clin. Neurophysiol. 117, 2039–2049. 10.1016/j.clinph.2006.05.018 - DOI - PubMed

Publication types