[Preprint]. 2023 Oct 23:2023.10.20.563389.
doi: 10.1101/2023.10.20.563389.

Integrated Proteomics Identifies Troponin I Isoform Switch as a Regulator of a Sarcomere-Metabolism Axis During Cardiac Regeneration

Affiliations

Integrated Proteomics Identifies Troponin I Isoform Switch as a Regulator of a Sarcomere-Metabolism Axis During Cardiac Regeneration

Timothy J Aballo et al. bioRxiv. .

Update in

Abstract

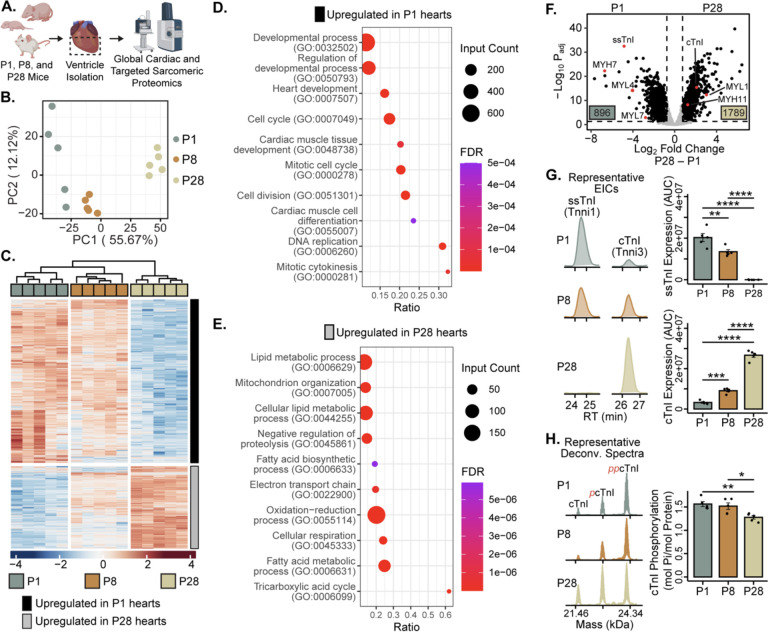
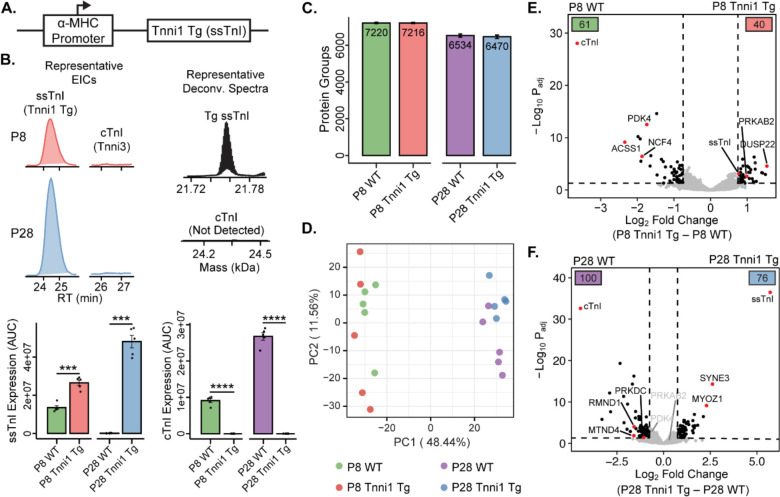
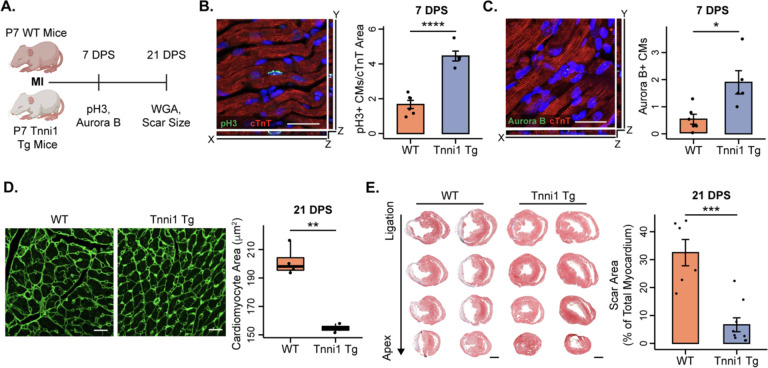
Adult mammalian cardiomyocytes have limited proliferative potential, and after myocardial infarction (MI), injured cardiac tissue is replaced with fibrotic scar rather than with functioning myocardium. In contrast, the neonatal mouse heart possesses a regenerative capacity governed by cardiomyocyte proliferation; however, a metabolic switch from glycolysis to fatty acid oxidation during postnatal development results in loss of this regenerative capacity. Interestingly, a sarcomere isoform switch also takes place during postnatal development where slow skeletal troponin I (ssTnI) is replaced with cardiac troponin I (cTnI). In this study, we first employ integrated quantitative bottom-up and top-down proteomics to comprehensively define the proteomic and sarcomeric landscape during postnatal heart maturation. Utilizing a cardiomyocyte-specific ssTnI transgenic mouse model, we found that ssTnI overexpression increased cardiomyocyte proliferation and the cardiac regenerative capacity of the postnatal heart following MI compared to control mice by histological analysis. Our global proteomic analysis of ssTnI transgenic mice following MI reveals that ssTnI overexpression induces a significant shift in the cardiac proteomic landscape. This shift is characterized by an upregulation of key proteins involved in glycolytic metabolism. Collectively, our data suggest that the postnatal TnI isoform switch may play a role in the metabolic shift from glycolysis to fatty acid oxidation during postnatal maturation. This underscores the significance of a sarcomere-metabolism axis during cardiomyocyte proliferation and heart regeneration.


Conflict of interest statement

DISCLOSURES Y.G. is a co-inventor on a patent that covers the detergent Azo. Other authors declare no competing interests.

Figures

Figure 1.
Figure 1.. Proteomic analysis of postnatal mouse heart development reveals alterations in developmental processes, metabolic Proteins, and sarcomere composition.
A. Workflow of experimental design. Mice were sacrificed at postnatal days (P) 1, 8, and 28 (n = 5 per group), the ventricles were isolated, and samples were prepared for global bottom-up cardiac proteomics and targeted top-down sarcomeric proteomics. B. Principal component analysis (PCA) of per-sample Log2 protein abundances demonstrates reproducibility among samples and separation among groups. C. Hierarchal heatmap (k-means columns set to 3, k-means rows set to 2) displaying z-score normalized protein intensities of all significantly differentially expressed proteins throughout postnatal development (adjusted p-value ≤ 0.05 and |Log2 Fold Change| ≥ 0.75 significance thresholds). The rows are separated into two clusters: proteins with high expression at P1 (black) and proteins with high expression at P28 (grey). D and E. Selected STRING biological process gene ontology (GO) plots of the proteins that are upregulated in P1 hearts (D) or upregulated in P28 hearts (E). Ratio represents the fractions of all proteins in the GO category that were identified. Dot size corresponds to the number of identified proteins within a GO category. Color represents FDR-adjusted p-value of the overrepresentation test. F. Volcano plot demonstrating fold-change in protein expression between P1 and P28 hearts. The number of significantly upregulated proteins per group is shown in the bottom corners of each comparison (n = 5 per group). Sarcomeric proteins that change throughout postnatal development are highlighted in the plot (adjusted p-value ≤ 0.05 and |Log2 Fold Change| ≥ 0.75 significance thresholds). G. Top-down proteomic analysis of ssTnI (Tnni1) and cTnI (Tnni3) expression throughout postnatal development. Left: Representative extracted ion chromatograms of ssTnI and cTnI. Right: Expression level analysis of ssTnI and cTnI. H. Top-down proteomic analysis of cTnI phosphorylation throughout postnatal development. Left: Representative deconvoluted spectra of cTnI. Right: Quantification of relative expression of phosphorylated cTnI to total cTnI expression. Bars represent average, error bars represent standard error of the mean (S.E.M.), dots represent individual data points. * denotes p ≤ 0.05, ** denotes p ≤ 0.01, *** denotes p ≤ 0.001, and **** denotes p ≤ 0.0001 as determined by one-way ANOVA followed by Tukey’s HSD.
Figure 2.
Figure 2.. ssTnI overexpression does not strongly alter the global cardiac proteome in juvenile or adult mouse hearts.
A. Schematic of the Tnni1 transgene. Tnni1 (ssTnI) expression is driven by the alpha-myosin heavy chain (a-MHC) promoter, extending expression of ssTnI into adulthood. B. Top-down proteomic analysis of ssTnI (Tnni1) and cTnI (Tnni3) expression throughout postnatal development in WT and Tnni1 Tg mice. Top: Representative EICs and deonconvoluted spectra of ssTnI (Tnni1) and cTnI (Tnni3) in the Tnni1 Tg mice. Bottom: Expression level analysis of ssTnI and cTnI in P8 and P28 WT and Tnni1 Tg mouse hearts (n = 5 per group, bars represent average, error bars represent S.E.M., dots represent individual data points. *** denotes p ≤ 0.001, and **** denotes p ≤ 0.0001 as determined by one-way ANOVA followed by Tukey’s HSD). C. Bar plot representing the average number of protein groups identified by global bottom-up proteomics of P8 and P28 WT and Tnni1 Tg mouse hearts demonstrating similar number of protein group identifications between the groups (n = 5 per group, error bars represent S.E.M.) D. Principal component analysis (PCA) of per-sample Log2 protein abundances displays high similarity between WT and Tnni1 Tg mice baseline proteomes at P8 and P28. E and F. Volcano plot demonstrating fold-change in protein expression between WT and Tnni1 Tg hearts at P8 (E) and P28 (F). The number of significantly upregulated proteins per group is shown in the bottom corners of each comparison (n = 5 per group, adjusted p-value ≤ 0.05 and |Log2 Fold Change| ≥ 0.75 significance thresholds).
Figure 3.
Figure 3.. ssTnI overexpression promotes cardiomyocyte proliferation and cardiac regeneration in juvenile mice after myocardial infarction.
A. Workflow of experimental design. Myocardial infarction surgeries were performed on P7 WT (non-regenerative) and P7 Tnni1 Tg mice. 7 days post-surgery (DPS), hearts were harvested to assess cardiomyocyte proliferation. 21 DPS, hearts were harvested to assess cardiomyocyte size and scar formation. B. Left: High magnification Z-stack image of a mitotic cardiomyocyte after immunostaining phosphohistone H3 staining (pH3) and cardiac troponin T (cTnT) at 7 DP P7 MI. Scale bar, 25 μm. Right: Quantification of the number of mitotic cardiomyocytes normalized by cTnT area. P7 MI Tnni1 Tg hearts display a significant increase in cardiomyocyte proliferation 7 DPS (n = 6 WT hearts, n = 5 Tnni1 Tg hearts, 4 sections quantified per heart, bars represent average, error bars represent S.E.M., dots represent average per heart). C. Left: High magnification Z-stack image of a cardiomyocyte going through cytokinesis after immunostaining for Aurora B kinase and cTnT 7 DP P7 MI. Scale bar, 25 μm. Right: Quantification of the number of cardiomyocytes going through cytokinesis. P7 MI Tnni1 Tg hearts display a significant increase in cardiomyocyte cytokinesis 7 DPS (n = 6 WT hearts, n = 5 Tnni1 Tg hearts, 4 sections quantified per heart, bars represent average, error bars represent S.E.M., dots represent average per heart). D. Left: Wheat germ agglutinin (WGA) staining at 21 DP P7 MI to assess cardiomyocyte size. Scale bar, 20 μm. Right: Quantification of cardiomyocyte area by WGA staining. P7 MI Tnni1 Tg cardiomyocytes are significantly smaller than WT cardiomyocytes 21 DPS (n = 4 hearts per group, n = 3 sections per heart, n = 150 cardiomyocytes per section. Boxplots display median, upper, and lower quartile; dots represent average cardiomyocyte area per heart). E. Left: Masson’s trichrome staining of WT and Tnni1 Tg mice hearts 21 DP P7 MI. Right: Quantification of scar area as a percent of total viable myocardium. P7 MI Tnni1 Tg hearts display a significant decrease in scar formation compared to WT hearts 21 DPS (n = 6 WT hearts, n = 9 Tnni1 Tg hearts, 3 sections quantified per heart, bars represent average, error bars represent S.E.M., dots represent average per heart). * denotes p ≤ 0.05, ** denotes p ≤ 0.01, *** denotes p ≤ 0.001, and **** denotes p ≤ 0.0001 as determined by a 2-tailed unpaired Student’s t-test.
Figure 4.
Figure 4.. ssTnI overexpression induces levels of AMPK, glycolytic enzymes, and proteasomal subunits after myocardial infarction compared to non-regenerative WT mice.
A. Workflow of experimental design. Myocardial infarction surgeries were performed on P1 WT (regenerative), P7 WT (non-regenerative) and P7 Tnni1 Tg mice (regenerative) (n = 5 per group). 7 days post-surgery (DPS), hearts were harvested for global bottom-up cardiac proteomics and targeted top-down sarcomeric proteomics. B. Principal component analysis (PCA) of per-sample Log2 protein abundances displays three distinct responses to injury. Regenerative responses to injury cluster closely along PC1, while P7 injuries cluster closely along PC2. C. Hierarchal heatmap (k-means columns set to 3, k-means rows set to 3) displaying z-score normalized protein intensities of all significantly differentially expressed proteins throughout postnatal development (adjusted p-value ≤ 0.05 and |Log2 Fold Change| ≥ 0.75 significance thresholds). The rows are separated into three clusters: proteins with elevated expression in during a non-regenerative response to injury (light grey), proteins with elevated expression during a WT regenerative response to injury (black), and proteins elevated expression during a Tnni1 Tg regenerative response to injury (dark grey). D and E. Selected STRING biological process gene ontology (GO) plots of the proteins that are elevated during WT regenerative healing (D) and Tnni1 Tg regenerative healing (E). GO analysis for WT non-regenerative healing is included in Figure S8. Ratio represents the fractions of all proteins in the GO category that were identified. Dot size corresponds to the number of identified proteins within a GO category. Color represents FDR-adjusted p-value of the overrepresentation test. F. Boxplots of selected proteins related to AMPK, glycolysis, and the proteasome upregulated during Tnni1 Tg regenerative response to injury. (n = 5 per group, boxplots display median, upper, and lower quartile; dots represent individual hearts; bars between groups represent an adjusted p-value ≤ 0.05). G and H. Top-down proteomic analysis of ssTnI expression (G) and cTnI expression (H) 7 DP P1 or P7 sham or MI surgeries. Left: Representative EICs of ssTnI and cTnI 7 DP P1 or P7 sham or MI surgeries. Right: Expression level analysis of ssTnI and cTnI 7 DP P1 or P7 MI. No change detected in ssTnI expression during regenerative (P1) or non-regenerative response (P7) to MI. Decreased expression of cTnI detected during non-regenerative (P7) response to MI, indicating cTnI expression may be regulated post-injury (n = 5 per group, bars represent average, error bars represent S.E.M., dots represent individual data points. ** denotes p ≤ 0.01 as determined by a 2-tailed unpaired Student’s t-test).

References

    1. Tsao C. W. et al. Heart Disease and Stroke Statistics—2023 Update: A Report From the American Heart Association. Circulation 147, e93–e621, doi:doi: 10.1161/CIR.0000000000001123 (2023). - DOI - PMC - PubMed
    1. Murphy S. P., Ibrahim N. E. & Januzzi J. L. Jr. Heart Failure With Reduced Ejection Fraction: A Review. JAMA 324, 488–504, doi: 10.1001/jama.2020.10262 (2020). - DOI - PubMed
    1. Porrello E. R. et al. Transient Regenerative Potential of the Neonatal Mouse Heart. Science 331, 1078–1080, doi: 10.1126/science.1200708 (2011). - DOI - PMC - PubMed
    1. Mahmoud A. I., Porrello E. R., Kimura W., Olson E. N. & Sadek H. A. Surgical models for cardiac regeneration in neonatal mice. Nature Protocols 9, 305–311, doi: 10.1038/nprot.2014.021 (2014). - DOI - PMC - PubMed
    1. Siedner S. et al. Developmental changes in contractility and sarcomeric proteins from the early embryonic to the adult stage in the mouse heart. The Journal of Physiology 548, 493–505, doi: 10.1111/j.1469-7793.2003.00493.x (2003). - DOI - PMC - PubMed

Publication types