[Preprint]. 2023 Oct 25:2023.10.23.563660.
doi: 10.1101/2023.10.23.563660.

A Germline Point Mutation in the MYC-FBW7 Phosphodegron Initiates Hematopoietic Malignancies

Affiliations

A Germline Point Mutation in the MYC-FBW7 Phosphodegron Initiates Hematopoietic Malignancies

Brian Freie et al. bioRxiv. .

Update in

Abstract

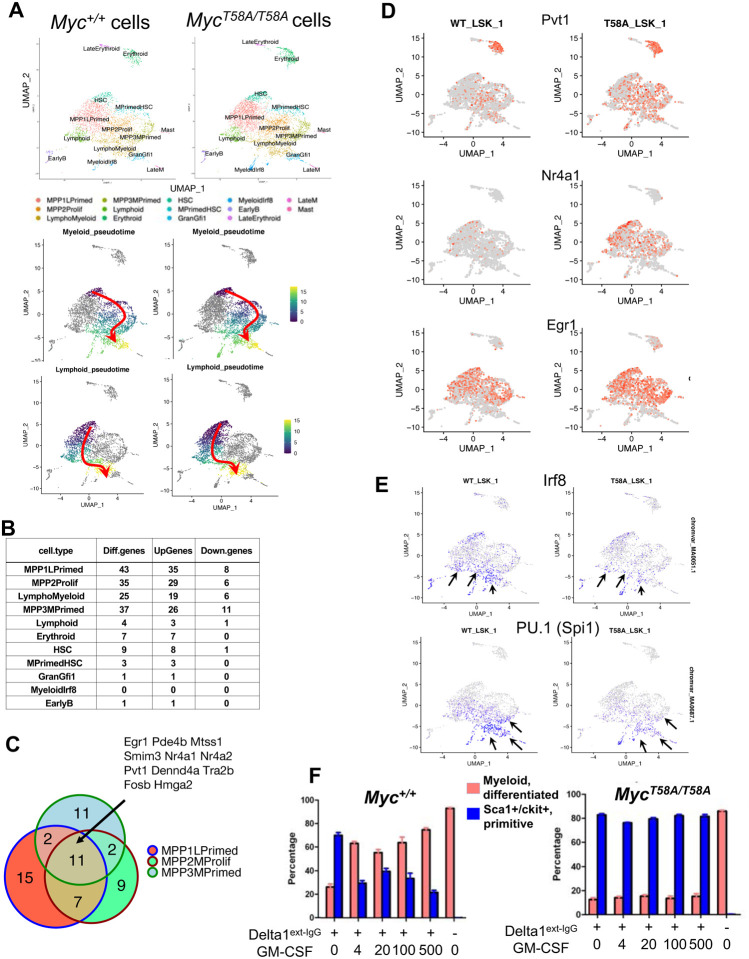
Oncogenic activation of MYC in cancers predominantly involves increased transcription rather than coding region mutations. However, MYC-dependent lymphomas frequently contain point mutations in the MYC phospho-degron, including at threonine-58 (T58), where phosphorylation permits binding by the FBW7 ubiquitin ligase triggering MYC degradation. To understand how T58 phosphorylation functions in normal cell physiology, we introduced an alanine mutation at T58 (T58A) into the endogenous c-Myc locus in the mouse germline. While MYC-T58A mice develop normally, lymphomas and myeloid leukemias emerge in ~60% of adult homozygous T58A mice. We find that primitive hematopoietic progenitor cells from MYC-T58A mice exhibit aberrant self-renewal normally associated with hematopoietic stem cells (HSCs) and upregulate a subset of Myc target genes important in maintaining stem/progenitor cell balance. Genomic occupancy by MYC-T58A was increased at all promoters, compared to WT MYC, while genes differentially expressed in a T58A-dependent manner were significantly more proximal to MYC-bound enhancers. MYC-T58A lymphocyte progenitors exhibited metabolic alterations and decreased activation of inflammatory and apoptotic pathways. Our data demonstrate that a single point mutation in Myc is sufficient to produce a profound gain of function in multipotential hematopoietic progenitors associated with self-renewal and initiation of lymphomas and leukemias.


Conflict of interest statement

COMPETING INTEREST STATEMENT Robert N Eisenman: Scientific Advisory Board Member: Kronos Bio Inc.; Shenogen Pharma Beijing. No overlap with the present study. The other authors declare that no competing interests exist.

Figures

Figure 1.
Figure 1.. MycT58A/T58A mutant mice exhibit increased MYC stability, and are sensitized to late onset hematopoietic malignancies.
(A) Protein isolated from whole cell extracts of spleens or thymus from MycT58A/T58A and littermate control mice were analyzed by western blotting. Littermate pairs were loaded into adjacent lanes (indicated by brackets), blotted, and blots were detected using antibody to Myc with Histone H3 is used as a loading control (top panel). Single cell suspensions from MycT58A/T58A and littermate control (Myc+/+) mouse thymus were suspended in culture media in the presence of cycloheximide for the time indicated, and western blots for Myc and b-tubulin (loading control) are shown (bottom panel). The calculated half-life (T1/2) is indicated. (B) MycT58A/T58A and littermate control Myc+/+ mice were allowed to age until the development of disease. Mice were autopsied, and malignancies were confirmed using flow cytometry and pathological analysis. The data shown are a Kaplan-Meier plot of tumor free survival. The asterisk denotes significant p values (p<0.001). A summary of observed malignancies is shown in the table. (C, D) Mice exhibiting a detectable tumor mass or that were moribund were sacrificed, and tissues and blood smears were prepared from normal and malignant mice and stained (Romanowsky). Tissues from malignant animals (liver, lung, and spleen) were stained (Hematoxylin/eosin) for microscopic analysis. Single cell suspensions from malignant MycT58A/T58A mice were prepared from blood, bone marrow, and spleen and analyzed by flow cytometry using antibodies specific for the indicated cell surface marker. Cell populations are gated on live cells (DAPI negative).
Figure 2.
Figure 2.. Aberrant self-renewal of hematopoietic progenitors from MycT58A/T58A mice.
(A) Bone marrow hematopoietic progenitors were cultured from either MycT58A/T58A mice or Myc+/+ mice in clonogenic methylcellulose assays in the presence of cytokines to support the growth of myeloid progenitor colonies. After 10 days in culture, individual colonies were picked and replated as secondary cultures supplemented with cytokines. Secondary colony formation was scored at day 10 as replatable CFU, and the ratios of replatable colonies compared to total colonies plated are shown (y axis). The data shown are representative of two independent experiments. (B, C) Hematopoietic stem and progenitor cells from the bone marrow of 3 pooled MycT58A/T58A mice and Myc+/+ control littermates were sorted by flow cytometry. Hematopoietic stem cells (HSC), and one population of multi-potential progenitors ( called MPP1) were sorted based on expression of the indicated cell surface markers. The sorted stem or progenitor cells (CD45.2) were then mixed at decreasing cell doses with competitor cells (CD45.1) and transplanted into lethally irradiated recipient mice. Antibodies specific to the two CD45 isoforms were used to determine the levels of reconstitution from the indicated sorted cell populations. The data are shown as percent CD45.2 donor.
Figure 3.
Figure 3.. Single cell multiome analysis comparing Myc+/+ and MycT58A/T58A hematopoietic stem and progenitor cells.
(A) Hematopoietic stem and progenitors (LSK sorted cells) from freshly isolated bone marrow of either Myc+/+ or MycT58A/T58A mutant Myc mice were sorted and barcoded to identify single cells using the 10X Genomics platform for single cell multiome (RNA-Seq and ATAC-Seq) analyses. Two mice per genotype were used in two independent experiments to generate 4 datasets (4 mice per genotype, for a total of 8 mice). After alignment and analysis using R packages Seurat and Signac (based RNA content and removal of duplicate barcodes), 7929 cells were included in the analysis. The datasets were then integrated (to account for batch effects), and clustered based on single cell RNA-Seq of Myc+/+ and MycT58A/T58A. Following dimension reduction, progenitor cell populations were identified and labeled as detailed in METHODS. Primitive hematopoietic progenitor cells were ordered in pseudo time using the R package Monocle3. HSC’s were set at 0, and cells were ordered along either lymphoid or myeloid pseudotimes. (B) The number of differentially expressed (Diff.genes), Up-regulated (Up.Genes), and Down-regulated (Down.Genes) comparing T58A mutant to WT cells, determined for each population of progenitor cells. Differentially expressed genes were determined by Wilcoxon rank sum analysis (p < 0.05). (C) Venn diagram depicting differentially expressed genes in 3 different hematopoietic progenitor cell populations (MPP1_LPrimed, MPP2_Prolif, and MPP3_MPrimed). A set of 11 Myc target genes are shown that were up-regulated in MycT58A/T58A mutant cells in all analyzed progenitor cell populations. (D) Heatmap of single cells showing the expression of selected genes found to be up-regulated in MycT58A/T58A mutant progenitor populations. (E) Consensus binding motif activity in single cell ATAC-Seq in progenitors in Myc+/+ and MycT58A/T58A mutant mice. (F) Hematopoietic progenitor cells were purified from bone marrow of Myc+/+ or MycT58A/T58A mice (LSK sorting). Sorted cells were then cultured in wells coated with Delta1 ligand to activate the Notch pathway in the presence of cytokine cocktail (see METHODS). After two weeks of culture, increasing amounts of GMCSF was added to the cultures to promote myeloid differentiation. Differentiation was assessed by flow cytometry staining for Sca1/ckit (Sca1/ckit+, primitive) which is retained on primitive cells, and Mac1/Gr1/F480 (Myeloid, differentiated) to identify differentiated cells.
Figure 4.
Figure 4.. RNA-Seq analysis comparing Myc+/+ to MycT58A/T58A mutant Pre-B and mature B cells.
(A-C) B cells were sorted from paired, littermate WT or T58A mutant mouse bone marrow. RNA was extracted from cells after stimulation with IL-7 for 48 hours, and libraries were prepared and barcoded. After sequencing, analysis was performed using the DESeq2 R package. Differentially expressed genes are depicted in dark blue on the volcano plot in panel A, with each gene plotted as the log2 fold-change (x-axis) against the −log10 transformation of the p value (y-axis). Enrichment analysis (using EnrichR package) was performed on up regulated (panel B) and down regulated (panel C) genes. The panel B plot (top) depicts enriched pathways from MSigDB Hallmark and Reactome genesets, and (bottom) a volcano plot showing differentially expressed genes involved in glycolysis labeled and highlighted in blue. Panel C (top) shows enrichment of down regulated genes for pathways (MSigDB Hallmark and ENCODE/CHEA ChIP bound transcription factors), and (bottom) differentially expressed genes involved in interferon response, which are labeled and highlighted in blue. (D) Flow cytometry analysis of glucose uptake potential was assessed by incorporation into cells of fluorescent labeled NBDG (right panel) and Mitotracker red (left panel) in Myc+/+ and MycT58A/T58A mutant cells stimulated with IL-7. The fluorescent intensity (x-axis) is plotted against cell number (y-axis) in the plot overlays, with the curve for Myc+/+ cells in blue, and MycT58A/T58A mutant in red. (E) IL-7 stimulated cells were untreated, or treated with either mitochondrial inhibitors (Metformin, Oligomycin) or glucose uptake inhibitor, 2-DG (x-axis). Cells were counted, and plotted as percent of control, untreated cells (y-axis). Myc+/+ cells are shown in blue, and MycT58A/T58A cells in red. (F-H) B cells were sorted from Myc+/+ or MycT58A/T58A mutant mouse spleens using anti-B220 coated magnetic beads (MACS). RNA was extracted after stimulation with LPS for 48 hours as described above. Paired analysis was performed using the DESeq2 R package. Up and down regulated genes are shown in dark blue on the volcano plot in panel F, and each gene is plotted as log2 fold-change (x-axis) against the −log10 transformation of the p value (y-axis). Enrichment analysis (EnrichR) was performed for up regulated (panel G) and down regulated (panel H) genes. The panel G plot (top) depicts enriched pathways (from GO biological process), and (bottom) a volcano plot showing differentially expressed genes involved in ribosomal protein biogenesis labeled and highlighted in blue. Panel H (top) shows enrichment of down regulated (MSigDB Hallmark genesets), and (bottom) differentially expressed genes involved in the unfolded protein response, which are labeled and highlighted in blue.
Figure 5.
Figure 5.. Genomic analysis of Myc at promoters and enhancers in Myc+/+ vs MycT58A/T58A cells.
Pre-B or mature B cells sorted from bone marrow and spleen of Myc+/+ and MycT58A/T58A mice were stimulated with IL-7 (for marrow derived Pre-B cells, upper panels) and LPS (mature B cells, lower panels) for 48 hours, and 1 million cells were used for Auto Cut&Run to detect Myc, H3K27Ac, and H3K3Me2, followed by barcoding, sequencing and alignment. (A) MYC bound genes are shown (dark blue circles) on the volcano plots depicting the RNASeq datasets (also shown in Figure 4) comparing gene expression in MycT58A/T58A vs Myc+/+ B cells stimulated with IL7 (left panel) and LPS (right panel). Each gene is plotted as the log2 fold-change (x-axis) against the −log10 transformation of the p value (y-axis). Differentially expressed genes scatter above the dotted horizontal line (padj > 0.05). Genes labeled in red are a sample of differentially expressed genes. (B) Genomic tracks showing MYC, H3K27Ac, Pol2, and control, IgG peaks enriched in Cut&Run and ChIP-Seq (for Pol2) for Hk2 and Pkm genomic loci which have increased expression in MycT58A/T58A mutant cells. Tracks for Myc+/+ cells are shown in blue, and MycT58A/T58A are shown in red. (C) Plots of normalized read counts (y-axis) were generated centered on the TSS of all genes (left panel), genes with increased expression (middle panel), and genes with decreased expression (right panel). Plots are shown for WT cells (blue), and T58A cells (red). (D) Enhancers were identified in WT and T58A mutant, IL-7 stimulated Pre-B (IL-7) and LPS stimulated mature B cells by peakcalls for H3K27Ac and H3K4Me2 Cut&Run (see Supplemental Fig S5F). Enhancers were defined as sites enriched for both marks (and not promoter bound). Myc Cut & Run signal was plotted over all identified enhancer peaks for Myc+/+ (blue lines) and MycT58A/T58A (red lines) cells. (E) Enhancers that were Myc bound were identified by Myc peak calls that overlap enhancers. The distance to the nearest Myc bound enhancer for every gene was calculated. The log2FoldChange for every gene (determined by RNA-Seq comparing WT to T58A in IL-7 stimulated Pre-B cells) was then plotted (x-axis) against the distance to the nearest Myc bound enhancer (y-axis). Differentially expressed genes are represented by filled circles, and the adjusted p values determined for each gene by RNA-Seq is shown by red color intensity. (F) Cumulative distribution function comparing the distance of each gene to the nearest Myc bound enhancer. Genes were ranked according to distance to the nearest Myc bound enhancer. Differentially expressed (dark blue line) are compared to an equal sized set of random genes that are expressed during IL7 treatment, but not differential (light blue line). Statistical correlation assessing the difference between the curves was determined by Kolmogorov-Smirnoff test (p = 8×10⁻⁶).
Figure 6.
Figure 6.. Model depicting dynamics of transcription as a consequence of Myc-T58 phosphorylation.
MYC is activated by extracellular signaling via PI-3K and AKT activation, which inhibit GSK3b, and Myc-T58A phosphorylation. This activates a molecular ‘switch’ that changes the state of cells, allowing increased proliferation with balanced survival and self-renewal. With T58A mutation, the switch is locked into the on position changing transcription of regions near MYC bound enhancers. Many genes involved in glycolysis, nucleotide and fatty acid biosynthesis, and protein translation genes (shown in red) are increased in expression in T58A mutant cells, while many inflammatory, apoptosis, and differentiation genes are decreased (shown in blue).

References

    1. Adams JM, Harris AW, Pinkert CA, Corcoran LM, Alexander WS, Cory S, Palmiter RD, Brinster RL. 1985. The c-myc oncogene driven by immunoglobulin enhancers induces lymphoid malignancy in transgenic mice. Nature 318: 533–538. - PubMed
    1. Babcock JT, Nguyen HB, He Y, Hendricks JW, Wek RC, Quilliam LA. 2013. Mammalian target of rapamycin complex 1 (mTORC1) enhances bortezomib-induced death in tuberous sclerosis complex (TSC)-null cells by a c-MYC-dependent induction of the unfolded protein response. J Biol Chem 288: 15687–15698. - PMC - PubMed
    1. Belluschi S, Calderbank EF, Ciaurro V, Pijuan-Sala B, Santoro A, Mende N, Diamanti E, Sham KYC, Wang X, Lau WWY et al. 2018. Myelo-lymphoid lineage restriction occurs in the human haematopoietic stem cell compartment before lymphoid-primed multipotent progenitors. Nat Commun 9: 4100. - PMC - PubMed
    1. Bhatia K, Huppi K, Spangler G, Siwarski D, Iyer R, Magrath I. 1993. Point mutations in the c-Myc transactivation domain are common in Burkid’s lymphoma and mouse plasmacytomas. Nat Genet 5: 56–61. - PubMed
    1. Bhatia K, Spangler G, Gaidano G, Hamdy N, Dalla-Favera R, Magrath I. 1994. Mutations in the coding region of c-myc occur frequently in acquired immunodeficiency syndrome-associated lymphomas. Blood 84: 883–888. - PubMed

Publication types