[Preprint]. 2023 Nov 2:2023.11.01.564908.
doi: 10.1101/2023.11.01.564908.

The shared genetic architecture and evolution of human language and musical rhythm

Affiliations

The shared genetic architecture and evolution of human language and musical rhythm

Gökberk Alagöz et al. bioRxiv. .

Update in

Abstract

Rhythm and language-related traits are phenotypically correlated, but their genetic overlap is largely unknown. Here, we leveraged two large-scale genome-wide association studies performed to shed light on the shared genetics of rhythm (N=606,825) and dyslexia (N=1,138,870). Our results reveal an intricate shared genetic and neurobiological architecture, and lay groundwork for resolving longstanding debates about the potential co-evolution of human language and musical traits.


Figures
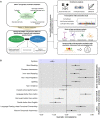
Fig. 1:
Fig. 1:. Study design and genetic correlations between rhythm and language-/reading-related traits.
(A) Flow chart shows analyses performed in our study. SNP-h2 and genetic correlations were estimated using LDSC. Effect directions in the rhythm GWAS summary statistics were flipped to obtain a proxy to probe rhythm impairment. Genomic SEM was used to identify common and independent genetic factors of rhythm impairment and dyslexia. As for post mvGWAS analyses, we adopted various methods including LDSC partitioned heritability, GCTB SBayesS, LAVA, and manual SNP-lookups. (B) Genetic correlations between rhythm and a set of language- and reading-related traits. Significant genetic correlations were indicated by full circles. Error bars correspond to standard errors.
Fig. 2:
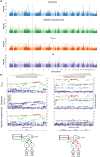
Fig. 2:. Manhattan plots for univariate and multivariate GWASs and heterogeneity. Examples of highly homogeneous and heterogeneous loci in FgRI-D results.
(A) Manhattan plots show −log10(P) values of dyslexia, rhythm GWASs, FgRI-D mvGWAS and heterogeneity across dyslexia and rhythm impairment. GWAS and mvGWAS results were GC corrected. The red lines correspond to genome-wide significance threshold (P<5×10⁻⁸). (B) LocusZoom plots of example homogeneous and heterogeneous loci, identified according to Qb p-values. SEM diagrams show effect sizes and directions of the selected SNPs for dyslexia and rhythm impairment, reflecting homogeneous vs. heterogeneous architecture of the example loci.
Fig. 3:
Fig. 3:. S-PrediXcan and LDSC partitioned heritability results for 8 regulatory brain-cell type annotations.
(A) Manhattan plot showing TWAS results on 13 brain tissue and whole-blood tissues. Each dot corresponds to a gene-tissue pair. The most significant gene-tissue association pair is shown for each gene. The red line corresponds to the genome-wide significance threshold (P<5×10⁻⁸). (B) Barplots showing LDSC SNP-h2 enrichment/depletion estimates for each of the 8 regulatory annotations. Green asterisk indicate significance after FDR correction for 8 tests (PFDR<0.05). Error bars represent standard errors.
Fig. 4:
Fig. 4:. Evolutionary analyses of dyslexia, rhythm impairment, FgRI-D and independent factors.
(A) Timescales covered by evolutionary annotations that we used. (B) LDSC partitioned heritability estimates for each annotation-trait pair. Colour coding of the bars correspond to annotations in panel A. Green asterisk indicate significance after FDR correction for 25 tests (PFDR<0.05). Error bars represent standard errors. (C) A scatter plot showing the association between FgRI-D mvGWAS −log10(P) values and primate phastCons scores. Lead SNPs in 17 genome-wide significant loci are highlighted as red data points (1 missing genome-wide significant locus lead SNP does not have a phastCons score). The dashed red line indicates genome-wide significance threshold (P<5×10⁻⁸). (D) GCTB SBayesS selection coefficient estimates as posterior means. Error bars represent standard errors. (E) Results of a manual lookup of the SNP rs10891314, showing its co-localization with DLAT. Colour coding reflects Qb scores. PhastCons and phyloP panels below show patterns of primate conservation and accelerated evolution along the haplotype.

References

    1. Nayak S. et al. Neurobiology of Language 1–50 (2022).doi: 10.1162/nol_a_00079 - DOI - PMC - PubMed
    1. Ladányi E., Persici V., Fiveash A., Tillmann B. & Gordon R.L. WIREs Cognitive Science 11, e1528 (2020). - PMC - PubMed
    1. Mehr S.A. et al. Science 366, eaax0868 (2019).
    1. Savage P.E. et al. Behavioral and Brain Sciences 44, e59 (2021). - PubMed
    1. Patel A.D. Philosophical Transactions of the Royal Society B: Biological Sciences 376, 20200326 (2021). - PMC - PubMed

Publication types