[Preprint]. 2023 Oct 27:2023.10.25.564095.
doi: 10.1101/2023.10.25.564095.

Prefrontal activity sharpens spatial sensitivity of extrastriate neurons

Affiliations

Prefrontal activity sharpens spatial sensitivity of extrastriate neurons

M Isabel Vanegas et al. bioRxiv. .

Abstract

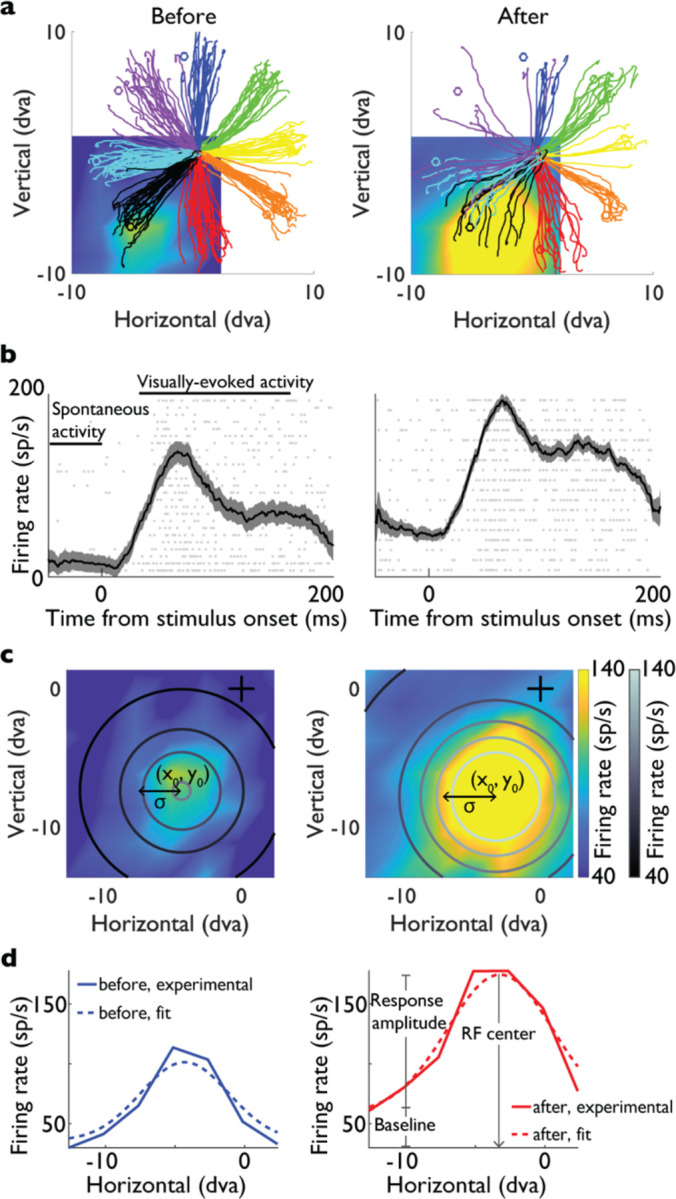
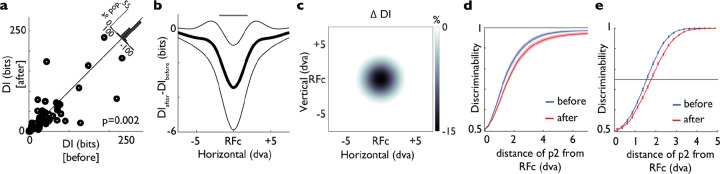
Prefrontal cortex is known to exert its control over representation of visual signals in extrastriate areas such as V4. Frontal Eye Field (FEF) is suggested to be the proxy for the prefrontal control of visual signals. However, it is not known which aspects of sensory representation within extrastriate areas are under the influence of FEF activity. We employed a causal manipulation to examine how FEF activity contributes to spatial sensitivity of extrastriate neurons. Finding FEF and V4 areas with overlapping response field (RF) in two macaque monkeys, we recorded V4 responses before and after inactivation of the overlapping FEF. We assessed spatial sensitivity of V4 neurons in terms of their response gain, RF spread, coding capacity, and spatial discriminability. Unexpectedly, we found that in the absence of FEF activity, spontaneous and visually-evoked activity of V4 neurons both increase and their RFs enlarge. However, assessing the spatial sensitivity within V4, we found that these changes were associated with a reduction in the ability of V4 neurons to represent spatial information: After FEF inactivation, V4 neurons showed a reduced response gain and a decrease in their spatial discriminability and coding capacity. These results show the necessity of FEF activity for shaping spatial responses of extrastriate neurons and indicates the importance of FEF inputs in sharpening the sensitivity of V4 responses.

Keywords: FEF; V4; cortex; feedback; inactivation; primate; receptive field; spatial sensitivity; vision; visual processing.


Conflict of interest statement

Declaration of interests The authors declare no competing interests.

Figures

Figure 1.
Figure 1.. V4 RF mapping before and after FEF inactivation.
a- Fixation task for V4 RF mapping. While the monkey fixated, brief white probes appeared pseudorandomly in a grid of possible locations. In this example, 49 possible locations are shown in gray. b- Example V4 neuron’s RF (before FEF inactivation). Color indicates average visual response across space. c- 3D plot of example V4 RF (white surface) and 2D Gaussian RF fit (color surface). d- V4 recordings were performed with a linear array or single electrode, before and after drug infusion via microinjectrode in FEF. e- Example eye position traces of microstimulation-evoked saccades, used to estimate the FEF RF. Traces are aligned to starting eye position. f- Example of animal’s performance on the MGS task at eight target locations, before and after FEF muscimol infusion. Colors indicate time relative to infusion (black shows before infusion, other colors 1–4hr after infusion). Before FEF infusion, performance is high at all locations. After muscimol infusion, performance drops for targets in the contralateral visual hemifield.
Figure 2.
Figure 2.. Responses and 2D Gaussian fits of an example V4 neuron before and after FEF inactivation.
a- Eye movement traces for memory guided saccades before (left) and after (right) FEF inactivation. Colors correspond to the eight target locations. Heat map in the background shows the example V4 RF, near the endpoints of the black traces. b- Visually-evoked activity at the peak RF location, before (left) and after FEF inactivation (right). Raster plots: each row represents one trial, each gray dot represents an action potential. Overlaid are firing rates (peri-stimulus time histogram, or PSTH traces, black) in response to probe at the location evoking the maximum V4 response, before (left) and after FEF inactivation (right). Plot shows mean ± SE across trials. Horizontal black lines indicate the time range used to calculate the spontaneous and visually-evoked activity. c- V4 RF before (left) and after FEF inactivation (right) overlaid with contour profiles based on 2D Gaussian fits. Color indicates visually-evoked activity across horizontal and vertical probe locations. σ indicates the spread of the Gaussian, or RF spread. The center of the Gaussian, or RF center, is at (x0,y0). Black cross indicates fixation point in all RF plots. d- Cross-sectional views of the experimental (solid) and Gaussian (dashed) V4 RF, before (left, blue) and after FEF inactivation (right, red). Cross-section shows responses at different horizontal probe positions for −6.1 dva vertical (chosen to include peak overall response).
Figure 3.
Figure 3.. Changes in RF properties of the V4 population following FEF inactivation.
a- Normalized population visually-evoked activity before (blue) and after FEF inactivation (red). Response is to best probe location, plotted as mean ± SE across 111 neurons. b- Population mean Gaussian fit before (blue) and after FEF inactivation (red). Response amplitude and baseline are shown for the after fit. c-f: Parameters extracted from individual 2D Gaussian fits before vs. after FEF inactivation, for 69 neurons in monkey 1 (orange) and 42 neurons in monkey 2 (purple): c- Baseline, d- RF spread (σ), and e- Response amplitude, f- Normalized gain. Histograms in the upper right show the difference (after-before) of each parameter value. Two units with baseline values >140sp/s are not shown, however they are included in the statistical tests.
Figure 4.
Figure 4.. Spatial precision of V4 responses decreases following FEF inactivation.
a- DI before and after FEF inactivation, based on the fitted Gaussian for each neuron. Histogram (upper right) shows the distribution of differences (after - before). b- Change in DI (after-before) as a function of distance from RF center (mean ± SE across the population of individual Gaussian fits). Gray bar on top shows the range where change is significant (p<0.05). c- Percent change in DI across space relative to the RF center, based on the average Gaussian parameters across the population. d- Two-point discriminability as a function of distance between stimuli, before (blue) and after FEF inactivation (red), plotted as mean ± SE across the population of individual Gaussian fits. Discriminability was measured using ROC analysis on firing rates generated from the Gaussian fits, with one probe at the RF center and the second probe a variable distance away. e- Same as d, for population average Gaussian fit.

References

    1. Acker L, Pino EN, Boyden ES, Desimone R. 2016. FEF inactivation with improved optogenetic methods. Proceedings of the National Academy of Sciences of the United States of America 113: E7297–E306 - PMC - PubMed
    1. Adesnik H, Bruns W, Taniguchi H, Huang ZJ, Scanziani M. 2012. A neural circuit for spatial summation in visual cortex. Nature 490: 226–31 - PMC - PubMed
    1. Anderson JC, Kennedy H, Martin KAC. 2011. Pathways of Attention: Synaptic Relationships of Frontal Eye Field to V4, Lateral Intraparietal Cortex, and Area 46 in Macaque Monkey. Journal of Neuroscience 31: 10872–81 - PMC - PubMed
    1. Armstrong KM, Chang MH, Moore T. 2009. Selection and Maintenance of Spatial Information by Frontal Eye Field Neurons. Journal of Neuroscience 29: 15621–29 - PMC - PubMed
    1. Armstrong KM, Fitzgerald JK, Moore T. 2006. Changes in visual receptive fields with microstimulation of frontal cortex. Neuron 50: 791–98 - PubMed

Publication types