[Preprint]. 2023 Oct 23:2023.10.21.563440.
doi: 10.1101/2023.10.21.563440.

Coordinated changes in a cortical circuit sculpt effects of novelty on neural dynamics

Affiliations

Coordinated changes in a cortical circuit sculpt effects of novelty on neural dynamics

Shinya Ito et al. bioRxiv. .

Update in

Abstract

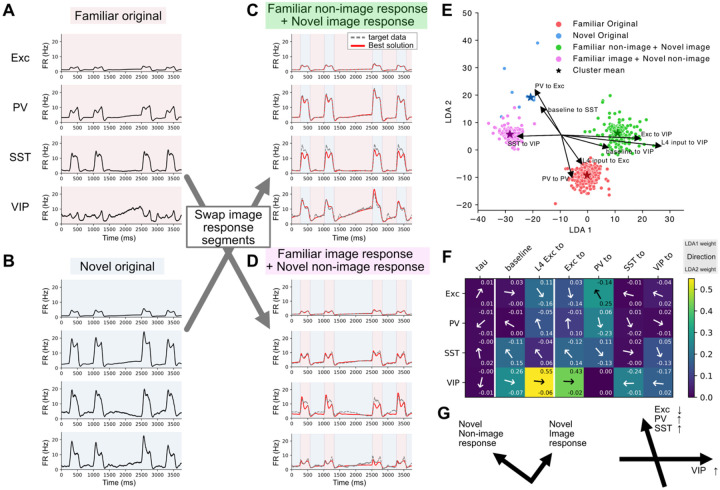
Recent studies have found dramatic cell-type specific responses to stimulus novelty, highlighting the importance of analyzing the cortical circuitry at the cell-type specific level of granularity to understand brain function. Although initial work classified and characterized activity for each cell type, the specific alterations in cortical circuitry-particularly when multiple novelty effects interact-remain unclear. To address this gap, we employed a large-scale public dataset of electrophysiological recordings in the visual cortex of awake, behaving mice using Neuropixels probes and designed population network models to investigate the observed changes in neural dynamics in response to a combination of distinct forms of novelty. The model parameters were rigorously constrained by publicly available structural datasets, including multi-patch synaptic physiology and electron microscopy data. Our systematic optimization approach identified tens of thousands of model parameter sets that replicate the observed neural activity. Analysis of these solutions revealed generally weaker connections under novel stimuli, as well as a shift in the balance e between SST and VIP populations. Along with this, PV and SST populations experienced overall more excitatory influences compared to excitatory and VIP populations. Our results also highlight the role of VIP neurons in multiple aspects of visual stimulus processing and altering gain and saturation dynamics under novel conditions. In sum, our findings provide a systematic characterization of how the cortical circuit adapts to stimulus novelty by combining multiple rich public datasets.


Figures

Figure 1:
Figure 1:
Illustration of the experimental setup and the phenomenon under investigation. A: Schematics of the questions addressed in this study. The image set changes between the Familiar and Novel sessions. B: Essential structure of the task relevant to this study. Stimuli are repeated at a regular cadence (250 ms on, 500 ms off). The stimulus is omitted 5% of the time, but the temporal cadence is preserved. C: Average neural population activity in layer 2/3 around the stimulus omission. The shaded area represents the SEM, with the denominator being the number of specimens. (See Methods for details.)
Figure 2:
Figure 2:
Schematic representation of the modeling workflow. The four-population stabilized supralinear network (SSN) is used to examine the effect of novelty on cortical dynamics. The multi-patch synaptic physiology dataset (Campagnola et al., 2022; Seeman et al., 2018) (https://portal.brain-map.org/explore/connectivity/synaptic-physiology) and MICrONS electron microscopy dataset (The MICrONS Consortium et al., 2021) (https://www.microns-explorer.org/cortical-mm3) are used to construct a parameter cost that constrains the model connectivity parameters. The activity of the L4 Exc population from the Neuropixels data serves as the input drive (together with the baseline constant input), and the model output is compared with L2/3 activity from the Neuropixels to construct the fit-cost. The optimization is repeated 100,000 times with different random initial parameters for each session to gather statistics on the solutions.
Figure 3:
Figure 3:
Statistics of the solutions and acceptance criteria. A: Histograms of the fitting cost values for all solutions passing the parameter cutoff criteria for the Familiar condition. The cost function values for the best solution and the solution near the acceptance threshold are indicated by green and orange dashed lines, respectively. The shaded area represents the number of solutions with no visual response (see Methods for details). B: Firing rate traces of the target data, the best solution, and a solution near the acceptance threshold for each population. C, D: Same as A and B, but for the Novel condition. E, F: Number of accepted solutions as a function of varying acceptance thresholds for the Familiar and Novel conditions, respectively. The black line indicates the number of accepted solutions wherein all populations passed the acceptance threshold. G-I: PCA projection of the parameters. Each panel highlights different categories of solutions with color: those with poor fit (G), those with poor parameter cost (H), and those that are accepted (I). Solutions with a fit cost greater than 0.3 for any population are excluded from the PCA analysis to enhance the visibility of the structure of the accepted solution. The accepted Familiar and Novel solutions form relatively tight clusters in the PCA space, providing a basis for subsequent LDA analysis.
Figure 4:
Figure 4:
Summary of the parameter changes between the Familiar and Novel conditions. A: Histograms of model parameters for each condition. Although some parameter distributions show significant shift in their average values, most distributions overlap between the two conditions. B: Heatmap illustrating the average parameter shifts from Familiar to Novel condition. The confidence interval was calculated from the shifts in 106 randomly sampled solution pairs. C: Covariance matrix depicting the relationships among the parameters within conditions.
Figure 5:
Figure 5:
Statistical characterization of the accepted solutions using linear discriminant analysis (LDA). A: Schematic of the LDA procedure. It identifies a separating hyperplane in the parameter space, given the cluster labels. The vector orthogonal to the hyperplane is termed the LDA projection vector. B: Probability distribution of the number of solutions projected along the LDA projection vector. The familiar and novel conditions are completely separable. C: A visualization of the data points in the z-scored parameter space along two specific axes. Correlations between the parameters can be seen for both conditions and using such information enhances the separation effectiveness. D: LDA projection vector between the model solutions for the Familiar and Novel conditions, with colors indicating the weight of each parameter. A positive sign indicates that a higher parameter value is more attributable to the Novel condition, and vice versa. Meanwhile, a larger magnitude denotes a more substantial role in differentiating the conditions. E: Summary of relative changes in input to each neuronal population when transitioning from Familiar to Novel conditions. The transition is characterized by generally inhibitory input into the Exc and VIP populations and a generally excitatory input into the PV and SST populations.
Figure 6:
Figure 6:
Target data manipulation to understand how different parts of the data affect the parameters. A, B: Firing rate traces of the Familiar and Novel datasets. C, D: Modified versions of the data wherein the image response and non-image response segments are swapped between sessions. E: Projection of the parameters of accepted solutions in the 2-dimensional LDA space, along with a biplot of the eight most influential parameters. F: Projection of each parameter into the 2-dimensional LDA space. The arrow denotes the direction, and the color indicates the weights of each element. G: Summary schematics of the target manipulation study. Each swapped session can be viewed as a change in certain segments from the original familiar session. When different segments are swapped, they form orthogonal vectors in the 2D LDA space (left). The summation of these changes corresponds to the total transformation of the firing rate traces. Notably, alterations to inputs into the VIP population uniquely result in horizontal movement in the LDA space, corresponding to the swapping of different segments (right).
Figure 7:
Figure 7:
The networks in the Novel condition have higher gain and earlier saturation compared to those in the Familiar condition. A: Illustration of the stimuli applied with the baseline firing rate fixed at 2.7 Hz for both sessions and the stimulus amplitude indicating deviation from 2.7 Hz. B, C: Population responses to the stimuli with different amplitudes for example solutions of the Familiar and Novel conditions, respectively. The colors of the traces correspond to those shown in (A). D, E: Population responses as a function of the stimulus amplitude for all the solutions in the Familiar and Novel conditions, respectively. The dashed lines indicate the stimulus levels of the experimental Familiar and Novel sessions (activity of the L4 Exc population). F: The derivative of the Exc population responses as a function of the stimulus amplitude (stimulus gain) for the Familiar and Novel solutions.
Figure 8:
Figure 8:
Summary schematic of the transition from the Familiar to the Novel network. This figure illustrates key changes in the connections in our model networks. Connections exhibiting changes with wholly positive confidence intervals are labeled as ‘strengthened,’ while those with wholly negative confidence intervals are labeled as ‘weakened’ and further emphasized by colored arrows (see Fig. 4B). The transition from the Familiar to the Novel condition is characterized by general weakening of the connections, with increased control of the SST population by the VIP population.

References

    1. Aitken K., Campagnola L., Garrett M., Olsen S., & Mihalas S. (2023). Familiarity modulated synapses model visual cortical circuit novelty responses [Preprint]. bioRxiv. 10.1101/2023.08.16.553635 - DOI
    1. Bendixen A., SanMiguel I., & Schröger E. (2012). Early electrophysiological indicators for predictive processing in audition: A review. International Journal of Psychophysiology, 83(2), 120–131. 10.1016/j.ijpsycho.2011.08.003 - DOI - PubMed
    1. Billeh Y. N., Cai B., Gratiy S. L., Dai K., Iyer R., Gouwens N. W., Abbasi-Asl R., Jia X., Siegle J. H., Olsen S. R., Koch C., Mihalas S., & Arkhipov A. (2020). Systematic Integration of Structural and Functional Data into Multi-scale Models of Mouse Primary Visual Cortex. Neuron, 106(3), 388–403.e18. 10.1016/j.neuron.2020.01.040 - DOI - PubMed
    1. Braga A., & Schönwiesner M. (2022). Neural Substrates and Models of Omission Responses and Predictive Processes. Frontiers in Neural Circuits, 16, 799581. 10.3389/fncir.2022.799581 - DOI - PMC - PubMed
    1. Bunzeck N., & Düzel E. (2006). Absolute Coding of Stimulus Novelty in the Human Substantia Nigra/VTA. Neuron, 51(3), 369–379. 10.1016/j.neuron.2006.06.021 - DOI - PubMed

Publication types