[Preprint]. 2023 Nov 29:2023.10.30.564796.
doi: 10.1101/2023.10.30.564796.

Decoding Heterogenous Single-cell Perturbation Responses

Affiliations

Decoding Heterogenous Single-cell Perturbation Responses

Bicna Song et al. bioRxiv. .

Update in

  • Decoding heterogeneous single-cell perturbation responses.
    Song B, Liu D, Dai W, McMyn NF, Wang Q, Yang D, Krejci A, Vasilyev A, Untermoser N, Loregger A, Song D, Williams B, Rosen B, Cheng X, Chao L, Kale HT, Zhang H, Diao Y, Bürckstümmer T, Siliciano JD, Li JJ, Siliciano RF, Huangfu D, Li W. Song B, et al. Nat Cell Biol. 2025 Mar;27(3):493-504. doi: 10.1038/s41556-025-01626-9. Epub 2025 Feb 26. Nat Cell Biol. 2025. PMID: 40011559 Free PMC article.

Abstract

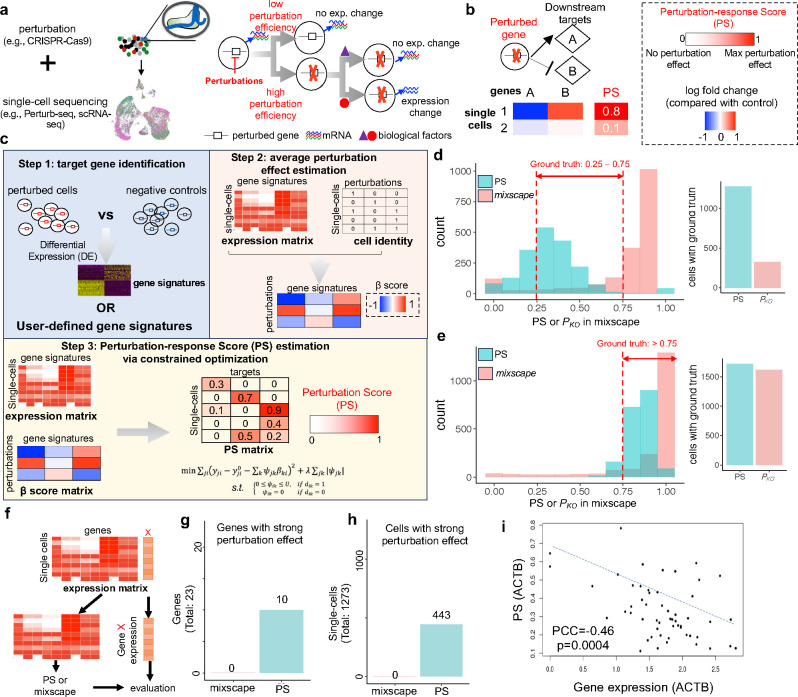
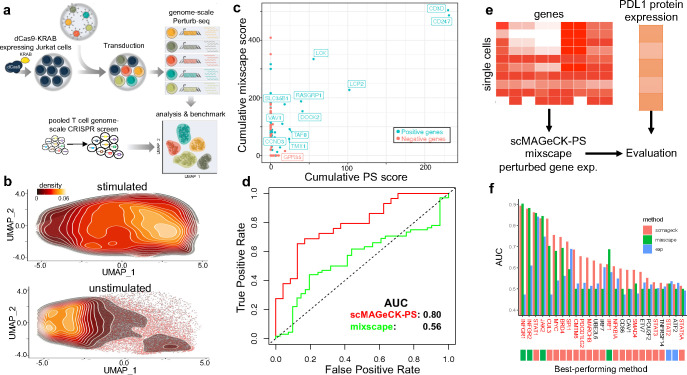
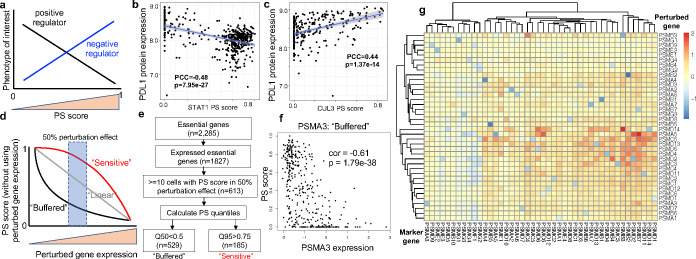
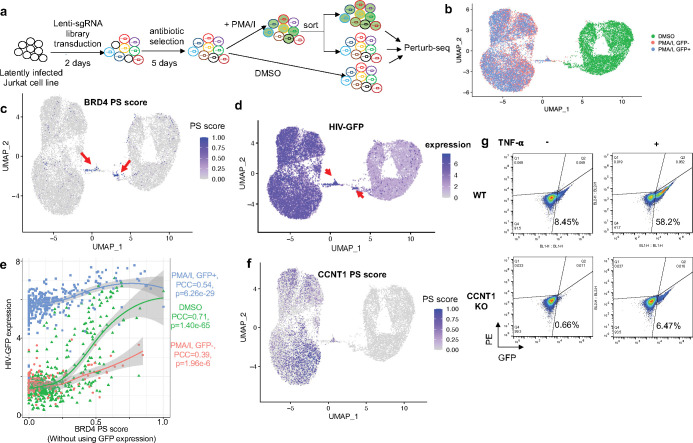
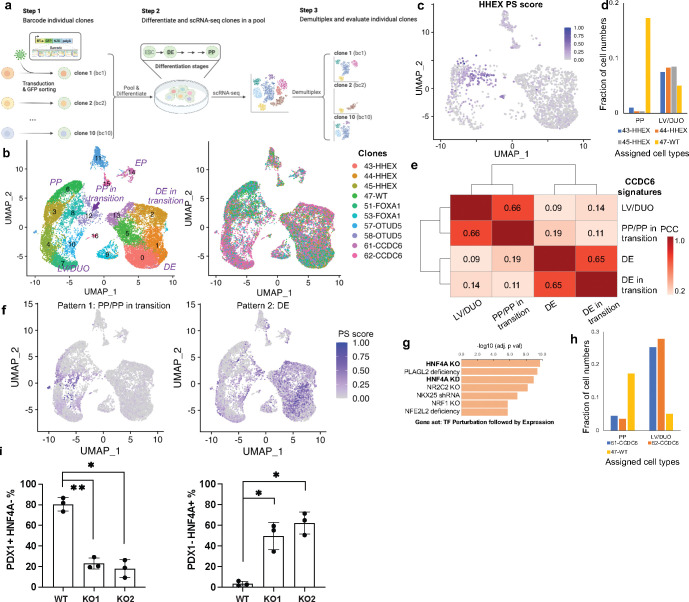
Understanding diverse responses of individual cells to the same perturbation is central to many biological and biomedical problems. Current methods, however, do not precisely quantify the strength of perturbation responses and, more importantly, reveal new biological insights from heterogeneity in responses. Here we introduce the perturbation-response score (PS), based on constrained quadratic optimization, to quantify diverse perturbation responses at a single-cell level. Applied to single-cell transcriptomes of large-scale genetic perturbation datasets (e.g., Perturb-seq), PS outperforms existing methods for quantifying partial gene perturbation responses. In addition, PS presents two major advances. First, PS enables large-scale, single-cell-resolution dosage analysis of perturbation, without the need to titrate perturbation strength. By analyzing the dose-response patterns of over 2,000 essential genes in Perturb-seq, we identify two distinct patterns, depending on whether a moderate reduction in their expression induces strong downstream expression alterations. Second, PS identifies intrinsic and extrinsic biological determinants of perturbation responses. We demonstrate the application of PS in contexts such as T cell stimulation, latent HIV-1 expression, and pancreatic cell differentiation. Notably, PS unveiled a previously unrecognized, cell-type-specific role of coiled-coil domain containing 6 (CCDC6) in guiding liver and pancreatic lineage decisions, where CCDC6 knockouts drive the endoderm cell differentiation towards liver lineage, rather than pancreatic lineage. The PS approach provides an innovative method for dose-to-function analysis and will enable new biological discoveries from single-cell perturbation datasets.

Keywords: CRISPR-based genetic perturbations; Perturb-seq; computational model; single-cell RNA-seq.


Conflict of interest statement

Competing interests T.B. is a co-founder and Managing Director of Myllia Biotechnology. A.K., A.V., N.U. and A.L. are employees of Myllia Biotechnology. Other authors declare that they have no competing interest.

Figures

Figure 1.
Figure 1.. The Perturbation-response Score (PS) framework and benchmark.
a, Overview of different technical and biological factors that contribute to heterogenous perturbation outcomes from single-cell perturbation datasets. b, Using downstream gene expressions to infer the value of PSs. C, Overview of the scMAGeCK-PS that estimates PS value. d-e, Benchmark results of both PS and mixscape using simulated datasets, where 50% (d) and 100% € gene perturbation effects are simulated using scDesign3. Here, the expressions of 200 differentially expressed genes (DEGs) from bulk RNA-seq (Nelf knockout vs. wild-type) are simulated, and ground truth efficiency value is indicated in red color. f, Benchmark pipeline using real CRISPRi-based Perturb-seq datasets, where the perturbation efficiency can be evaluated directly via gene expression. g-h, Benchmark results of mixscape and scMAGeCK-PS using a published Perturb-seq dataset, by counting the numbers of cells or genes with strong perturbation effects. A gene is considered to have strong perturbation effect, if a strong negative correlation (Pearson correlation coefficient < −0.1) is observed between PS and the expression of that gene across all perturbed cells. A cell is considered to be strongly perturbed, if its predicted efficiency score (by scMAGeCK-PS or mixscape) within one cell is greater than 0.5. The Perturb-seq experiment is performed with low MOI condition, where most cells have only 1 expressed guide. i, An representative estimation results of scMAGeCK-PS and their correlations of ACTB expression.
Figure 2.
Figure 2.. Additional benchmark results using genome-scale Perturb-seq and ECCITE-seq.
a, Benchmark procedure using a genome-scale Perturb-seq and a published, pooled T cell CRISPR screen. b, The distribution of unstimulated and stimulated Jurkat cells along the UMAP plot. c, The correlation of predicted scores by scMAGeCK-PS and mixscape. d, the Receiver-Operating Characteristic (ROC) curve of both methods in separating positive and negative hits. e-f, Benchmark using a published ECCITE-seq where PDL1 protein expression is used as gold standard (e), and the performance of different methods in terms of predicting PLD1 protein expression (f).
Figure 3.
Figure 3.. Dose-dependent responses of perturbations.
a, The correlation between a gene’s PS and a phenotype of interest indicates positive (or negative) regulations. b-c, The correlation between PDL1 protein expression and the PS of CUL3 (b) and STAT1 (c). CUL3 is a known negative regulator of PDL1, while STAT1 is a known positive regulator. d, The classification of buffered or sensitive genes, based on perturbed gene expression and PS. e, The classification of buffered or sensitive genes from published Perturb-seq datasets focusing essential genes in K562. f, The perturbation-expression plot of PSMA3, a buffered gene. g, The log fold changes of mark gene expressions (columns) upon perturbing proteasome genes (rows) from the essential gene Perturb-seq dataset.
Figure 4.
Figure 4.. Perturb-seq on HIV latency.
a, The experimental design of Perturb-seq. b, The UMAP plot of single-cell transcriptome profiles. Cells are colored by three different conditions. c, The distribution of BRD4 PS. d, The expression of HIV-GFP. e, The correlations between HIV-GFP expression and BRD4 PS that does not use HIV-GFP as target gene. f, The distribution of CCNT1 PS. g, The protein expression of HIV-GFP in response to CCNT1 knockout in different cell states (TNF-alpha vs non-stimulated).
Figure 5.
Figure 5.. Pooled scRNA-seq on pancreatic differentiation.
a, Experimental design of multiplexing scRNA-seq on the knockout clones of different genes. b, The UMAP plot of single-cell transcriptome profiles, colored by different clusters (left) or clones (right). c, The PS distribution of HHEX. d, The percentage of cells in PP/LV/DUO cell types from different clones. e, The correlations of CCDC6 PSs calculated from different HHEX cell types. The Pearson Correlation Coefficient (PCC) is calculated from all cells with CCDC6 knockouts and is shown as numbers on the heatmap. f, Two different distribution patterns of CCDC6 PSs. g, The top enriched GO terms of DEGs from PP/PP in transition. Enrichr was used to perform enrichment analysis. h, The percentage of cells in PP/LV/DUO cell types from CCDC6 clones. i, The percentage of cells with PDX1+ (a PP marker) or HNF4A+ (a LV marker) by flow cytometry sorting. The data is based on two CCDC6 knockouts (KO1, KO2) and one wild-type (WT) control. Three independent replicates are performed for each condition. The multiple comparison-adjusted p value is calculated by one-way ANOVA test. *p<0.05, **p<0.01.

References

    1. High-content CRISPR screening. Nat Rev Methods Primers 2022;2:. 10.1038/s43586-022-00098-7. - DOI - PMC - PubMed
    1. Srivatsan SR, McFaline-Figueroa JL, Ramani V, Saunders L, Cao J, Packer J, et al. Massively multiplex chemical transcriptomics at single-cell resolution. Science 2020;367:45–51. - PMC - PubMed
    1. Dixit A, Parnas O, Li B, Chen J, Fulco CP, Jerby-Arnon L, et al. Perturb-Seq: Dissecting Molecular Circuits with Scalable Single-Cell RNA Profiling of Pooled Genetic Screens. Cell 2016;167:1853–1866.e17. - PMC - PubMed
    1. Adamson B, Norman TM, Jost M, Cho MY, Nuñez JK, Chen Y, et al. A Multiplexed Single-Cell CRISPR Screening Platform Enables Systematic Dissection of the Unfolded Protein Response. Cell 2016;167:1867–1882.e21. - PMC - PubMed
    1. Jaitin DA, Weiner A, Yofe I, Lara-Astiaso D, Keren-Shaul H, David E, et al. Dissecting Immune Circuits by Linking CRISPR-Pooled Screens with Single-Cell RNA-Seq. Cell 2016;167:1883–1896.e15. - PubMed

Publication types