[Preprint]. 2023 Oct 26:2023.10.26.564245.
doi: 10.1101/2023.10.26.564245.

Integrating brainstem and cortical functional architectures

Affiliations

Integrating brainstem and cortical functional architectures

Justine Y Hansen et al. bioRxiv. .

Update in

Abstract

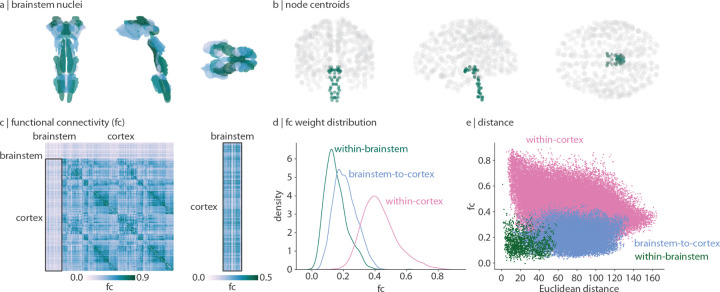
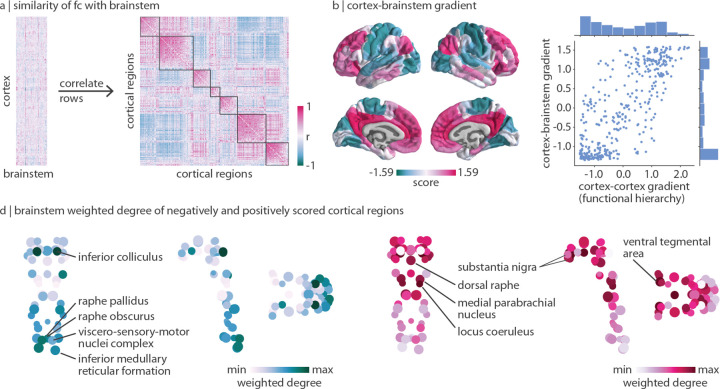
The brainstem is a fundamental component of the central nervous system yet it is typically excluded from in vivo human brain mapping efforts, precluding a complete understanding of how the brainstem influences cortical function. Here we use high-resolution 7 Tesla fMRI to derive a functional connectome encompassing cortex as well as 58 brainstem nuclei spanning the midbrain, pons and medulla. We identify a compact set of integrative hubs in the brainstem with widespread connectivity with cerebral cortex. Patterns of connectivity between brainstem and cerebral cortex manifest as multiple emergent phenomena including neurophysiological oscillatory rhythms, patterns of cognitive functional specialization, and the unimodal-transmodal functional hierarchy. This persistent alignment between cortical functional topographies and brainstem nuclei is shaped by the spatial arrangement of multiple neurotransmitter receptors and transporters. We replicate all findings using 3 Tesla data from the same participants. Collectively, we find that multiple organizational features of cortical activity can be traced back to the brainstem.


Figures

Figure 1.
Figure 1.. Brainstem-cortex functional connectivity |
(a) Coronal (posterior view), saggital, and axial view of the thresholded (35%) probabilistic template for all 58 brainstem nuclei in the Brainstem Navigator atlas (https://www.nitrc.org/projects/brainstemnavig/ [16]). (b) Coronal (posterior view), saggital, and axial view of cortical (grey points, n = 400) and brainstem (green points, n = 58) parcel coordinate centroids. (c) Left: functional connectivity (FC) matrix (458 regions × 458 regions). Right: functional connectivity matrix between cortex and brainstem (400 cortical regions × 58 brainstem nuclei). (d) Density distributions of functional connectivity within brainstem (green), between brainstem and cortex (blue), and within cortex (pink). (e) Scatter plot of functional connectivity between regions as a function of Euclidean distance between parcel centroids. Within-cortex r = −0.29, p ≈ 0; brainstem-cortex r = 0.05, p = 8.7 × 10⁻¹⁶; within-brainstem r = −0.11, p = 3.4 × 10⁻⁶.
Figure 2.
Figure 2.. Dominant patterns of brainstem-cortex functional connectivity |
(a) Brainstem-to-cortex weighted degree is calculated by summing a brainstem nucleus’ functional connectivity across all cortical regions. Coronal (posterior view), sagittal, and axial perspectives of brainstem nuclei are shown. Node size and colour reflect weighted degree, and edges are plotted for the 5% strongest functional connections within the brainstem. Key brainstem nuclei are labelled. (b) Cortex-to-brainstem weighted degree is calculated by summing a cortical region’s functional connectivity across all brainstem nuclei. (c) Cortex-to-brainstem weighted degree binned according to classes of laminar differentiation (one-way ANOVA F = 18.5, p = 2.8 × 10⁻¹¹) [69, 79]; plmb = paralimbic; het = heteromodal; uni = unimodal; idt = idiotypic. (d) Cortex-to-brainstem weighted degree binned according to classes of cytoarchitecture (one-way ANOVA F = 35.6, p = 2.0 × 10⁻³⁴) [121, 122]; ins = insular; lim = limbic; assoc1 = association network 1; assoc2 = association network 2; pss = primary/secondary sensory; pm = primary motor; ps = primary sensory. (e) Scatter plots are shown for the correlation between cortex-to-brainstem weighted degree and seven metrics of MEG dynamics: power spectrum distributions for six canonical frequency bands and the intrinsic timescale (temporal memory of a neural element, see Methods for details); each point is a brain region (N = 400). Cortical distributions of MEG measures are shown on the brain surface below each plot and are derived from data in the HCP [119].
Figure 3.
Figure 3.. Brainstem communities underlying cortical function |
The Louvain community detection algorithm was applied to determine whether brainstem nuclei can be organized into distinct communities that make specific connectivity patterns with the cortex. (a) Left: for all 458 nodes (400 cortical, 58 brainstem), we correlate (Spearman r) the node’s brainstem functional connectivity profile with the weighted degree pattern shown in the inset and in Fig. 2a. The density distribution of Spearman’s r is shown (median r = 0.97). Middle: this brainstem map (weighted degree of brainstem-to-cortex functional connectivity) is regressed out of each cortical region’s brainstem functional connectivity pattern, resulting in a matrix (400 cortical regions × 58 brainstem nuclei) of functional connectivity residuals. Right: correlation matrix representing how similarly (Spearman’s r) two brainstem nuclei are functionally connected with the cortex, above and beyond the dominant pattern of connectivity between brainstem and cortex. Brainstem nuclei are ordered according to community affiliation (community colours shown on the right) and communities are outlined within the heatmap. Brackets on the right indicate how communities are joined in coarser community detection solutions (yellow combined with grey, blue combined with pink). (b) Community assignments from the Louvain community detection algorithm. Coronal (posterior view), sagittal, and axial perspectives of brainstem nuclei are shown. Node size is proportional to weighted degree shown in Fig. 2a. See Table 1 for a list of all brainstem nuclei organized by community affiliation. (c) Cortical weighted degree patterns are calculated as the sum of a cortical region’s functional connectivity with all brainstem nuclei within a specific community, and are shown for all five communities. These maps represent how each brainstem community is connected with the cortex. (d) Each cortical weighted degree pattern in panel (c) was correlated to 123 cognitive and behavioural meta-analytic activation maps from Neurosynth [126]. Only the top 10% correlations are shown.
Figure 4.
Figure 4.. Mapping chemoarchitecture to brainstem communities |
For each community (shown on the brainstem plot on the left, as well as in Fig. 3b), a multiple linear regression model was fit between 18 cortical neurotransmitter receptor and transporter density profiles and the community’s cortical weighted degree pattern (shown as surface plots, as well as in Fig. 3c). Model fits (adjusted R2) are shown in the bar plot. Dominance analysis was applied to the independent variables (receptors and transporters) to determine which receptors/transporters were contributing most to the model fit [4] Percent contribution is shown in the heatmap. Receptor/transporter data were acquired from a PET atlas of neurotransmitter receptor/transporter densities in the human brain [51, 65].
Figure 5.
Figure 5.. Brainstem nuclei delineate unimodal and transmodal cortical regions |
(a) Left: functional connectivity residuals (identical to the matrix shown on the left in Fig. 3a). Right: correlation matrix represents how similarly (Spearman’s r) two cortical regions are functionally connected with the brainstem above and beyond the dominant pattern of brainstem-cortex connectivity. Outlines are shown around the seven Yeo-Krienen resting-state networks (order: control, default mode, dorsal attention, limbic, ventral attention, somato-motor, visual). (b) Diffusion map embedding was applied to the matrix shown in panel (a). Left: the first gradient of cortex-brainstem functional connectivity. Right: correlation between the first gradient of cortex-brainstem connectivity and the first gradient of cortex-cortex functional connectivity (also called the cortical functional hierarchy, the unimodal-transmodal axis, and the sensory-association axis; r = 0.77, pspin = 0.0001). Distribution of gradient values are shown for both gradients. (d) Brainstem weighted degree patterns are calculated as the sum of a brainstem nucleus’ functional connectivity with all negatively- (left) or positively- (right) scored regions of the cortical gradient shown in panel (b). Coronal (posterior view), sagittal, and axial perspectives of brainstem nuclei are shown. Node size is proportional to weighted degree shown in Fig. 2a.

References

    1. Aghourian M., Legault-Denis C., Soucy J., Rosa-Neto P., Gauthier S., Kostikov A., Gravel P., and Bedard M. (2017). Quantification of brain cholinergic denervation in alzheimer’s disease using pet imaging with [18 f]-feobv. Molecular psychiatry, 22(11):1531–1538. - PubMed
    1. Alexander-Bloch A. F., Shou H., Liu S., Satterthwaite T. D., Glahn D. C., Shinohara R. T., Vandekar S. N., and Raznahan A. (2018). On testing for spatial correspondence between maps of human brain structure and function. NeuroImage, 178:540–551. - PMC - PubMed
    1. Assem M., Glasser M. F., Van Essen D. C., and Duncan J. (2020). A domain-general cognitive core defined in multimodally parcellated human cortex. Cerebral Cortex, 30(8):4361–4380. - PMC - PubMed
    1. Azen R. and Budescu D. V. (2003). The dominance analysis approach for comparing predictors in multiple regression. Psychological methods, 8(2):129. - PubMed
    1. Baillet S. (2017). Magnetoencephalography for brain electrophysiology and imaging. Nature neuroscience, 20(3):327–339. - PubMed

Publication types