[Preprint]. 2023 Oct 30:rs.3.rs-3467812.
doi: 10.21203/rs.3.rs-3467812/v1.

Senescent and disease-associated microglia are modifiable features of aged brain white matter

Affiliations

Senescent and disease-associated microglia are modifiable features of aged brain white matter

Chase M Carver et al. Res Sq. .

Abstract

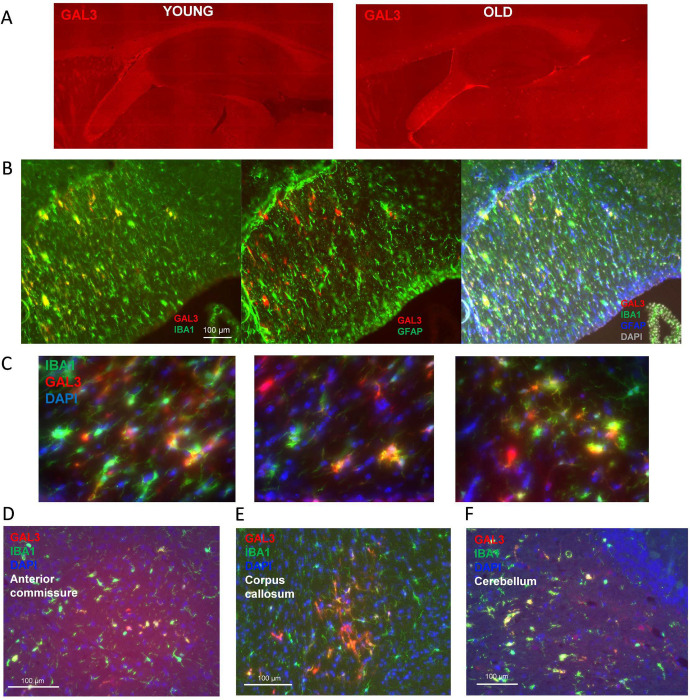
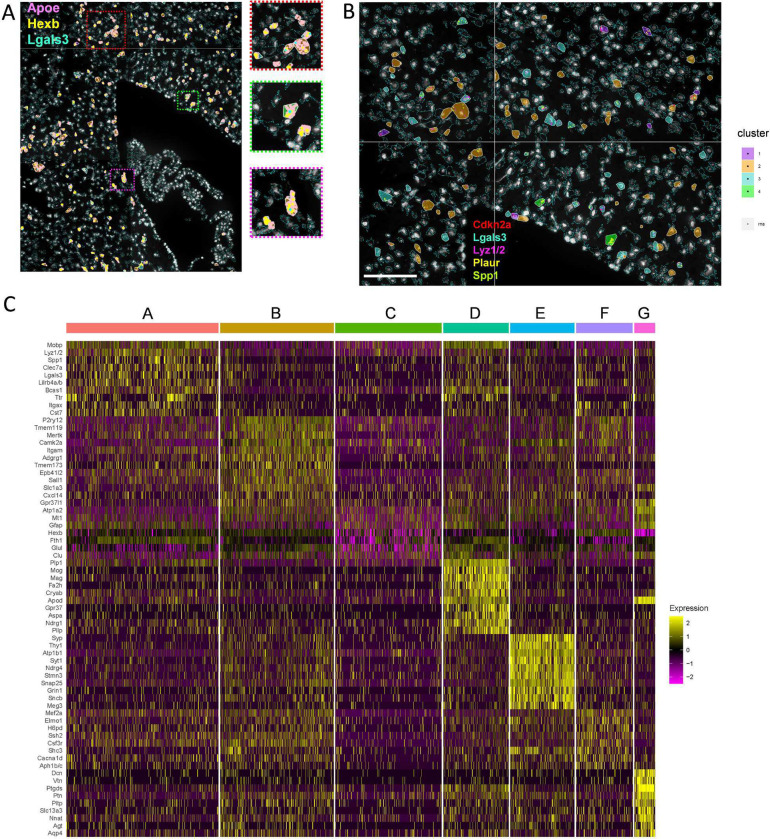
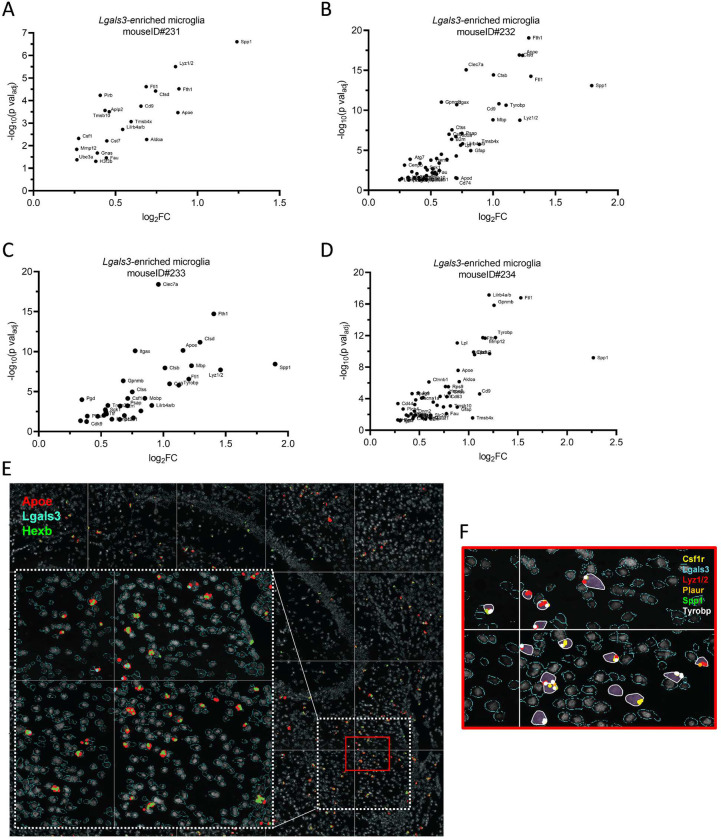
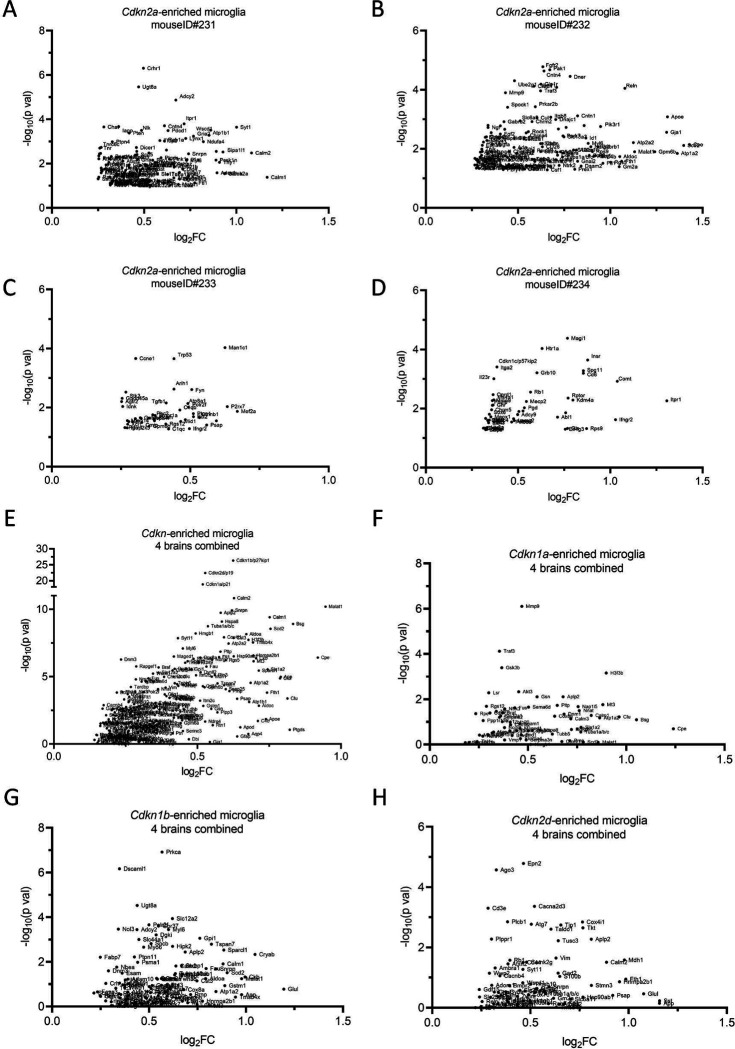
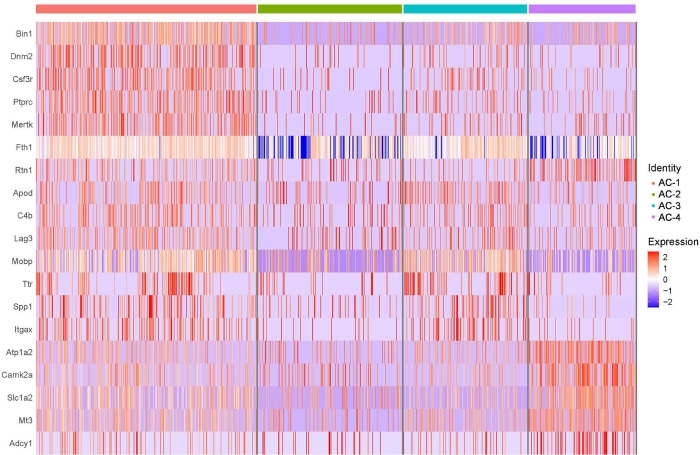
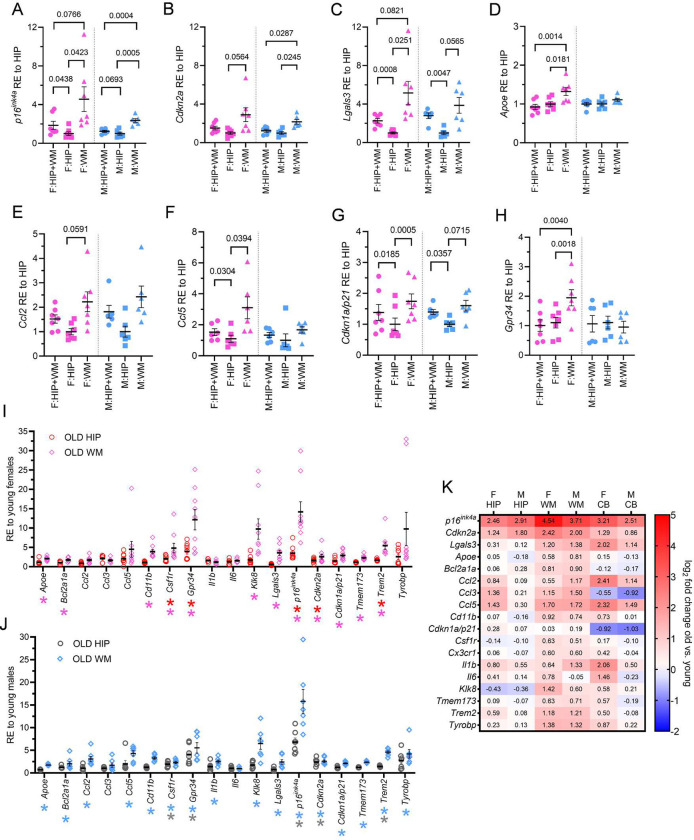
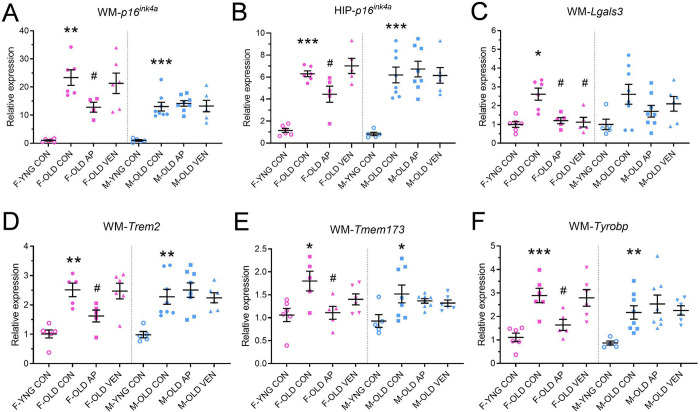
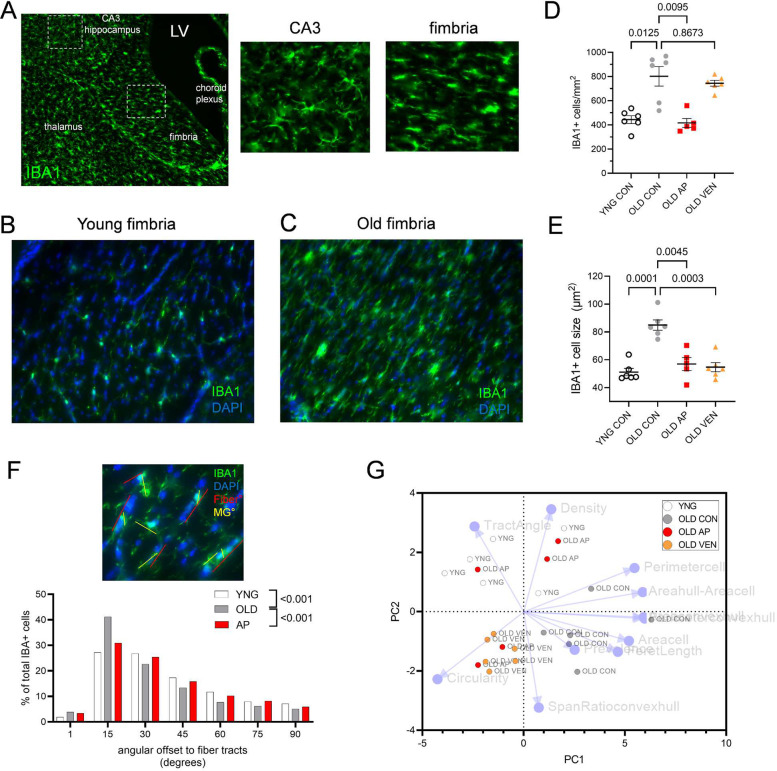
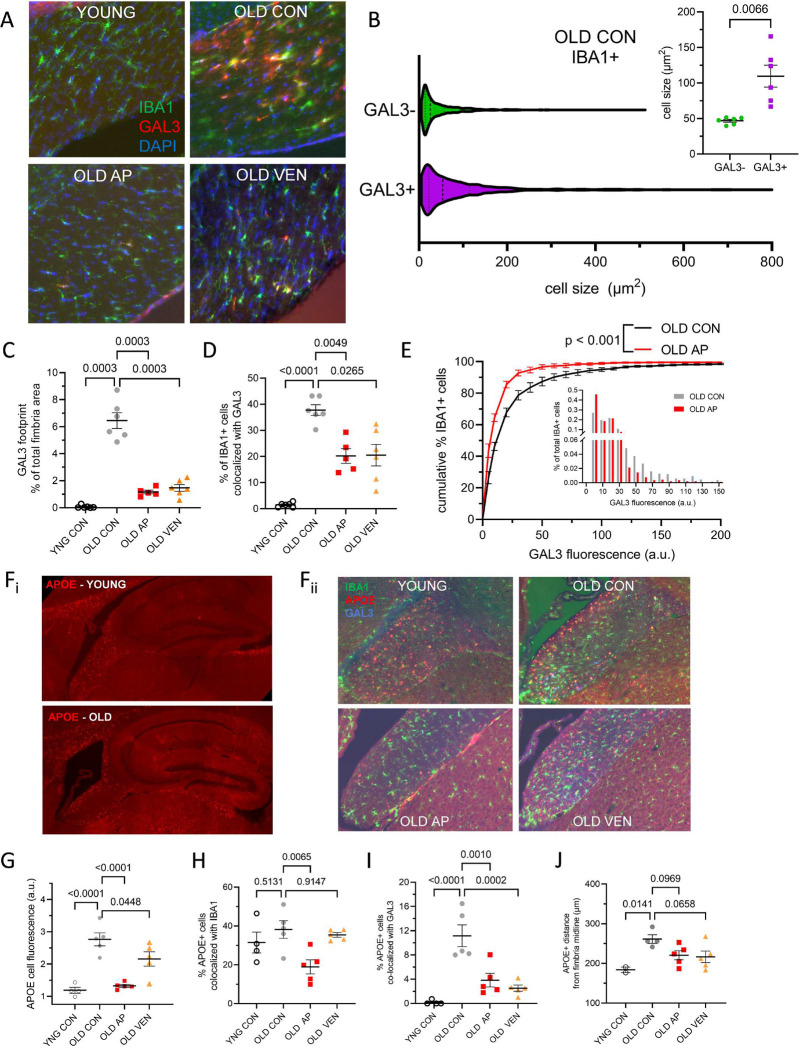
Brain white matter tracts undergo structural and functional changes linked to late-life cognitive decline, but the cellular and molecular contributions to their selective vulnerability are not well defined. In naturally aged mice, we demonstrate that senescent and disease-associated microglia (DAM) phenotypes converge in hippocampus-adjacent white matter. Through gold-standard gene expression and immunolabeling combined with high-dimensional spatial mapping, we identified microglial cell fates in aged white matter characterized by aberrant morphology, microenvironment reorganization, and expression of senescence and DAM markers, including galectin 3 (GAL3/Lgals3), B-cell lymphoma 2 (Bcl2), and cyclin dependent kinase inhibitors, including Cdkn2a/p16ink4a. Pharmacogenetic or pharmacological targeting of p16ink4a or BCL2 reduced white matter GAL3+ DAM abundance and rejuvenated microglial fimbria organization. Our results demonstrate dynamic changes in microglial identity in aged white matter that can be reverted by senotherapeutic intervention to promote homeostatic maintenance in the aged brain.

Keywords: aging; microglia; neuroinflammation; senotherapeutics; white matter.


Conflict of interest statement

CONFLICT OF INTEREST STATEMENT M.J.S., C.M.C., and Mayo Clinic have intellectual property related to this research. This research was reviewed by the Mayo Clinic Conflict of Interest Review Board and was conducted in compliance with Mayo Clinic Conflict of Interest policies. All other authors declare no conflicts.

Figures

Extended Data Figure 1.
Extended Data Figure 1.. GAL3 positive microglia accumulate in aged white matter.
(A) Immunoreactivity for GAL3 in hippocampus and adjacent white matter in young (left) and old (right) female mouse brains. (B, left) GAL3 (red) and IBA1 (green) immunoreactivity in an old mouse fimbria. (B, center) GAL3 (red) and GFAP (green) immunoreactivity in an old mouse fimbria. (B, right) GAL3 (red), IBA1 (green), and GFAP (blue) immunoreactivity in an old mouse fimbria, with DAPI nuclear stain in grey. (C) Representative magnified images of GAL3+ and IBA1+ cells from an old mouse fimbria, with DAPI nuclear stain in blue. (D-F) GAL3 and IBA1 immunoreactivity in (D) corpus callosum, (E) anterior commissure and (F) deep cerebellar nuclei fiber tracts of an old mouse.
Extended Data Figure 2.
Extended Data Figure 2.. CosMx transcript localization and single-cell cluster differentiation profiles for DAM and senescent microglia.
Related to figures 4 and 5: (A) Representative CosMx transcript localizations overlayed onto microglia cells for Apoe (red), Lgals3 (cyan), Hexb (green) from the section shown in Figure 4A. Outset panels show specific Apoe-concentrated localizations in white matter. (B) Representative CosMx image of Cdk2na (red), Lgals3 (cyan), Lyz1/2 (magenta), Plaur (yellow), and Spp1 (green) transcript localizations in microglia within white matter. Scale bar, 100 μm. (C) Single-cell heatmap of top highly-expressed genes across pooled microglia from four old brains shown in Figure 4H, organized by cluster identity A-G.
Extended Data Figure 3.
Extended Data Figure 3.. CosMx reveals conservation and heterogeneity of Lgals3+ single-cell gene expression profiles across aged brain samples.
Related to figure 4 and 5: Gene expression volcano plots derived from Lgals3-enriched microglial clusters separated by each mouse brain (A)ID#231, (B)ID#232, (C)ID#233, (D) ID#234. (E) Shown are representative Apoe (red), Lgals3 (cyan), and Hexb (green) CosMx transcript localizations in white matter microglia. Inset shows specific Apoe-concentrated localizations in fimbria. (F) Magnified outset of DAM and senescence transcripts expressed in fimbria microglia for Csf1r (yellow), Lgals3 (cyan), Lyz1/2 (red), Plaur (orange), Spp1 (green), and white (Tyrobp), from the section depicted in red in E.
Extended Data Figure 4.
Extended Data Figure 4.. CosMx reveals conservation and heterogeneity of Cdkn+ single-cell gene expression profiles across aged brain samples.
Related to figure 4 and 5: Transcript volcano plots derived from Cdkn2a-enriched microglia clusters are separated by each mouse brain (A)ID#231, (B)ID#232, (C)ID#233, (D)ID#234. (E) Transcript volcano plot from microglia pooled from four aged brains enriched for all cyclin-dependent kinase inhibitors, with the criteria of at least two or more transcripts detected within a cell. Transcript volcano plots from pooled microglia were parsed for cells enriched for (F) Cdkn1a, (G) Cdkn1b, and (H) Cdkn2d.
Extended Data Figure 5.
Extended Data Figure 5.. Top highly-expressed gene markers across pooled senescent and DAM-like microglia subclustered into AC-1, AC-2, AC-3, and AC-4.
Related to figure 5. Single-cell heatmap of top five differentially genes expressed in each AC subcluster as detected by Wilcoxon rank sum test.
Extended Data Figure 6.
Extended Data Figure 6.. Senotherapeutics modulate fimbria microglial identity and organization.
Related to figure 8: (A) Principal component analysis (PCA) of morphological features of aged IBA1+ cells that are classified by GAL3− (green circles) or GAL3+ (purple squares) immunoreactivity, as in Fig. 8B. Cells were categorized by GAL3 based on thresholding derived from young GAL3− microglia. (B) UMAP of GAL3-stratified immunofluorescence intensity of each cell, derived from PCA as shown in A. (C) GAL3 immunofluorescence signal as percentage of total fimbria area measured for female (pink) and male (blue) mice. (D) Cumulative distribution plot of IBA1+ cell populations according to each cell’s GAL3 immunofluorescence intensity from old vehicle-treated (OLD CON, grey) and old venetoclax-treated (OLD VEN, orange) groups. (E) Histogram depiction of the same GAL3 intensity data as in D. (F) Cell populations for each experimental group YNG CON, OLD CON, OLD AP, (OLD VEN) in quantification of APOE+ cell fluorescence, as in Figure 8F–G. n = 500 cells per group. *** p < 0.001 vs. OLD CON, one-way ANOVA with multiple comparisons. (G-H) Summarized mean distance of APOE+ cells to nearest edge of the fimbria (G) per mouse (n = 6–8 mice) and (H) per cell population (n = 863 – 1083 cells). p value denotes unpaired t-test of YNG vs. OLD. (I) Cumulative distribution plot of APOE+ cell populations distance to lateral ventricle edge. Inset shows violin plot of group data. (J) Summarized group populations of APOE+ cell distance from fimbria midline. *** p < 0.001 vs. OLD CON, one-way ANOVA with multiple comparisons. n = 1113 – 1759 cells. Bars represent mean ± S.E.M.
Figure 1.
Figure 1.. Senescent and disease-associated microglial gene expression increase in aged brain white matter.
(A-H) Summarized are RT-PCR relative expression (RE) values from old female (pink) and old male (blue) tissues of hippocampus white matter (HIP+WM, circles), hippocampus only (HIPP, squares), and white matter only (WM, triangles). Values are normalized relative to HIP expression per sex. Comparisons are shown for (A) p16ink4a, (B) Cdkn2a, (C) Lgals3, (D) Apoe, (E) Ccl2, (F) Ccl5, (G) Cdkn2a/p21, and (H) Gpr34. p values denote one-way ANOVA with multiple comparisons correction. (I) Shown are female RT-PCR expression from old hippocampus (OLD HIP, red circles) and old white matter (OLD WM, pink diamonds) normalized relative to expression of the same tissue from young females. (J) Shown are the male RT-PCR RE values from old hippocampus (OLD HIP, grey circles) and old white matter (OLD WM, blue diamonds) normalized relative to expression of the same tissue from young males. (I-J: Unpaired t-tests with FDR correction, *q < 0.05 vs. young tissue, n = 6–9 mice). (K) Shown are the log2 fold-changes in RT-PCR gene expression between young and old brain regions of HIP, hippocampus-adjacent WM, and cerebellum (CB) in female (F) and male (M) mice. (Statistics are published Extended Data Table 1, n = 5–8 mice). Bars represent mean ± S.E.M.
Figure 2.
Figure 2.. IMC reveals protein signatures of senescent and DAM are increased in aged fimbria.
(A) Representative reconstructed IMC in old female hippocampus (left) and fimbria with protein labels for IBA1 (green), CX3CR1 (yellow), GAL3 (magenta), CD38 (cyan), and UPAR (red), scale bars = 200 μm. (B) Summarized are background-subtracted protein values for IBA1/CX3CR1+ cells from the hippocampus and fimbria of old brains. (C) Summarized are background-subtracted protein values for fimbria-specific IBA1/CX3CR1+ cells stratified into GAL3− versus GAL3+. P-values denote unpaired t-tests with multiple comparisons correction. Bars represent mean ± S.E.M, n = 17–31 cells from 4 mice.
Figure 3.
Figure 3.. GeoMx digital spatial profiling demonstrates conserved DAM and novel genes increase in the aged fimbria.
(A) Representative immunostaining of sections from (Ai) fimbria and (Aii) hippocampus with labels for GAL3 (red), IBA1 (green), SYTO83 (blue), and GFAP (pink) in old mouse brain sections used for spatial profiling. Right panels show IBA1 staining alone in green. B) Volcano plot for genes in comparison of IBA1+ AOIs in hippocampus versus fimbria. Blue points indicate higher enrichment in hippocampus, red points indicate enrichment in fimbria (DESeq2, p < 0.05, n = 8–15 sections sampled from 5 mice). (C) Immunostaining and segmentation of fimbria for distinguishing IBA1+GAL3− and IBA1+GAL3+ cells. (D) Volcano plot for gene comparison of IBA1+GAL3− versus IBA1+GAL3+ cellular AOIs in old fimbria demonstrating Apoe is distinctly expressed in IBA+GAL3+ microglia (DESeq2, p < 0.05, n = 15 sections sampled from 5 mice).
Figure 4.
Figure 4.. CosMx spatial molecular imaging resolves diverse cell-specific DAM and senescent microglial identities in aged brain.
(A) Representative CosMx image of microglial centroid spatial localizations across hippocampus, cortex, thalamus, and white matter regions in a 24-month-old female mouse brain. (B) UMAP Leiden clustering of 790 microglia as represented spatially in A, separated into four clusters generally delineated as cluster 1: grey matter-resident microglia, and clusters 2–4: white matter-resident microglia. Clusters were created from 1000-plex gene features with no spatial information input as a factor. (C) Heatmap of the five top differentially expressed genes from clusters 1–4 as shown in B. (D) Heatmap panel of normalized DAM genes from clusters 1–4 as shown in B. (E) Heatmap panel of normalized senescence genes from clusters 1–4 as shown in B. Arrows indicate key senescence markers detected in cluster 4 microglia. (C-E) Color-values per heatmap cell represent normalized z-scores from Gini coefficient analysis, blue denotes lower and red denotes higher relative expression. (Fi, left) Overlay of polygonal cell segmentation of white matter fimbria microglia with CosMx transcript localizations Bcl2 (blue), Csf1r (yellow), Lgals3 (cyan), Lyz1/2 (red), Plaur (orange), Spp1 (green), and Tyrobp (white). (Fii, right) Representative transcript localizations for cyclin-dependent kinase inhibitors Cdkn1a/p21 (white), Cdkn1b/p27kip1 (purple), Cdkn1c/p57kip2 (blue), Cdkn2a/p16 (green), Cdkn2b/p15ink4b (yellow), Cdkn2c/p18ink4c (orange), Cdkn2d/p19 (red), and Lgals3 (cyan) in same section area as in the left panel. (Gi, left) Overlay of polygonal cell segmentation of white matter corpus callosum microglial localizations as in Fi. (Gii, right) Representative transcript localizations for cylcin-dependent kinase inhibitors as in Fii. (H) UMAP of pooled microglia from four old mouse brains, grouped by shape (denoting mouse ID of origin #231-234) and grouped by color (denoting Leiden cluster assignment). (I) Volcano plot of genes upregulated in Lgals3-enriched microglia (with 2 or greater Lgals3 transcript counts per cell), compared to microglia with 1 or no counts of Lgals3 per cell. (J) Feature plot mapped across pooled microglia as in H, for Apoe (red) and Lgals3 (green) and Lgals3 + Apoe (yellow). (K) Feature plot mapped across pooled microglia as in H for Spp1 (red) and Lgals3 + Spp1 (yellow). (L) Feature plot mapped across pooled microglia as in H for Lyz1/2 (red) and Lgals3 + Lyz1/2 (yellow). (M) Feature plot mapped across pooled microglia as in H for Bcl2 (red) and Lgals3 + Bcl2 (yellow). (N) Feature plot mapped across pooled microglia as in H for Cdkn2a (red) and Lgals3 + Cdkn2a (yellow). (O) Volcano plot of genes upregulated in Cdkn2a-enriched microglia (with 2 or greater Cdkn2a transcript counts per cell), compared to microglia with 1 or fewer count of Cdkn2a per cell.
Figure 5.
Figure 5.. Microglia harbor both convergent and heterogenous DAM and senescent gene profiles across different old brains.
(A) Pooled microglia UMAP as in Fig. 4H (also inset), selecting clusters A and C (red cells = cluster “AC”) for further subclustering based on high-density of DAM and senescence marker expression. (B) Cluster AC re-clustered by Leiden algorithm into subclusters AC-1, AC-2, AC-3, and AC-4 based on gene expression alone. (C-K) UMAP feature plots of Fig. 5B by normalized expression of single genes of interest (C) Lgals3, (D) Spp1, (E) Lyz1/2, (F) Ftl1, (G) Clec7a, (H) Trem2, (I) Plaur, (J) Csf1, and (K) Cdkn2a, showing highest concentration of DAM and senescence genes in subcluster AC1. (L) Percentage of cells with transcripts detected for each of the genes Lgals3 (cyan), Spp1 (green), and Cdkn2a (red) in each of the four subclusters AC-1, AC-2, AC-3, and AC-4, as in B. (M-N) Single-cell heatmaps of (M) DAM and (N) senescence genes of normalized and scaled data, organized by AC subclusters.
Figure 6.
Figure 6.. Senotherapeutics reduce senescence and DAM gene expression in aged white matter.
Summarized are (A, C-F) white matter (WM) and (B) hippocampal (HIP) gene expression values from female (pink) and male (blue) mice in comparison of young vehicle-treated (YNG CON, open circles), old vehicle-treated (OLD CON, closed circles), old AP20187-treated (OLD AP, closed squares), and old venetoclax-treated (OLD VEN, closed triangles) groups. Values are normalized relative to the expression of sex-matched YNG CON. (A-B) p16ink4a, (C) Lgals3, (D) Trem2, (E) Tmem173, (F) Tyrobp, gene expressions were quantified (one-way ANOVA, * p < 0.05, ** p < 0.01, *** p < 0.001: OLD CON vs. YNG CON; # p < 0.05 vs. OLD CON, n = 4–8 mice). Bars represent mean ± S.E.M.
Figure 7.
Figure 7.. Senotherapeutics alter white matter fimbria microglia density, morphology, and organization.
(A) Immunolabeling of IBA1 in fimbria of an old mouse sagittal brain section. Increased magnification of distal CA3 (middle panel) and fimbria (right panel); IBA1+ cells exhibit region-specific morphology. IBA1+ (green) and DAPI (blue) counterstains in fimbria demonstrate (B) young microglia with ramified processes and (C) old microglia exhibiting spindle-like or enlarged cell soma morphologies. (D) Summarized quantification of IBA1+ cell density (per mm2) in young vehicle-treated (YNG CON), old vehicle-treated (OLD CON), old AP20187 treated (OLD AP), and old venetoclax-treated (OLD VEN) fimbria. (E) Summarized quantification of IBA1+ cell size (μm2) in YNG CON, OLD CON, OLD AP, and OLD VEN fimbria (D-E, p values denote one-way ANOVA with multiple comparisons correction, n = 5–6 mice. Bars represent mean ± S.E.M). (F, top) Representative IBA1+ (green) and DAPI (blue) counterstain of fimbria and oligodendrocyte fiber tracts with computed angle of the fiber tract (red) and angle of longest feret axis of each IBA1+ cell. (F, bottom) Summarized histogram of measured angular offset of IBA1+ cells to oligodendrocyte fiber tracts from YNG, OLD, and AP20187-treated (AP) fimbria (p-value denotes Kolmogorov-Smirnov test vs. OLD, KSD(YNGvOLD) = 0.1686, KSD(APvOLD) = 0.1098). (G) Principal component analysis of morphological features of IBA1+ cells showing group-specific clustering of YNG, OLD CON, OLD AP, and OLD VEN fimbria. Each point represents one mouse.
Figure 8.
Figure 8.. GAL3+ and APOE+ microglia in the aged fimbria are sensitive to senotherapeutic modulation.
(A) Representative images of IBA1+ (green) and GAL3+ (red) cells co-stained with DAPI in the fimbria from young vehicle-treated (YNG CON), old vehicle-treated (OLD CON), old AP20187-treated (OLD AP), and old venetoclax-treated (OLD VEN) mice. (B) Violin plot of the cell size (μm2) of IBA1+GAL3− (n = 1034 cells) and IBA1+GAL3+ (n = 740 cells) cells from OLD CON female mouse fimbria. Dashed lines represent population quartiles. Inset shows direct quantification of mean cell size of GAL3− (green) and GAL3+ (purple) IBA1+ cells (paired t-test, mean ± SEM, n = 6 mice). (C) Summarized quantification of GAL3 immunoreactivity in fimbria as percentage of total fimbria area and (D) percentage of IBA1+ cells colocalized with GAL3, in female YNG CON (open circles), OLD CON (grey circles), OLD AP (red squares), and OLD VEN (orange triangles) groups (C-D, p values denote one-way ANOVA with multiple comparisons correction, n = 5–6 mice). (E) Cumulative distribution plot of IBA1+ cell populations according to each cell’s GAL3 immunofluorescence intensity from OLD CON (grey) and OLD AP (red) groups. Inset shows histogram depiction of the same data. p value denotes Kolmogorov-Smirnov test vs. OLD CON, KSD = 18.2, n = 6 mice per group. (Fi, left) Sagittal sections of hippocampus and adjacent white matter APOE immunofluorescent staining in representative young (top) and old (bottom) mice. (Fii, right) Representative immunofluorescence images for IBA1 (green), APOE (red), and GAL3 (blue) in experimental mice. (G) Summarized quantification of APOE+ cell fluorescence intensity per group. (H-I) Summarized quantification of percentage of APOE+ cells colocalized with (H) IBA1 or (I) GAL3. (J) Summarized quantification of distance between APOE+ cells and midline of fimbria in two spatial dimensions. p-values denote one-way ANOVA with multiple comparisons correction. n = 4–5 mice. Bars represent mean ± S.E.M.

References

    1. Papez JW. A proposed mechanism of emotion. 1937. J Neuropsychiatry Clin Neurosci 7, 103–112 (1995). - PubMed
    1. Fletcher E, et al. Loss of fornix white matter volume as a predictor of cognitive impairment in cognitively normal elderly individuals. JAMA Neurol 70, 1389–1395 (2013). - PMC - PubMed
    1. Liu H, et al. A voxel-based morphometric study of age- and sex-related changes in white matter volume in the normal aging brain. Neuropsychiatr Dis Treat 12, 453–465 (2016). - PMC - PubMed
    1. Vemuri P, et al. White matter abnormalities are key components of cerebrovascular disease impacting cognitive decline. Brain Commun 3, fcab076 (2021). - PMC - PubMed
    1. Korbmacher M, et al. Brain-wide associations between white matter and age highlight the role of fornix microstructure in brain ageing. Hum Brain Mapp 44, 4101–4119 (2023). - PMC - PubMed

Publication types

LinkOut - more resources