

This is a preprint.
MetaGate: Interactive Analysis of High-Dimensional Cytometry Data with Meta Data Integration
- PMID: 37961421
- PMCID: PMC10634916
- DOI: 10.1101/2023.10.27.564454
MetaGate: Interactive Analysis of High-Dimensional Cytometry Data with Meta Data Integration
Update in
-
MetaGate: Interactive analysis of high-dimensional cytometry data with metadata integration.Patterns (N Y). 2024 May 13;5(7):100989. doi: 10.1016/j.patter.2024.100989. eCollection 2024 Jul 12. Patterns (N Y). 2024. PMID: 39081571 Free PMC article.
Abstract
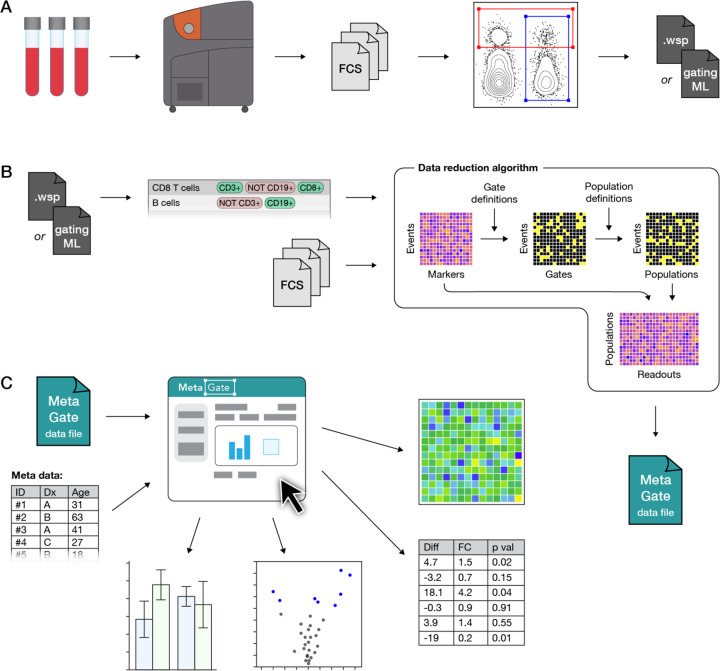
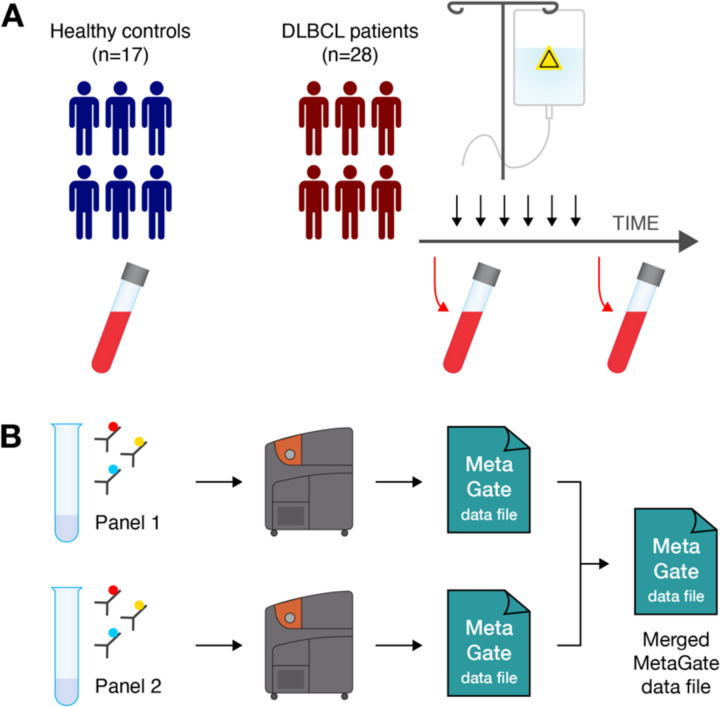
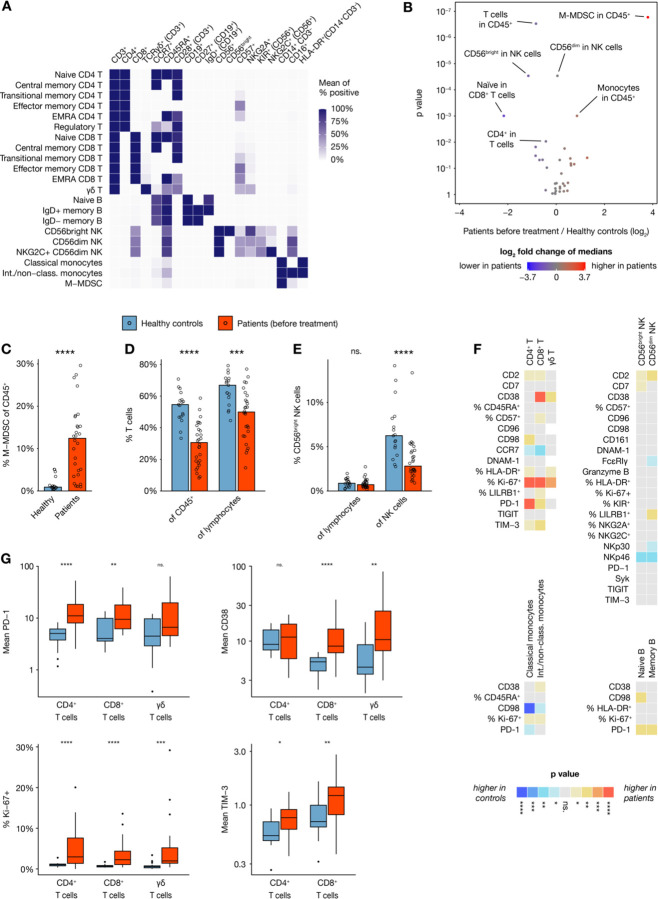
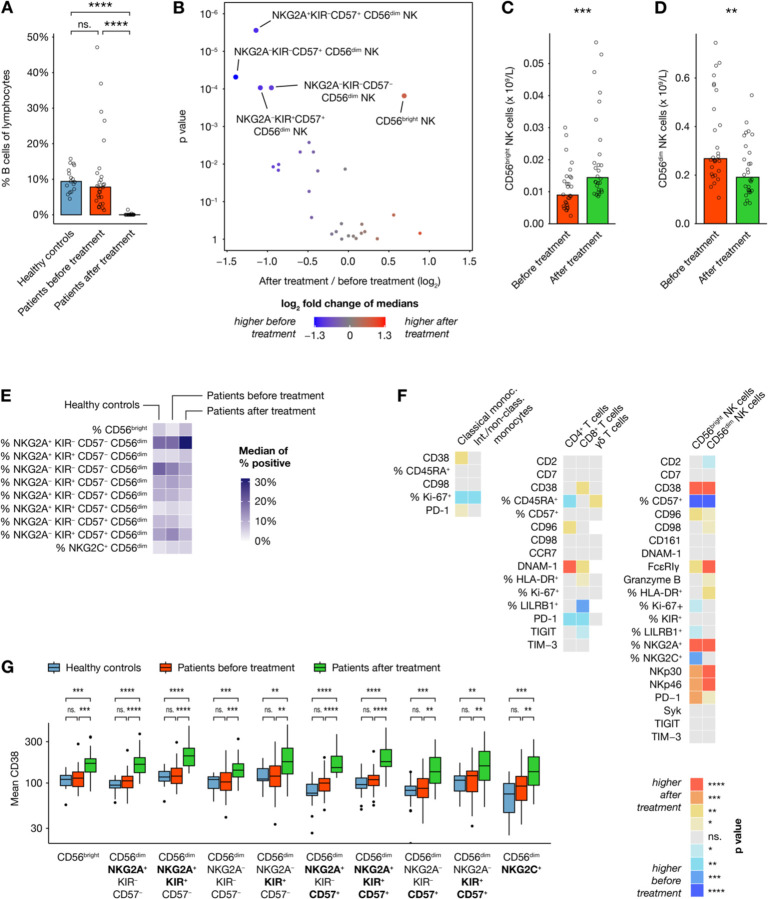
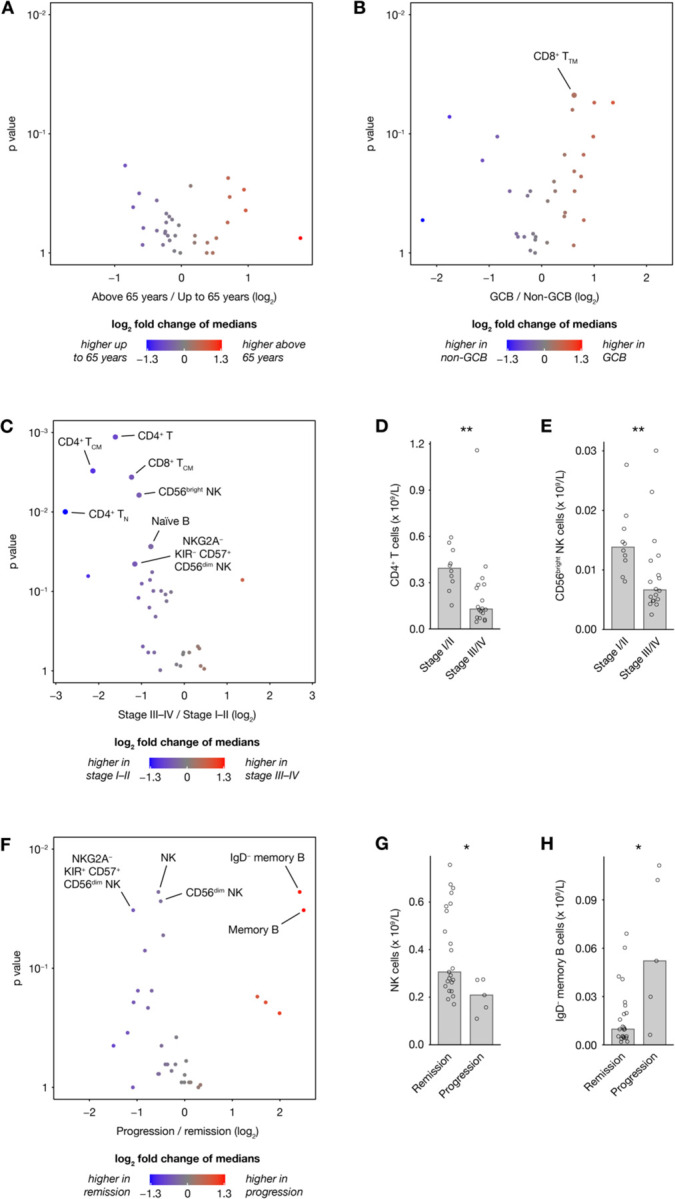
Flow cytometry is a powerful technology for high-throughput protein quantification at the single-cell level, widely used in basic research and routine clinical diagnostics. Traditionally, data analysis is carried out using manual gating, in which cut-offs are defined manually for each marker. Recent technical advances, including the introduction of mass cytometry, have increased the number of proteins that can be simultaneously assessed in each cell. To tackle the resulting escalation in data complexity, numerous new analysis algorithms have been developed. However, many of these show limitations in terms of providing statistical testing, data sharing, cross-experiment comparability integration with clinical data. We developed MetaGate as a platform for interactive statistical analysis and visualization of manually gated high-dimensional cytometry data with integration of clinical meta data. MetaGate allows manual gating to take place in traditional cytometry analysis software, while providing a combinatorial gating system for simple and transparent definition of biologically relevant cell populations. We demonstrate the utility of MetaGate through a comprehensive analysis of peripheral blood immune cells from 28 patients with diffuse large B-cell lymphoma (DLBCL) along with 17 age- and sex-matched healthy controls using two mass cytometry panels made of a total of 55 phenotypic markers. In a two-step process, raw data from 143 FCS files is first condensed through a data reduction algorithm and combined with information from manual gates, user-defined cellular populations and clinical meta data. This results in one single small project file containing all relevant information to allow rapid statistical calculation and visualization of any desired comparison, including box plots, heatmaps and volcano plots. Our detailed characterization of the peripheral blood immune cell repertoire in patients with DLBCL corroborate previous reports showing expansion of monocytic myeloid-derived suppressor cells, as well as an inverse correlation between NK cell numbers and disease progression.
Conflict of interest statement
Declaration of Interest K-J.M. is a consultant at Fate Therapeutics and Vycellix and has research support from Fate Therapeutics, Oncopeptides for studies unrelated to this work.
Figures
References
-
- Grant R, Coopman K, Medcalf N, Silva-Gomes S, Campbell JJ, Kara B, et al. Quantifying Operator Subjectivity within Flow Cytometry Data Analysis as a Source of Measurement Uncertainty and the Impact of Experience on Results. PDA J Pharm Sci Technol. 2021;75(1):33–47. - PubMed
-
- Cheung M, Campbell JJ, Whitby L, Thomas RJ, Braybrook J, Petzing J. Current trends in flow cytometry automated data analysis software. Cytometry A. 2021;99(10):1007–21. - PubMed
-
- Van der Maaten L, Hinton G. Visualizing data using t-SNE. Journal of machine learning research. 2008;9(11).
Publication types
Grants and funding
LinkOut - more resources
Full Text Sources