[Preprint]. 2023 Oct 28:2023.10.20.563340.
doi: 10.1101/2023.10.20.563340.

High-resolution CTCF footprinting reveals impact of chromatin state on cohesin extrusion dynamics

Affiliations

High-resolution CTCF footprinting reveals impact of chromatin state on cohesin extrusion dynamics

Corriene E Sept et al. bioRxiv. .

Update in

Abstract

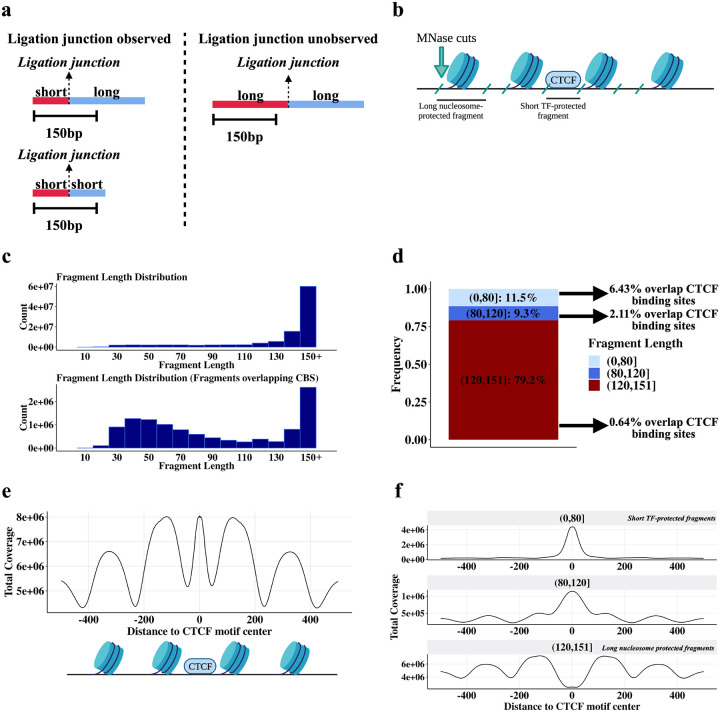
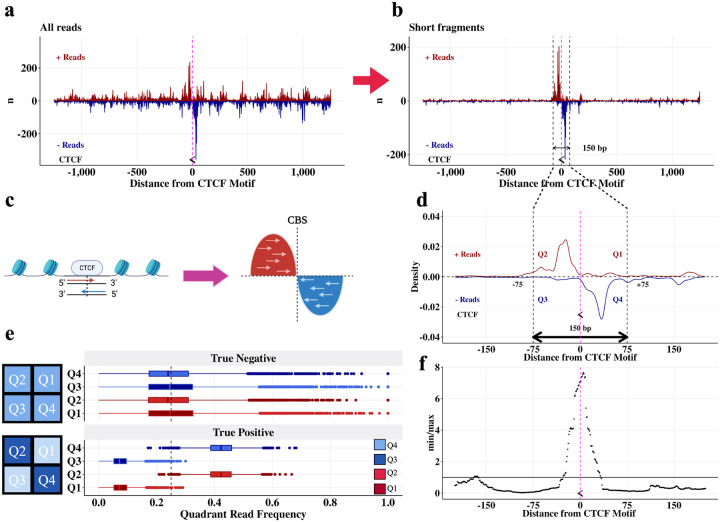
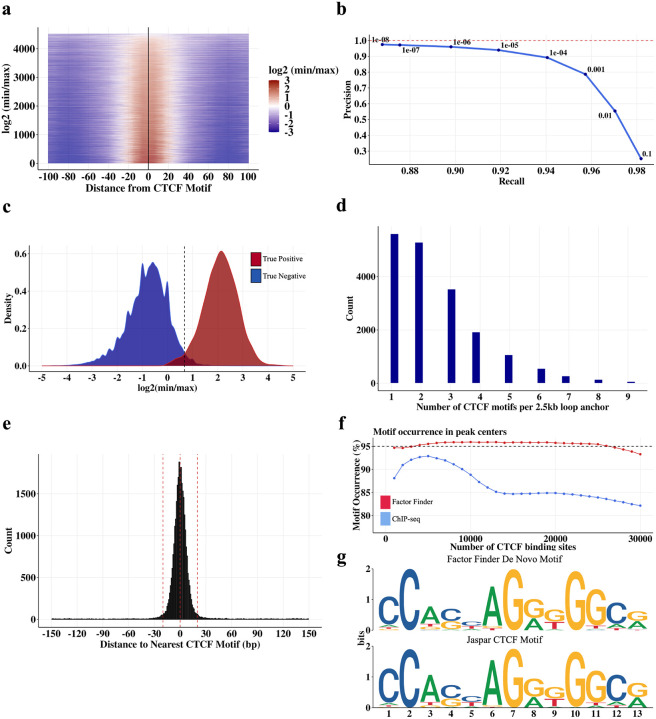
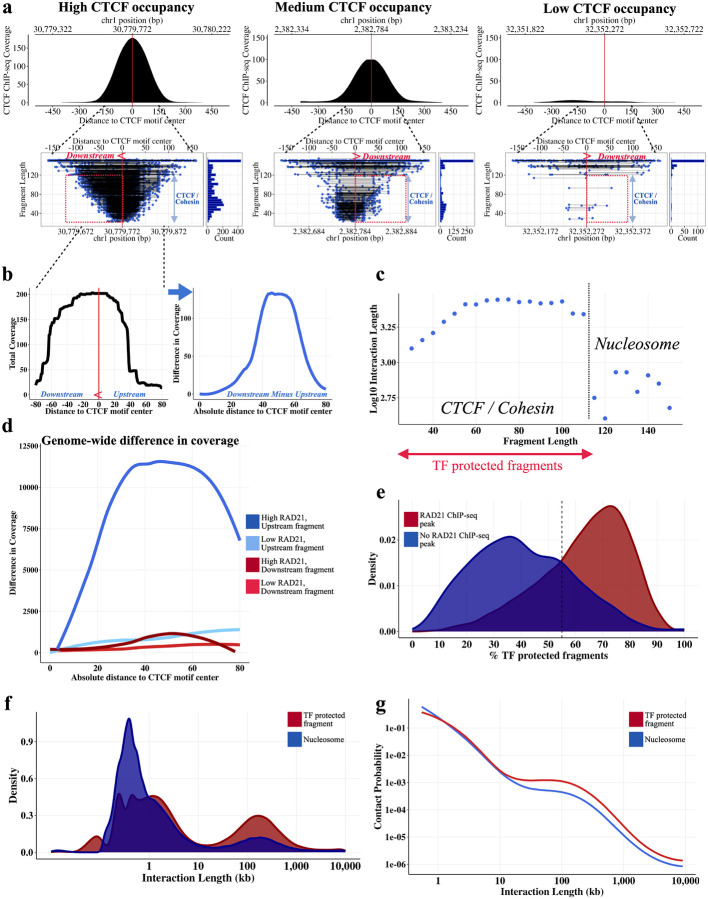
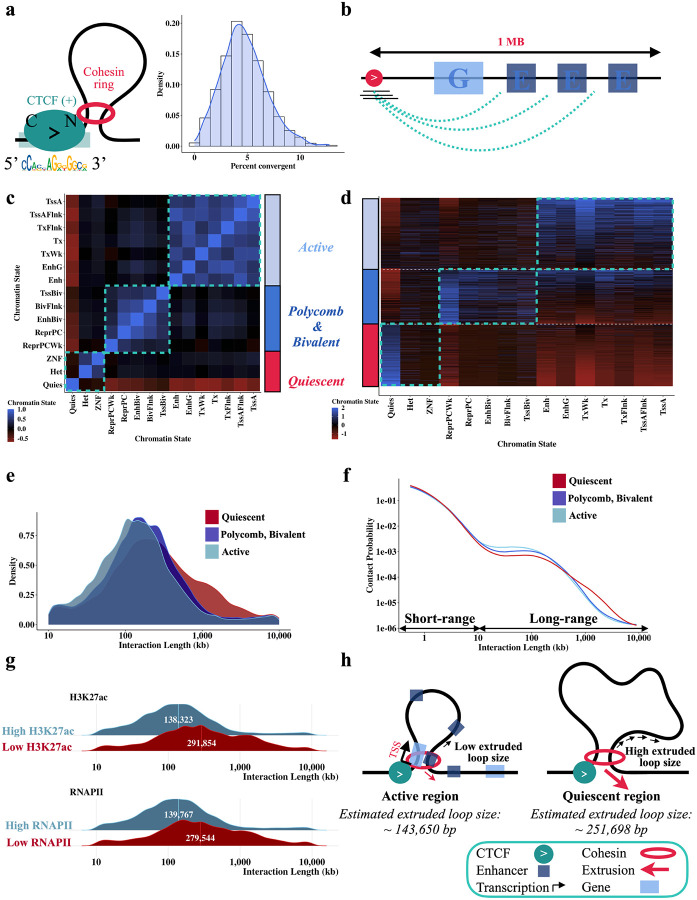
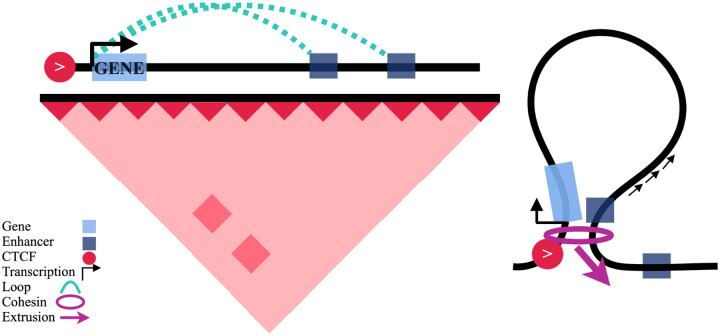
DNA looping is vital for establishing many enhancer-promoter interactions. While CTCF is known to anchor many cohesin-mediated loops, the looped chromatin fiber appears to predominantly exist in a poorly characterized actively extruding state. To better characterize extruding chromatin loop structures, we used CTCF MNase HiChIP data to determine both CTCF binding at high resolution and 3D contact information. Here we present FactorFinder, a tool that identifies CTCF binding sites at near base-pair resolution. We leverage this substantial advance in resolution to determine that the fully extruded (CTCF-CTCF) state is rare genome-wide with locus-specific variation from ~1-10%. We further investigate the impact of chromatin state on loop extrusion dynamics, and find that active enhancers and RNA Pol II impede cohesin extrusion, facilitating an enrichment of enhancer-promoter contacts in the partially extruded loop state. We propose a model of topological regulation whereby the transient, partially extruded states play active roles in transcription.


Conflict of interest statement

Disclosures Dovetail Genomics/Cantata Bio provided reagents and sample processing for HiChIP experiments. M.B. and M.S.B were employees at Dovetail Genomics during the course of this research. M.J.A has financial and consulting interests unrelated to this work in SeQure Dx and Chroma Medicine. M.J.A’s interests are reviewed and managed by Dana Farber Cancer Institute. J.K.J. is a co-founder of and has a financial interest in SeQure, Dx, Inc., a company developing technologies for gene editing target profiling. JKJ also has, or had during the course of this research, financial interests in several companies developing gene editing technology: Beam Therapeutics, Blink Therapeutics, Chroma Medicine, Editas Medicine, EpiLogic Therapeutics, Excelsior Genomics, Hera Biolabs, Monitor Biotechnologies, Nvelop Therapeutics (f/k/a ETx, Inc.), Pairwise Plants, Poseida Therapeutics, and Verve Therapeutics. J.K.J.’s interests were reviewed and are managed by Massachusetts General Hospital and Mass General Brigham in accordance with their conflict of interest policies.

Figures

Fig. 1
Fig. 1
MNase CTCF HiChIP data contains short (~ <80 bp) CTCF-protected fragments and longer (~ >120 bp) nucleosome-protected fragments. a Schematic illustrating relationship between short fragments and observed ligations. b Schematic illustrating how the fragment length results from MNase cutting around bound proteins of different sizes. c Fragment length distribution for all fragments (top plot) and fragments overlapping occupied CTCF motifs (lower plot). Occupied CTCF motifs are defined here as CTCF motifs within 30 bp of a CTCF ChIP-seq peak summit. d Boxplot quantifying the frequency of different fragment lengths genome-wide and how often each fragment length group overlaps an occupied CTCF motif. Occupied CTCF motifs are defined here as CTCF motifs within 30 bp of a CTCF ChIP-seq peak summit. e Fragment coverage metaplot +/− 500 bp around CTCF binding sites. Schematic below the coverage metaplot illustrates the proteins producing these peaks. f Plot (e) stratified by fragment length.
Fig. 2
Fig. 2
True CTCF binding sites have a bimodal strand-specific distribution centered on the CTCF motif. a Unfiltered reads +/− 1250 bp around a CTCF binding site located on the negative strand (chr1: 30,779,763 – 30,779,781). The midpoint of the CTCF motif is marked with the symbol “ < ”, representing that it is on the negative strand, and a pink line. b Plot (a) filtered to observed ligations (equivalently, short fragments.) c Schematic demonstrating the bimodal read pile-up around a CTCF binding site. d Plot (b) as a density plot and zoomed in on the CTCF motif, with quadrant annotations. e Distributions of reads in quadrants for true negative and true positive CTCF binding sites in DNA loop anchors. True positives are defined as CTCF motifs that are the only CTCF motif in a loop anchor and within 30 bp of a CTCF ChIP-seq peak. True negatives are areas of the loop anchors with one CTCF motif that are at least 200 bp from the CTCF motif. Schematics of the quadrant read pile-up patterns are shown next to the corresponding true positive and true negative boxplots. f FactorFinder statistic (α^=min(n2,n4)max(n1,n3)) for plot (d) peaks at the CTCF motif.
Fig. 3
Fig. 3
CTCF binding sites identified by FactorFinder with single basepair resolution in MNase K562 CTCF HiChIP data. a Heatmap of log2(min/max) as a function of distance between FactorFinder peak center and CTCF motif center within loop anchors. Only CTCF motifs that are unique within a loop anchor and within 30 bp of a CTCF ChIP-seq peak are used. b Precision recall curve for true negative and true positive CTCF binding sites in DNA loop anchors. True positives are defined as in (a). True negatives are areas of the loop anchors in (a) that are at least 200 bp from the one CTCF motif. Precision is calculated as TP / (TP + FP), recall is calculated as TP / (TP + FN). c FactorFinder statistic density plots using the same set of true positives and true negatives as (b). d Distribution of the number of CTCF motifs in a 2.5kb loop anchor. e Histogram with 1 bp bin size depicting FactorFinder resolution for all peaks genome-wide (not just in loop anchors). f Motif occurrence in ChIP-seq and FactorFinder peak centers genome-wide. Motif occurrence is calculated as % peak centers within 20 bp of CTCF motif. Only peak centers within 150 bp of a CTCF motif are used for this figure. g 30 bp sequences centered on genome-wide FactorFinder peak centers produce a de novo motif (top) that matches the core JASPAR CTCF motif (bottom).
Fig. 4
Fig. 4
Cohesin and CTCF-protected fragments identified in CTCF MNase HiChIP. a High, medium, and low CTCF occupied motifs. Cohesin footprint is observed downstream of the CBS for high and medium CTCF occupancy motifs. For each occupancy level, CTCF ChIP-seq (top) and all fragments overlapping the CTCF motif (bottom left) are depicted, along with the corresponding fragment length histogram (bottom right). b Locus-specific high CTCF occupancy figure from (a) as a coverage plot (left figure), difference in coverage between downstream and upstream coverage (right figure). c Plotting median log10 interaction length as a function of fragment length suggests presence of nucleosome vs TF-protected fragments. Only left fragments overlapping CTCF (+) motifs with start and end at least 15 bp from the CTCF motif were included in this graph to remove confounding by MNase cut site. Using this figure, we are approximating CTCF +/− cohesin-protected fragments as those with fragment length < 115, start and end at least 15 bp from the motif center. d Difference in coverage (downstream - upstream) across all CBS shows an increase in coverage downstream of the CTCF motif for upstream fragments underlying CBS with a strong adjacent RAD21 ChIP-seq peak. e CTCF motifs that have a nearby RAD21 ChIP-seq peak (within 50 bp) have a larger proportion of TF-protected fragments. f TF-protected fragments have a noticeably larger bump in density of long range interactions compared to nucleosome-protected fragments. Fragments were first filtered to those with start and end at least 15 bp from the motif. TF-protected fragments were then defined as fragments with length < 115 bp while nucleosome-protected fragments are fragments with length at least 115 bp. g P(S) curve for fragments depicted in (f).
Fig. 5
Fig. 5
Cohesin extrudes further through quiescent regions than active regions. a Most CTCF-mediated looping contacts do not reflect the fully extruded state. Estimate is obtained using left TF-protected (start and end at least 15 bp from motif center, length < 115) fragments that overlap FactorFinder identified CBS (+) and have an interaction length greater than 10kb. For each CBS with at least 50 long-range TF-protected fragments overlapping the motif, % convergent is calculated as the number of interaction partners overlapping CTCF (−) motifs / total number of fragments at motif. Because this estimate is conditional on CTCF binding at the anchor, we divide estimates by two to account for the ~50% occupancy of CTCF. b Depiction of how regions were annotated using ChromHMM. Correlation (c) and fragment (d) heatmaps for ChromHMM annotated unique 1 MB regions downstream of left fragments overlapping CTCF (+) binding sites. All other plots in this figure are filtered to TF-protected (fragment length < 115 bp, start and end at least 15 bp from motif center) fragments. Density (e) and P(S) curves (f) for chromatin state clusters shown in (c,d), filtered to the top 20%. Chromatin annotations making up each cluster are added together and quantiles are obtained to determine fragments in the top 20% of active chromatin, quiescent chromatin, and bivalent / polycomb chromatin. g Ridge plots for the bottom 10% quantile (“Low”) and top 10% quantile (“High”) of H3K27ac bp and number of RNAPII binding sites. ChIP-seq from ENCODE was used to annotate 1 MB downstream of left fragments overlapping CBS (+) for this figure. h Diagram illustrating differences in extrusion rates between active and quiescent chromatin states, with numbers obtained from Supp Fig. 3.
Fig. 6
Fig. 6
Schematic of proposed model whereby single promoter-proximal CTCF sites enable an enrichment of enhancer-promoter contacts.

References

    1. Fudenberg G. et al. Formation of Chromosomal Domains by Loop Extrusion. Cell Rep. 15, 2038–2049 (2016). - PMC - PubMed
    1. Li Y. et al. The structural basis for cohesin–CTCF-anchored loops. Nature 578, 472–476 (2020). - PMC - PubMed
    1. Xiao J. Y., Hafner A. & Boettiger A. N. How subtle changes in 3D structure can create large changes in transcription. eLife 10, e64320. - PMC - PubMed
    1. Zuin J. et al. Nonlinear control of transcription through enhancer–promoter interactions. Nature 604, 571–577 (2022). - PMC - PubMed
    1. Lupiáñez D. G. et al. Disruptions of Topological Chromatin Domains Cause Pathogenic Rewiring of Gene-Enhancer Interactions. Cell 161, 1012–1025 (2015). - PMC - PubMed

Publication types