[Preprint]. 2024 Jun 25:2023.10.30.564733.
doi: 10.1101/2023.10.30.564733.

FlyVISTA, an Integrated Machine Learning Platform for Deep Phenotyping of Sleep in Drosophila

Affiliations

FlyVISTA, an Integrated Machine Learning Platform for Deep Phenotyping of Sleep in Drosophila

Mehmet F Keleş et al. bioRxiv. .

Update in

Abstract

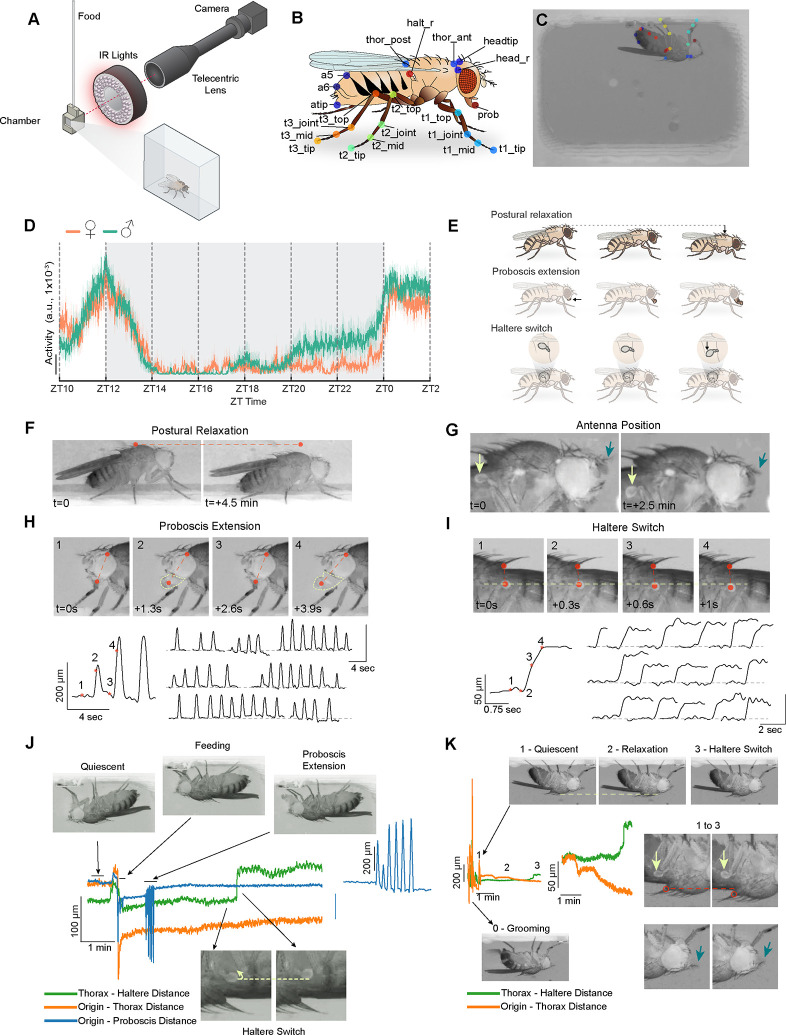
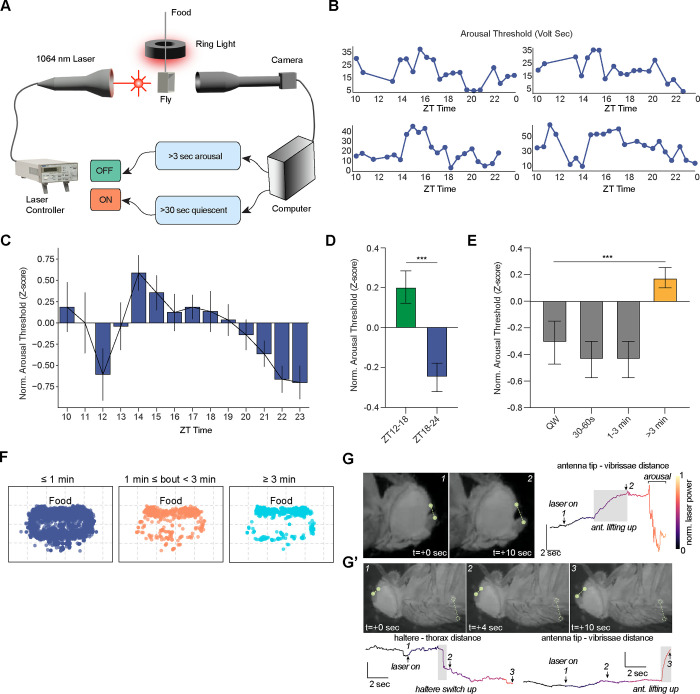
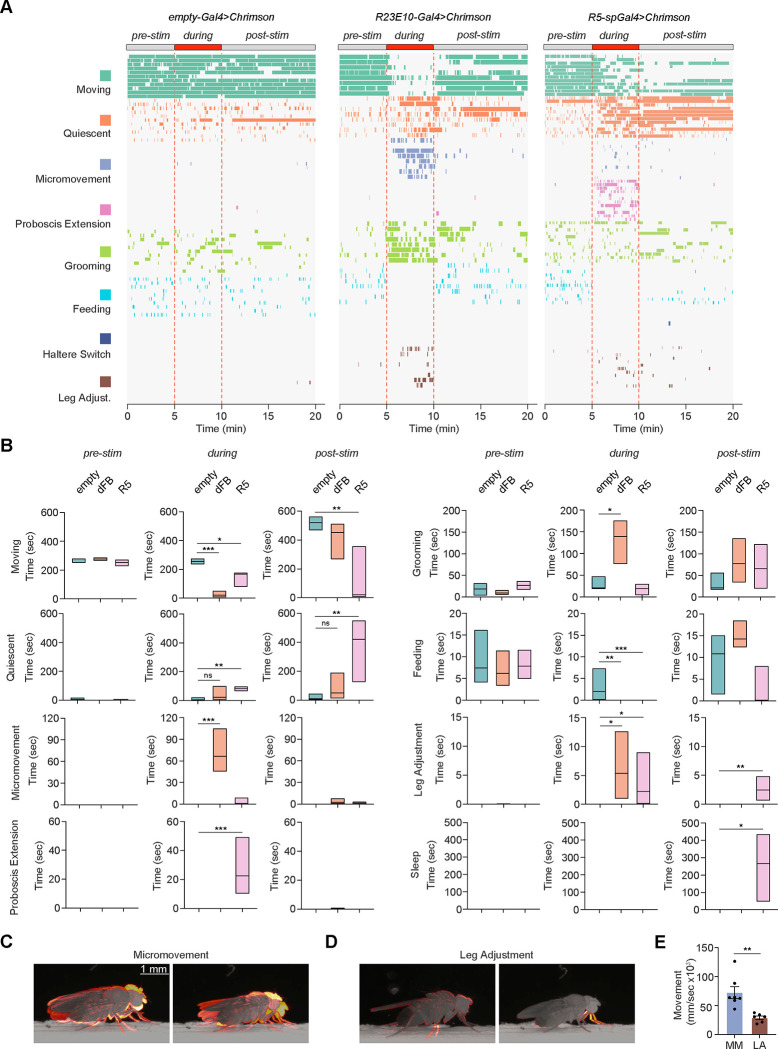
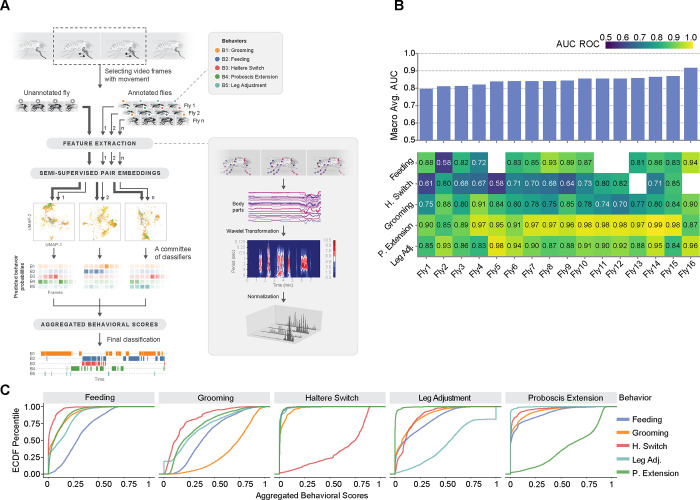
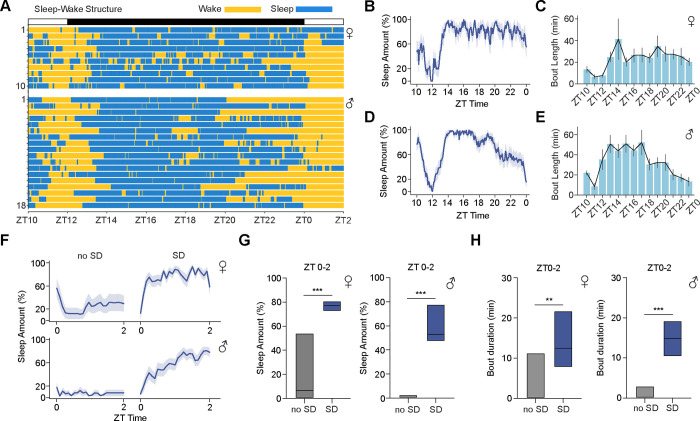
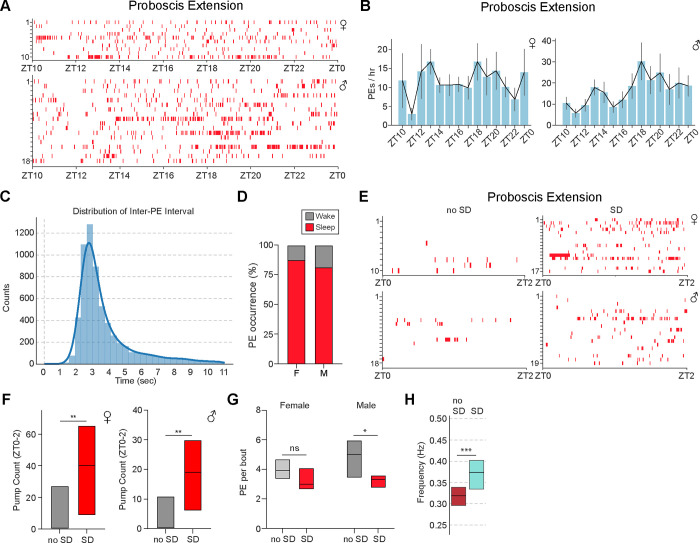
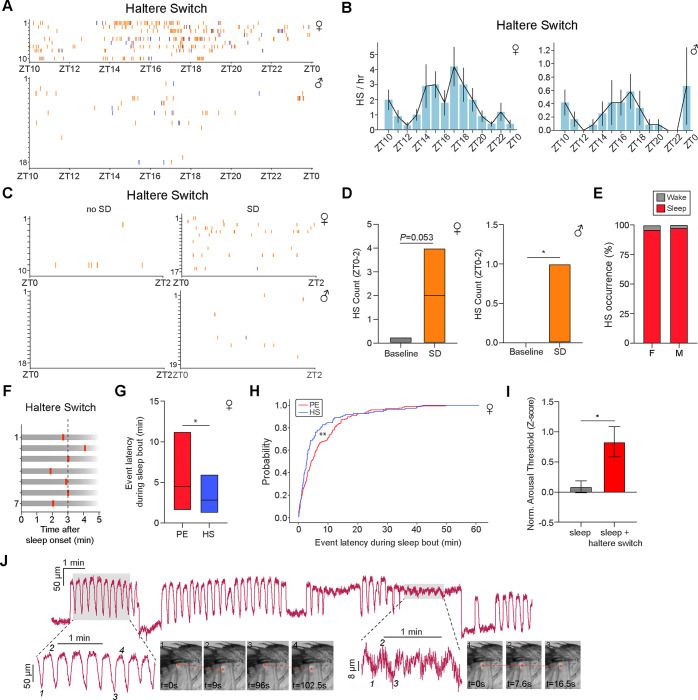
Animal behavior depends on internal state. While subtle movements can signify significant changes in internal state, computational methods for analyzing these "microbehaviors" are lacking. Here, we present FlyVISTA, a machine-learning platform to characterize microbehaviors in freely-moving flies, which we use to perform deep phenotyping of sleep. This platform comprises a high-resolution closed-loop video imaging system, coupled with a deep-learning network to annotate 35 body parts, and a computational pipeline to extract behaviors from high-dimensional data. FlyVISTA reveals the distinct spatiotemporal dynamics of sleep-associated microbehaviors in flies. We further show that stimulation of dorsal fan-shaped body neurons induces micromovements, not sleep, whereas activating R5 ring neurons triggers rhythmic proboscis extension followed by persistent sleep. Importantly, we identify a novel microbehavior ("haltere switch") exclusively seen during quiescence that indicates a deeper sleep stage. These findings enable the rigorous analysis of sleep in Drosophila and set the stage for computational analyses of microbehaviors.


Conflict of interest statement

Competing interests The authors declare that they have no competing interests.

Figures

Fig. 1.
Fig. 1.. A high-resolution method to investigate quiescent behaviors in flies.
(A) Schematic of the behavioral setup in which a fly is placed in a 7.1 (W) × 4.9 (H) × 2.8 mm (D) 3D-printed chamber with access to a liquid food capillary and imaged at high-resolution (~8 μm / pixel). (B) Schematic of a fly displaying the target points tracked using DeepLabCut. 21 distinct points (35 in total when including symmetric body parts) are shown. (C) An example image showing a fly in the behavioral chamber with tracked body parts. (D) Average activity data (a.u.) per 1 min bins for male (n=23, green) and female (n=19, orange) flies from ZT10 to ZT2. Activity is based on the sum of the change in each frame for computed features derived from tracked body parts (see Methods). (E) Schematic illustrating microbehaviors seen during sleep. (F) Representative images showing the progressive lowering of the thorax position (postural relaxation) during prolonged quiescence. Dashed line connects the same pixel point across the two images. (G) Representative images showing downward movement of the antenna during prolonged quiescence (blue arrow). Light green arrow shows an accompanying change in haltere position. (H) Proboscis extension (PE) behavior is shown in 4 consecutive images (above). Red dashed line connects two points tracked by DeepLabCut: the tip of the proboscis and the dorsal edge of the eye. Bottom left: plot showing distance between the two tracked points across time; numbers/asterisks labeled on the plot correspond to the images shown. Bottom right: multiple examples of PE bouts are shown across the night. Plots show the distance between the two tracked points. (I) Representative images showing movement of haltere in the ventral direction during prolonged quiescence. Vertical dashed line connects the tracked points on the thorax and haltere, and horizontal dashed line indicate the same pixel points across the four images. Bottom left: plot showing distance between the 2 tracked points across time; numbers/asterisks labeled on the plot correspond to the images shown. Bottom right: multiple examples of HS behavior, shown as plots of the distance between thorax and haltere points across time. Time relative to the first image (t) is shown for (F-I). (J and K) Representative quiescence bouts exhibiting distinct behaviors with varying spatiotemporal structure. Static images of quiescence, feeding, PE, and HS (J) and grooming, quiescence, postural relaxation, and HS (K) are shown, with horizontal dashed lines connecting the same pixel points across images. Green, orange, and blue lines indicate the distance between thorax and haltere, origin (fixed point at 0, 0) and thorax, and origin and proboscis tip, respectively. Expanded traces for PE (J) and HS (K) are also shown to highlight spatiotemporal structure. In (K), yellow arrows point to halteres, magenta arrows point to antenna, and red circles indicate thorax.
Fig. 2.
Fig. 2.. Closed-loop analyses reveal dynamic changes of arousal threshold across time
(A) Schematic of the closed-loop setup to test arousal threshold where a fly in chamber is placed between an IR laser and a camera. The laser is turned on after 30 sec of quiescence, and laser voltage is gradually increased over the subsequent 30 sec (fig. S2A). Once the fly exhibits 3 sec of persistent movement, the laser is turned off. (B) Representative plots of arousal thresholds (volt-sec) for individual female flies from four different experiments across ZT time. (C) Normalized arousal thresholds (Z-score) for individual perturbation bouts plotted in 60 min bins across ZT10-ZT23, showing dynamic changes of arousal threshold across time for female flies (n=16). Arousal thresholds for each fly were normalized to the mean arousal threshold for that individual fly. Error represents SEM. (D) Normalized arousal threshold plotted for female flies during ZT12–18 or ZT18–24 windows. Data were obtained from the same flies in (C). Error denotes SEM; unpaired t-test. ***, P<0.001. (E) Normalized arousal thresholds for female flies for quiet wakefulness/QW (30 sec period of locomotor inactivity prior to “laser on” accompanied by an awake “microbehavior,” i.e. feeding, grooming, defecation) (n=41 bouts), 30–60 sec quiescence prior to “laser on” (n=27 bouts), 1–3 min quiescence prior to “laser on” (n=27 bouts), or >3 min quiescence prior to “laser on” (n=137 bouts). Error denotes SEM; one-way ANOVA with post-hoc Tukey. ***, P<0.001. (F) Plots showing location of the thorax for quiescence bouts separated according to whether bouts were <1 min (blue), between 1–3 min (orange), or e3 min (teal). Flies spent >1 min quiescent bouts near food (n=22 flies, data are pooled from males and females). (G) Representative static images of changes in sleep-associated microbehaviors as laser power is increased. Top panels show antennal movement during the laser ramp-up. Representative images (top left) from time points marked on the time series data (top right). Time series data show the change in the antenna-vibrissae distance (points are shown in the top left panels) as the laser power is increased. (G’) Upper panels show representative static images of a HS “up” event followed by an antennal upward movement. Time series data of haltere-thorax and antenna tip-vibrissae distances are shown in lower panels, where the numbers correspond to the static images. Shaded boxes denote HS “up” and antenna “up” events. Color indicates the change in the laser power.
Fig 3.
Fig 3.. Optogenetic activation of putative sleep circuits promotes distinct microbehaviors
(A) Distributions of 8 distinct behaviors (moving, teal; quiescent, defined by absence of any observable movement, orange; micromovement, vertical thoracic movements with jerky leg movements, purple; PE, pink; grooming, green; feeding, crystal teal; HS, blue; and leg adjustment, brown) before, during, and after 5 min optogenetic stimulation (1 Hz) for control (empty-Gal4, n=11), dFB (R23E10-Gal4, n=8), and R5-splitGal4 (R58H05-AD, R46C03-DBD, n=12) male and female flies expressing CsChrimson at ZT3–9. (B) Duration of time spent in moving, quiescent, micromovement, PE, grooming, feeding, leg adjustment, and sleep states before (pre-stim), during (during), or after (post-stim) optogenetic stimulation for empty-Gal4>UAS-CsChrimson (empty, teal), R23E10-Gal4>UAS-CsChrimson (dFB, orange), and R58H05-AD, R46C03-DBD (R5, pink) flies. Kruskall-Wallis with post-hoc Dunn’s and Bonferroni correction. ns, not significant, *, P<0.05, **, P<0.01, and ***, P<0.001. (C and D) Motion heatmaps of 1 sec movement of the indicated behaviors. (E) Average movement of the tracked centroid per behavior (micromovement, purple; leg adjustment, brown). Unpaired t-test; **, P<0.01.
Fig. 4.
Fig. 4.. A semi-supervised computational pipeline to analyze sleep-associated microbehaviors in Drosophila
(A) Illustration of the main stages of the pipeline. To perform behavioral analysis, our pipeline starts by extracting meaningful spatiotemporal features from the body part positions, followed by a wavelet transformation and L1 normalization. Then, micro-activity detection is performed to distinguish quiescence and behaviors of interests using a random forest of decision trees. After that, semi-supervised embeddings of the time points detected as micro-activity are computed for each annotated and unannotated fly experiments separately. Finally, a committee of annotated fly experiments predicts behavior scores by performing a joint nearest neighbor analysis on the embedding spaces. The output of the pipeline is a distribution of scores for behavioral categories, per video frame. (B) Performance summary of behavior mapping with the area under curve (AUC) scores of receiver operating characteristic (ROC) for 16 experiments. (Below) Each column of the heatmap corresponds to a leave-one-out experiment, and each value measures the AUC of ROC curves for different behavior categories. (Above) bar-plots aggregate AUC values as a macro average. Absent behavior categories are left blank for some experiments. (C) Empirical cumulative distribution function plots of aggregated behavioral scores of each behavioral category (PE, green; HS, red; leg adjustment, teal; feeding, blue; and grooming, orange) in all leave-one-out experiments combined. Each plot demonstrates the aggregated behavior score distributions of all the time points with the corresponding true annotation. These distributions reveal the predictive power of the scores, especially for PE, HS, and grooming.
Fig. 5.
Fig. 5.. Quantification of sleep behavior using FlyVISTA
(A) Distribution of wake (yellow) and sleep (blue) bouts plotted for female and male flies for the ZT times shown. (B and C) % sleep in 5 min bins (B) and sleep bout duration in 30 min bins (C) from ZT10 to ZT0 for female (n=10) flies. Shading and error denote SEM. (D and E) % sleep in 5 min bins (D) and sleep bout duration in 30 min bins (E) from ZT10 to ZT0 for male (n=18) flies. Shading and error denote SEM. (F) % sleep from ZT0 to ZT2 in 5 min bins in the presence (SD) or absence (no SD) of 12 hr SD from ZT12-ZT24 for female (top, n=10 for no SD and 17 for SD) and male (bottom, n=18 for no SD and 19 for SD) flies. Shading denotes SEM. (G and H) Simplified box plots showing % sleep amount (G) or sleep bout duration (H) from ZT0 to ZT2 in the presence (SD) or absence (no SD) of 12 hr SD from ZT12-ZT24 for the female (left) and male (right) flies in (A). Simplified box plots denote 75th, median, and 25th percentiles. Mann-Whitney U tests; **, P < 0.01 and ***, P < 0.001.
Fig. 6.
Fig. 6.. Characterization of proboscis extension behavior
(A) Distribution of PE events across the night. Individual PE events (red) plotted for each individual female (upper panel) and male (lower panel) fly from ZT10 to ZT0. Data are from the same flies as in Fig. 5A–5E. (B) PE/hr from ZT10 to ZT0 for the female (left) and male (right) flies in (A). Error denotes SEM. (C) Histogram showing distribution of inter-PE intervals, with a peak near 3 sec. (D) Stacked bar plot showing proportion of PE events occurring during wakefulness (gray) or sleep (red) for female (F) and male (M) flies. (E) Distribution of PE events (red) from ZT0-ZT2 in the presence (SD) or absence of 12 hr SD (no SD). Individual PE events plotted for each individual female (upper panel) and male (lower panel). Data are from the same flies as in Fig. 5F–5H. (F) Simplified box plots showing PE count from ZT0 to ZT2 in the presence (SD) or absence (no SD) of 12 hr SD for the female (left) and male (right) flies in (E). Mann Whitney U-test; **, P < 0.01. (G) Simplified box plots showing the number of PEs per bout in the presence (SD, red) or absence (no SD, gray) of 12 hr SD from ZT12–24 for female (n=10 and 17 for no SD and SD) and male flies (n=18 and 19 for no SD and SD). Mann Whitney U-test; ns, not significant and *, P<0.05. (H) Simplified box plot showing frequency of PE per bout in the absence (gray, no SD, ZT10-ZT2, n=28) vs presence (red, SD, ZT0-ZT6, n=36) of 12 hr SD from ZT12-ZT24. Data are pooled data from males and females. Top and bottom of the boxes represent 75th and 25th percentiles, and middle line represents median. Mann Whitney U test; ***, P < 0.001.
Fig. 7.
Fig. 7.. Haltere switch behavior identifies a deeper sleep state in Drosophila
(A) Distribution of HS events across the night. Individual HS plotted (orange ticks for “haltere down/ventral” and blue ticks for “haltere up/dorsal”) for each individual female (upper panel, red) and male (lower panel, blue) fly from ZT10 to ZT0. Data are from the same flies as in Figs. 5A–5E. (B) HS/hr from ZT10 to ZT0 for the female (left) and male (right) flies in (A). Only HS “down” events are plotted. Error denotes SEM. (C) Distribution of HS events from ZT0-ZT2 in the presence (SD) or absence of 12 hr SD. Individual HS events (orange ticks for “haltere down/ventral” and blue ticks for “haltere up/dorsal”) plotted for each individual female (upper panel) and male (lower panel). Data are from the same flies as in Figs. 5F–5H. (D) Simplified box plots showing HS count from ZT0 to ZT2 in the presence (SD) or absence (no SD) of 12 hr SD for the female (left) and male (right) flies in (C). Simplified box plots denote 75th, median, and 25th percentiles. Mann Whitney U-test; *, P < 0.05. (E) Stacked bar plot showing proportion of HS (down) events occurring during wakefulness (gray) or sleep (red) for female (F) and male (M) flies. (F) Representative examples of HS timing relative to the onset of a sleep bout. (G) Simplified box plot (75th percentile, median, 25th percentile) showing latency of PE or HS events relative to the onset of a sleep bout in female flies. Mann Whitney U-test; *, P<0.05. (H) Cumulative distribution function plot for PE (red) and HS (blue) probability vs latency within a sleep bout. Kolmogorov-Smirnov test; **, P<0.01. Data in (F-H) are from the same flies as in Figs. 5A–5E. (I) Normalized arousal threshold for female flies identified as sleeping (e3 min quiescence starting from “laser on”) in the absence (n=93) or presence (n=11) of HS behavior. Error denotes SEM, unpaired t-test; *, P < 0.05. (J) Haltere oscillations of different amplitudes across a sleep bout. Time series data show distance between tracked points in the haltere and scutellum. Shaded areas represent the enlarged time traces (below) with the accompanying representative images on the right. Smaller amplitude oscillations are shown on the right with the tracked haltere points denoted on the representative images.

References

    1. Flavell S. W., Gogolla N., Lovett-Barron M., Zelikowsky M., The emergence and influence of internal states. Neuron 110, 2545–2570 (2022). - PMC - PubMed
    1. Anderson D. J., Perona P., Toward a science of computational ethology. Neuron 84, 18–31 (2014). - PubMed
    1. Egnor S. E. R., Branson K., Computational Analysis of Behavior. Annu. Rev. Neurosci. 39, 217–236 (2016). - PubMed
    1. Datta S. R., Anderson D. J., Branson K., Perona P., Leifer A., Computational Neuroethology: A Call to Action. Neuron 104, 11–24 (2019). - PMC - PubMed
    1. Pereira T. D., Shaevitz J. W., Murthy M., Quantifying behavior to understand the brain. Nat. Neurosci., 1–13 (2020). - PMC - PubMed

Publication types