[Preprint]. 2023 Oct 26:2023.10.24.563814.
doi: 10.1101/2023.10.24.563814.

Cell-type-resolved somatic mosaicism reveals clonal dynamics of the human forebrain

Affiliations

Cell-type-resolved somatic mosaicism reveals clonal dynamics of the human forebrain

Changuk Chung et al. bioRxiv. .

Update in

  • Cell-type-resolved mosaicism reveals clonal dynamics of the human forebrain.
    Chung C, Yang X, Hevner RF, Kennedy K, Vong KI, Liu Y, Patel A, Nedunuri R, Barton ST, Noel G, Barrows C, Stanley V, Mittal S, Breuss MW, Schlachetzki JCM, Kingsmore SF, Gleeson JG. Chung C, et al. Nature. 2024 May;629(8011):384-392. doi: 10.1038/s41586-024-07292-5. Epub 2024 Apr 10. Nature. 2024. PMID: 38600385 Free PMC article.

Abstract

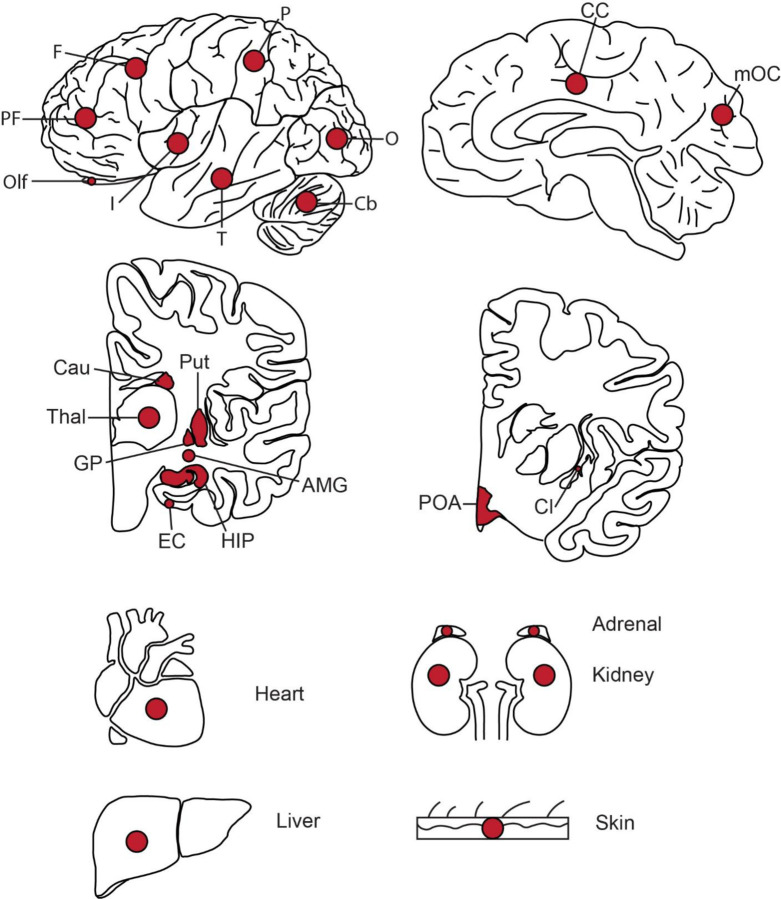
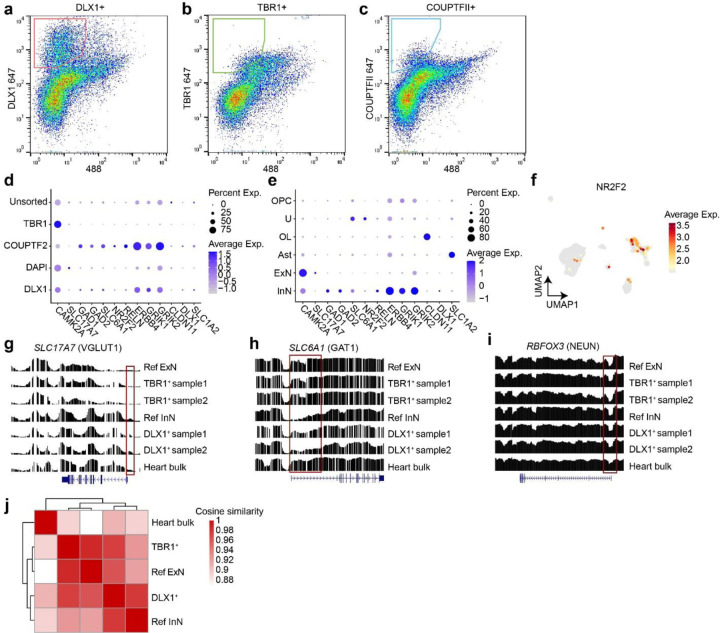
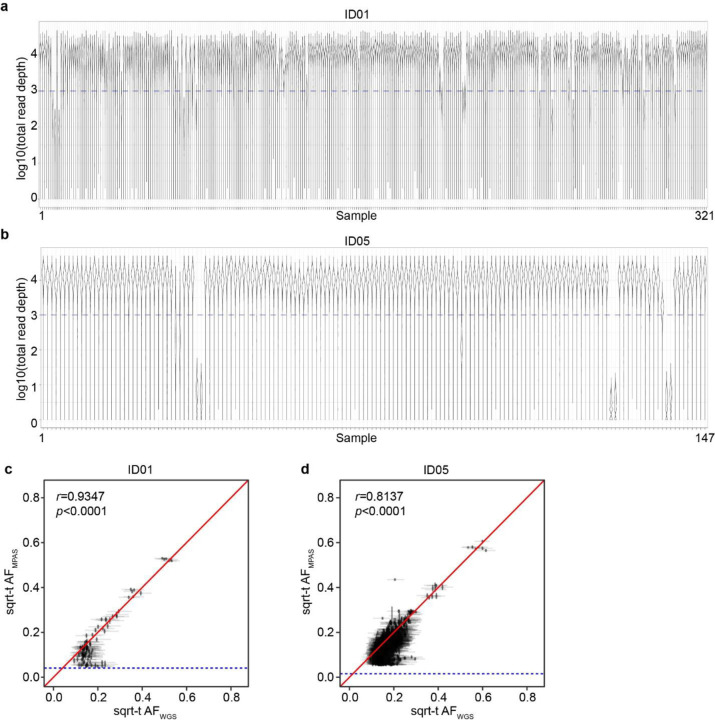
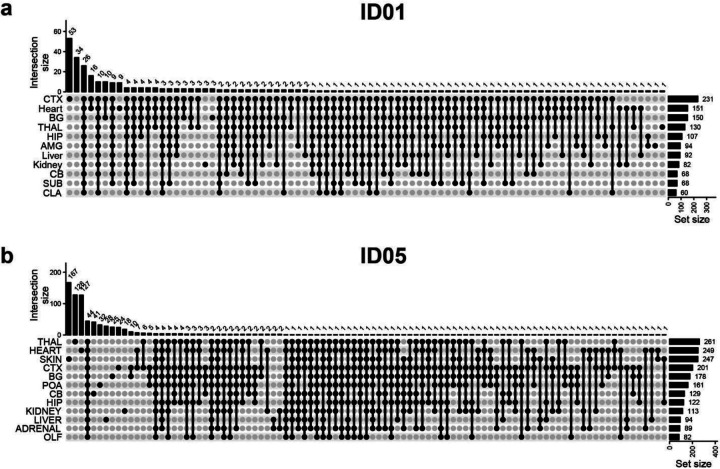
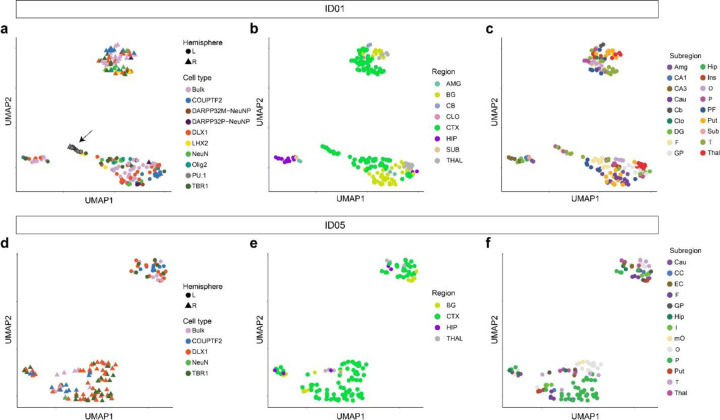
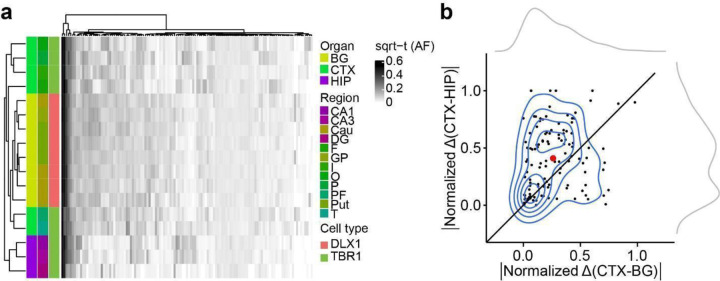
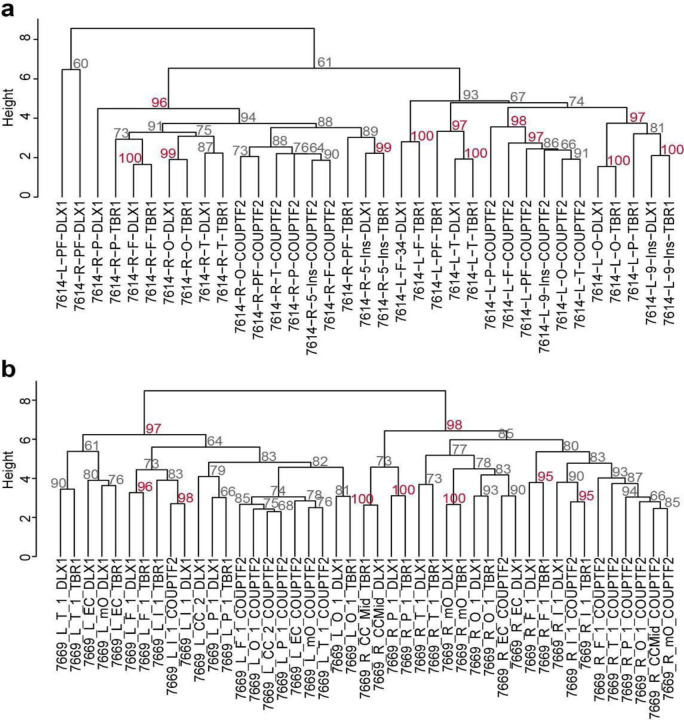
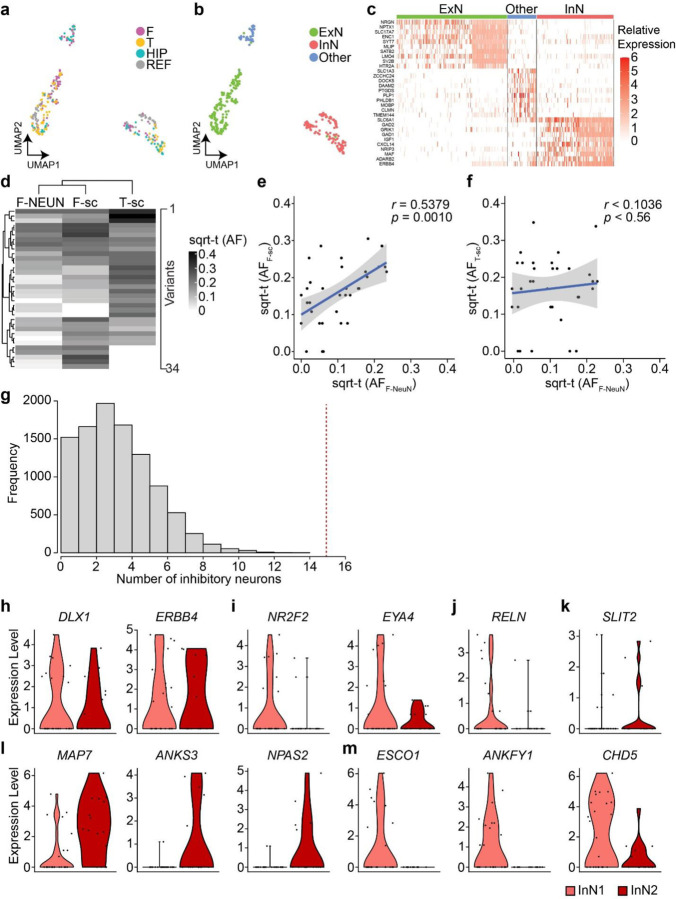
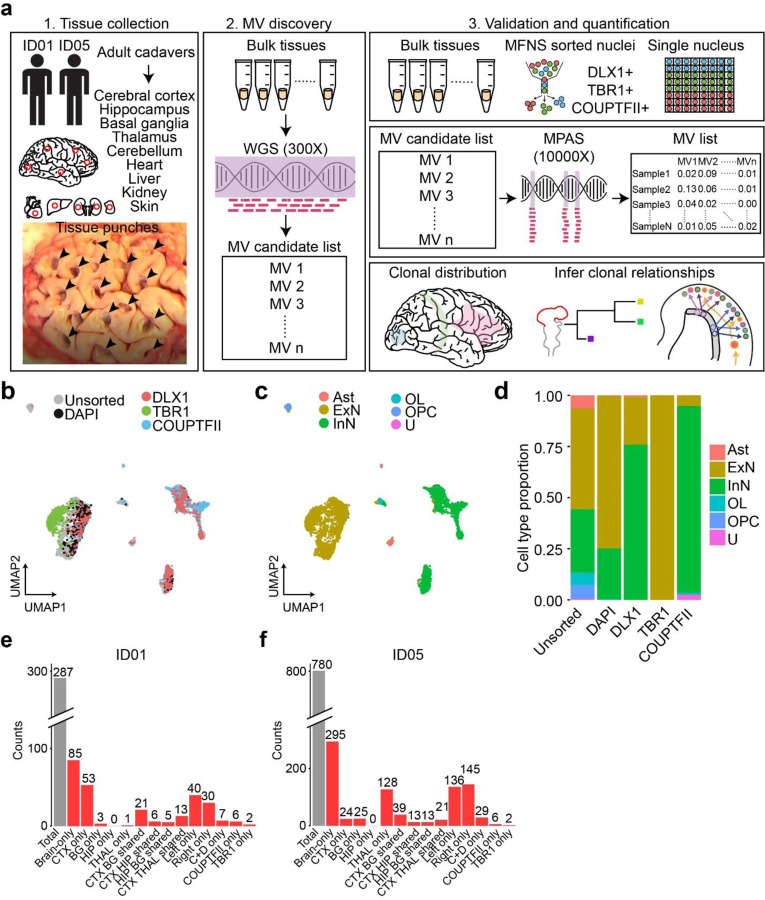
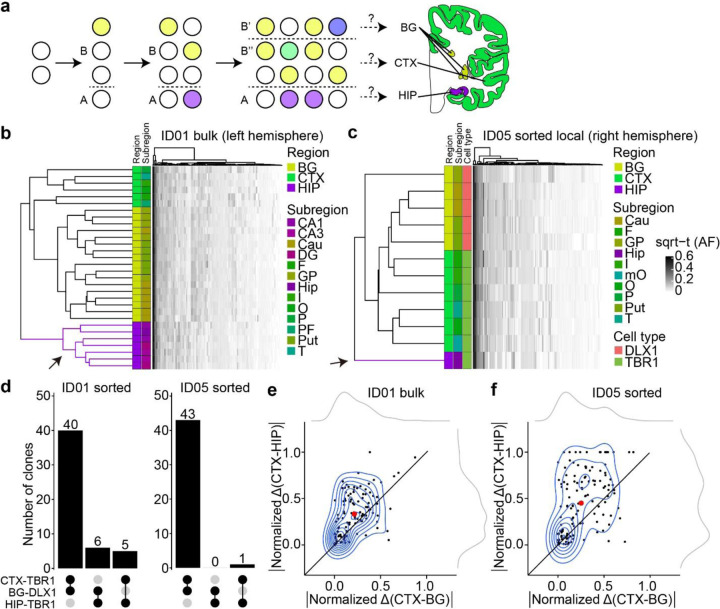
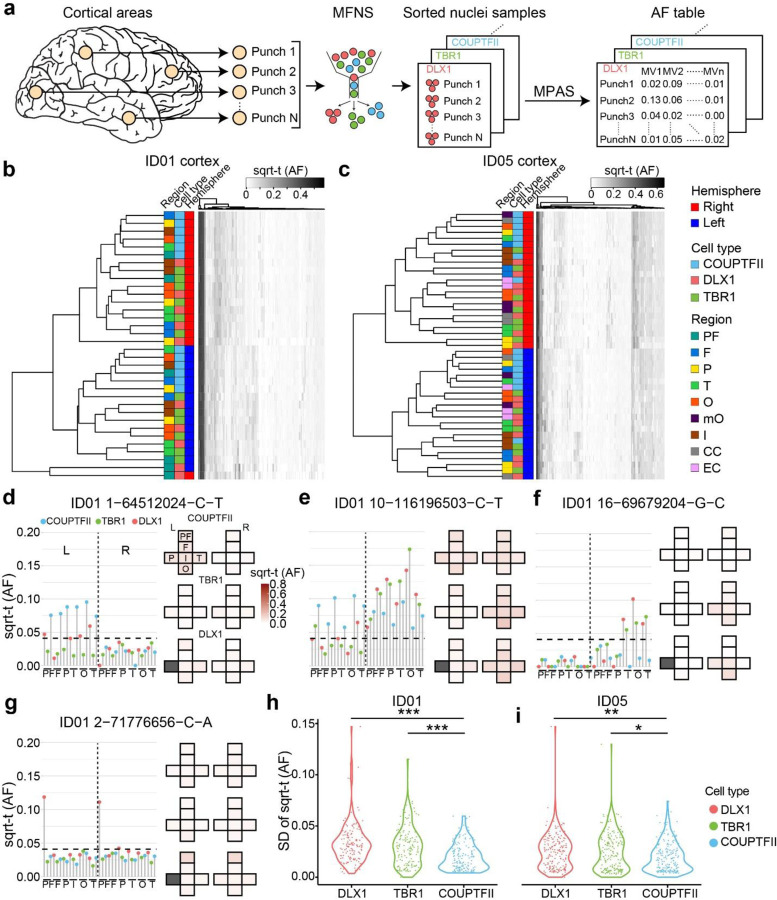
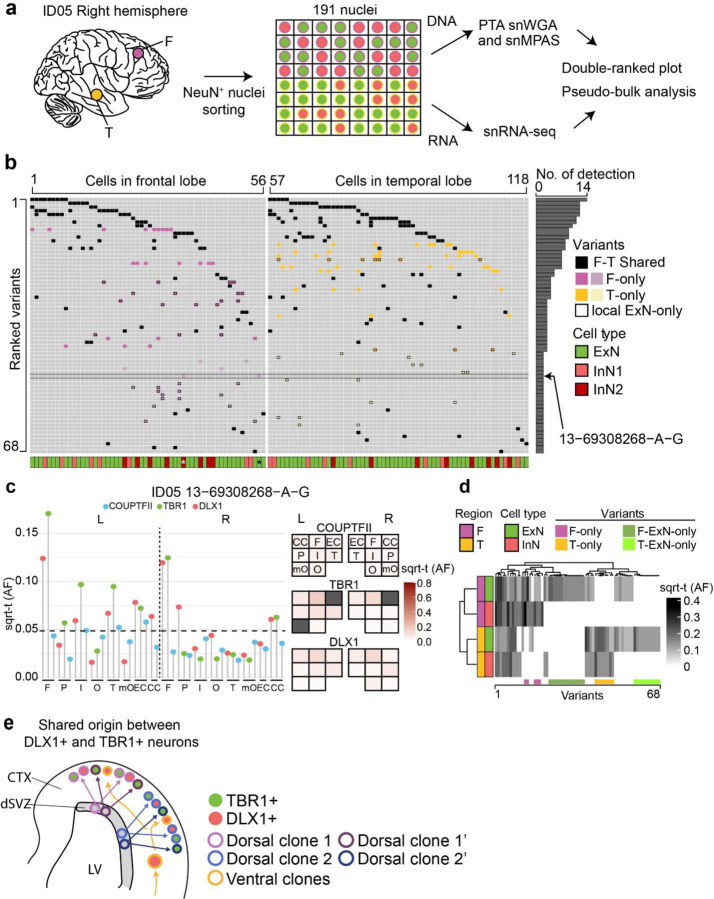
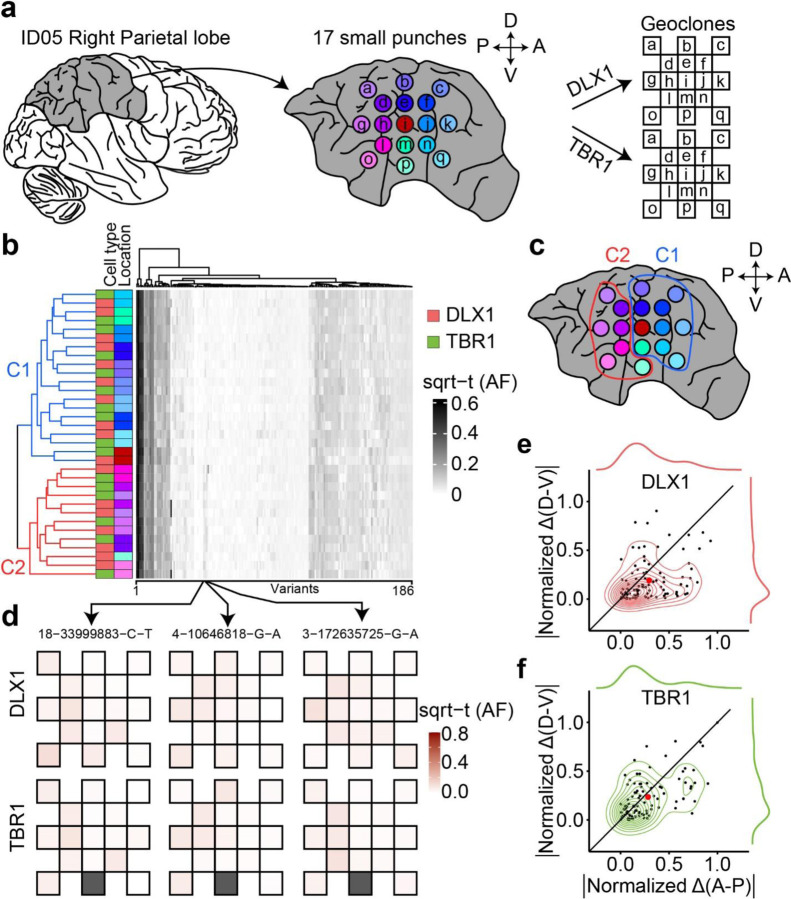
Debate remains around anatomic origins of specific brain cell subtypes and lineage relationships within the human forebrain. Thus, direct observation in the mature human brain is critical for a complete understanding of the structural organization and cellular origins. Here, we utilize brain mosaic variation within specific cell types as distinct indicators for clonal dynamics, denoted as cell-type-specific Mosaic Variant Barcode Analysis. From four hemispheres from two different human neurotypical donors, we identified 287 and 780 mosaic variants (MVs), respectively that were used to deconvolve clonal dynamics. Clonal spread and allelic fractions within the brain reveal that local hippocampal excitatory neurons are more lineage-restricted compared with resident neocortical excitatory neurons or resident basal ganglia GABAergic inhibitory neurons. Furthermore, simultaneous genome-transcriptome analysis at both a cell-type-specific and single-cell level suggests a dorsal neocortical origin for a subgroup of DLX1+ inhibitory neurons that disperse radially from an origin shared with excitatory neurons. Finally, the distribution of MVs across 17 locations within one parietal lobe reveals restrictions of clonal spread in the anterior-posterior axis precedes that of the dorsal-ventral axis for both excitatory and inhibitory neurons. Thus cell-type resolved somatic mosaicism can uncover lineage relationships governing the development of the human forebrain.

Keywords: brain mosaicism; cell type; clonal dynamics; inhibitory neurons; lineage; migration; somatic; whole-genome sequencing.


Conflict of interest statement

Competing interests K.K. is a senior scientist at Bioskryb Genomics Inc. All other authors declare no competing interests.

Figures

Extended Data Fig. 1.
Extended Data Fig. 1.. Tissues collected from ID01 and ID05.
Red dots indicate approximate sites of punch biopsies. Abbreviations: PF, prefrontal cortex; F, frontal cortex; P, parietal cortex; O, occipital cortex; T, temporal cortex; I, insular cortex; Cb, Cerebellum; CC, cingulate cortex; mOC, medial occipital cortex; Cau, Caudate; Put, Putamen; Thal, Thalamus; GP, globus pallidus; EC, entorhinal cortex; HIP, hippocampus; AMG, amygdala; POA, preoptic area; Cl, Claustrum.
Extended Data Fig. 2.
Extended Data Fig. 2.. Bisulfite sequencing in sorted TBR1+ and DLX1+ nuclear pools correlate with excitatory and inhibitory neuron methylome signatures.
(a–c) MFNS gating strategy on 30,000 single brain nuclei using DLX1, TBR1, and COUPTFII antibodies. (d) snRNA-seq of post-MFNS nuclei confirming enrichment of targeted nuclear types. (e) Marker expression in assigned nuclear types correlating with targeted nuclear types. (f) UMAP plot NR2F2 expression pattern (encoding COUPTFII) highlighting a subpopulation of inhibitory neurons (compare with Fig. 1c). (g–i) Reference excitatory and inhibitory neuronal methylome signatures (aggregated from an available public single-nuclei methylome dataset) compared to methylome signatures of sorted nuclei and a bulk heart sample. Normalized relative methylation levels (y-axes) and genomic positions (x-axes) of genes listed at top. (g) Methylome signature of SLC17A7 encoding VGLUT1, an excitatory neuronal marker in the brain, showing reduced methylation (i.e. representing activation) across the gene body and especially near the transcription start site (TSS, red box) in TBR1+ excitatory neuron samples. (h) Methylome signature of SLC6A1 encoding VGAT1, an inhibitory neuronal marker in the brain, showing reduced methylation across the gene body and especially near the TSS (red box). (i) Methylome signature of RBFOX3 encoding NEUN, a mature neuronal marker in the brain, showing reduced methylation at the TSS in neurons compared with bulk heart. Ref ExN, reference excitatory neurons; Ref InN, reference inhibitory neurons. (j) Heatmap and dendrograms based on cosine similarities of global methylation patterns between groups. Two different TBR1+ or DLX1+ samples were aggregated. The TBR1+ nuclear pool was clustered with Ref ExN while the DLX1+ clustered near the pool with Ref InN. The control heart bulk sample was distant from either group.
Extended Data Fig. 3.
Extended Data Fig. 3.. Quality controls of MPAS results.
(a–b) Violin plot distribution of log-transformed total read depths (y-axes) of individual variant positions in 321 or 147 samples from ID01 or ID05 (x-axes), respectively. (c–d) Correlation between sqrt-t AF of individual variants from WGS and MPAS. Blue horizontal dashed lines: Lower bound for binomial distribution detection threshold. r and p-values from Pearson’s Product-Moment correlation. Identity lines (red).
Extended Data Fig. 4.
Extended Data Fig. 4.. Upset plots showing the intersection of validated MVs detected at different tissue sites.
(a) ID01. (b) ID05. CTX, cortex; BG, Basal ganglia; THAL, thalamus; HIP, hippocampus; AMG, amygdala; CB, cerebellum; SUB, subiculum; CLA, Claustrum; POA, preoptic area; OLF, olfactory bulb.
Extended Data Fig. 5.
Extended Data Fig. 5.. UMAP relationships between samples from the brain based on AFs of validated MVs.
Clustering by the same hemisphere validates lateralization of brain-derived cell clones except for the independent origin of microglia (marked by PU.1, arrow). (a–c) UMAP clustering in ID01 samples labeled by (a) cell type, (b) gross region, or (c) subregion, respectively. Clustered samples tend to show similar AF patterns. (d–f) UMAP clustering in ID05 samples labeled by (d) cell type, (e) region, or (f) subregion, respectively. Although PU.1 cells were not sorted in ID05, other findings are similar between ID01 and ID05.
Extended Data Fig. 6.
Extended Data Fig. 6.. Evidence for HIP lineage restriction occurring prior to CTX or BG in ID01 sorted nuclear pools.
(a) Heatmap with 17 sorted nuclear samples based on sqrt-t AFs of 121 informative MVs from ID01, similar to Fig. 2c, showing greater HIP lineage separation compared with CTX or BG (purple compared with green or yellow). (b) Contour plot (at center) with 121 informative MVs derived from (a) and two kernel density estimation plots (at periphery). Axes show the absolute normalized difference value for each MV between the average AF of CTX and BG (CTX-BG) or CTX and HIP regions (CTX-HIP). Solid line: identity. Red dot: averaged x and y values of individual data points. sqrt-t AF, square-root transformed allele fraction; CTX, cortex; BG, basal ganglia; HIP, hippocampus; Cau, caudate; DG, dentate gyrus; HIP and Hip, hippocampal tissue; I, insular cortex; O, occipital cortex; P, parietal cortex; PF, prefrontal cortex; Put, putamen; T, temporal cortex; GP, globus pallidus.
Extended Data Fig. 7.
Extended Data Fig. 7.. Bootstrapping results for dendrograms with sorted nuclei from cortical areas.
(a) Bootstrapping results of ID01. (b) Bootstrapping results of ID05. The percentage of 10,000 replicates showing relationships between sqrt-t AFs for TBR1+ and DLX1+ nuclei in the same geographic region were more similar than TBR1+ nuclei from two different geographic regions (arrow for example). COUPTFII nuclei clustered among themselves, outside of the DLX1 and TBR1 clusters. Approximated unbiased p-value > 95% (red): the hypothesis “the cluster does not exist” rejected with a significance level (< 5%).
Extended Data Fig. 8.
Extended Data Fig. 8.. Quality controls of the ResolveOME dataset in ID05.
(a) A UMAP plot of snRNA-seq using 225 NEUN + nuclei and 121 aggregated reference cell types,. F, frontal; T, temporal; HIP, hippocampus; REF, reference dataset. (b) UMAP labeled by cell types. Note that UMAP clusters separate by cell type (ExN, InN or Other) more than by location. (c) Relative expression of cell type markers within clusters, confirming cell identity. (d) Hierarchical clustering based on sqrt-t AFs of 34 informative MVs shared in 5 to 29 cells in single-nuclear data. F- NEUN, sorted frontal NEUN+ nuclei pool; F-sc, pseudo-bulk snMPAS data from a frontal lobe punch; T-sc, snMPAS data from a frontal (F) lobe punch. (e) Correlation between sqrt-t AFs of MVs between F- NEUN and F-sc. (f) Correlation between sqrt-t AFs of MVs between F- NEUN and T-sc. Linear regression with upper and lower 95% prediction intervals displayed by blue solid lines and gray surrounding area; sqrt-t (AF), sqrt-t AF. Pearson’s Product-Moment correlation in e and f. (g) Null distribution of the frequency of the number of inhibitory neurons carrying MVs exclusively detected in one lobe and shared with at least two other local cells, including one excitatory neuron within the same lobe. 10,000 permutations. Portion to the right of the red dashed line, compared to the entire distribution, represents the probability (p < 0.0001, one-tailed permutation test) of having 15 or more InNs. (h–m) RNA expression levels of informative genes between InN1 (n = 17) and InN2 (n = 16) (Fig 4b) in snRNA-seq. (h) Comparable expression levels of inhibitory neuronal markers between both groups. (i) Decreased tendency for the expression of CGE-derived cell markers in InN2 compared to InN1, implying COUPTFII+ inhibitory neurons are unlikely InN1, consistent with previous observations in sorted nuclear populations. (j) RELN+ inhibitory neuronal marker showed decreased expression tendency in InN2 compared to InN1. (k) Increased expression tendency for parvalbumin-positive (PV+) inhibitory neuronal marker in InN2 compared to InN1, implying dorsally derived inhibitory neurons include PV+ neurons. (l, m) top 3 genes increased (l) or decreased (m) in InN2 compared to InN1 among the most variable 3000 protein-coding genes.
Figure 1.
Figure 1.. Comprehensive cMVBA identifies cell-type-resolved and region-specific MVs.
(a) cMVBA workflow overview consists of three phases: 1. Tissue collection: Cadaveric organs accessed for tissue punches from organs listed (red circles and black arrows: punch locations in organs and frontal lobe) for MV detection. 2. A subset of the bulk tissue punches undergo 300x WGS followed by best-practice MV calling pipelines to generate a list of MV candidates. 3. DNA from each punch bulk tissue, methanol fixed nuclear sorted (MFNS) samples, or individual nuclei are subjected to validation and quantification of MV candidates via massive parallel amplicon sequencing (MPAS). AFs of the validated MVs from MPAS are used to determine clonal dynamics of different neuronal cell types and reconstruct features of brain development. (b) UMAP plot from snRNA-seq with MFNS sorted or unsorted cortical nuclear pools (n = 3322). Sorted nuclear groups labeled with distinct colors. (c) Cortical cell types based on marker expression and differentially expressed genes in each cluster. (d) Cell type proportion within each sorted cortical nuclear population. (e–f) Number of MVs categorized by location detected in each donor ID01 or ID05 (Supplementary Data 4). ‘Brain-only’ MVs (i.e., detected only in brain tissue, but not other organs) including subtypes in red. ‘C+D only’: Brain-only MVs exclusively detected in both COUPTFII+ and DLX1+ populations but not the other cell types. Ast, Astrocyte; ExN, Excitatory neurons; InN, inhibitory neurons; OL, oligodendrocytes; OPC, oligodendrocyte precursor cells; U, undefined.
Figure 2.
Figure 2.. Human hippocampal lineage diverges from the cortex and basal ganglia.
(a) Model of clonal dynamics in forebrain anlage. Cells restricted to anlage A, which acquire a new MV (purple) are rarely present in anlage B. Later, B diverges into B’ and B”, which share more clones (yellow) than with anlage A. This analysis was applied to the geographies of the basal ganglia (BG), cortex (CTX) and hippocampus (HIP). (b–c) Heatmaps with 30 bulk samples from left hemispheric CTX, BG, and HIP (y-axis, b) or 12 selected sorted cell types (y-axis, c), compared with MVs identified in at least two samples (146 MVs, x-axis in (b) or 131 MVs, x-axis in (c)), depicted in Fig. 2d. Dendrograms at right shows greater HIP lineage separation (purple, arrow) compared with CTX or BG (green and yellow) either using bulk tissue (b) sorted nuclei (c), suggesting HIP earlier lineage restriction. (d) Counts of shared MVs across CTX, BG or HIP within sorted nuclear pools showing many more shared MVs between CTX and BG compared with HIP in both donors ID01 and ID05. (permutation p-value <0.001) (e–f) Contour plots of informative 113 and 131 MVs from (b) and (c) (blue) and two kernel density estimation plots (grey). Axes show absolute normalized AF difference for each MV averaged across all samples from the respective tissues (CTX, HIP, BG). Black line: identity line, black dots: individual MVs, large red dot: averaged across all MVs, suggesting AF differences are smaller between CTX and BG than between CTX and HIP. Abbreviations: Cau, caudate; DG, dentate gyrus; HIP and Hip, hippocampal tissue, where lowercase Hip refers to hippocampal subregion not specified; I, insular cortex; O, occipital cortex; P, parietal cortex; PF, prefrontal cortex; Put, putamen; T, temporal cortex; mO, medial occipital cortex; GP, globus pallidus; sqrt-t (AF), square-root transformed allele fraction.
Figure 3.
Figure 3.. Cell-type-resolved clonal dynamics of cortical excitatory and inhibitory neurons.
(a) cMVBA workflow uses MFNS nuclei for MPAS assessment of AFs in cortical punches. (b–c) Heatmaps of sorted nuclei based on AFs of 146 informative shared MVs from ID01 (b) and 186 from ID05 (c) (y-axis) compared with color-coded hemisphere, cell type or region. PF, prefrontal cortex; F, frontal cortex; P, parietal cortex; T, temporal cortex; O, occipital cortex; mO, medial occipital cortex; I, insular cortex; CC, cingulate cortex; EC, Entorhinal cortex. sqrt-t (AF), square-root transformed allelic fraction. Dendrograms indicate that subcortically derived COUTFII samples cluster together (teal), whereas DLX1 and TBR1 samples derived from the same region cluster together (notice interspersed orange and green boxes) suggesting shared lineage relationships. (d–g) Lolliplots comparing regions (x-axis) with sqrt-t AF (y-axis) for representative MVs. Height of individual lollipop: AF; color: cell type; dashed line: threshold. Next to each lolliplots is the ‘geoclone’ representation of sqrt-t AF shaded intensity (pink) from tissue where detected. Gray boxes: not sampled. (d) MV at chr. 1 position 64512024 C-T is found in COUPTFII+ cells in the left hemisphere at AFs different from either DLX1+ or TBR1+ cells, consistent with COUPTFII+ cells having different lineage than DLX+ or TBR1+. MVs in (e–f) also show more AF similarities between DLX+ or TBR1+ than COUPTFII+ cells. MF in (g) shows a representation of DLX1+ cells in both prefrontal lobes, consistent with a potential ventrally-derived DLX1+ clone distributed across the two hemispheres. (h–i) Standard deviation (SD) of sqrt-t AFs for 146 and 186 MVs in the three different cell types in donor ID01 (h) and ID05 (i), respectively, showing lower variation in COUPTFII+ cells compared with DLX1+ or TBR1+, consistent with their clonal distribution across cortical areas. Each dot: single MV measured in 34 vs. 45 punches across the neocortex in ID01 and ID05, respectively. One-way ANOVA with Tukey’s multiple comparison test. *:P<0.05, **:P<0.001, ***P<0.0001. PF, prefrontal cortex; F, frontal cortex; P, parietal cortex; O, occipital cortex; T, temporal cortex; I, insular cortex; CC, cingulate cortex; mOC, medial occipital cortex; L, left; R, right.
Figure 4.
Figure 4.. snMPAS incorporating snRNA-seq supports the existence of dorsally derived cortical inhibitory neurons in humans.
(a) Frontal and temporal small punches of the right hemisphere of ID05 NEUN+ 191 single-nuclei were subjected to primary template-directed amplification (PTA) single nuclear whole genome amplification (snWGA) followed by single nuclear MPAS (snMPAS) genotyping with concurrent snRNA-seq, termed ResolveOME, for analysis. (b) A double-ranked plot divided in half based on brain region (frontal: left, temporal: right). 68 MVs identified in anywhere between 2 to 14 cells (No. of detection). A total of 118 excitatory and inhibitory neurons plotted. MVs were further classified according to whether they were detected in both frontal and temporal lobes (F-T Shared, black) vs. a single lobe F-only (purple) or T-only (yellow). Dark purple or yellow: detected in 3 or more nuclei, light purple or yellow: detected in only 2 nuclei. x-axis: cell type, i.e. ExN: green; InN1 (orange): All inhibitory neurons except for InN2. InN2 (dark red): Inhibitory neurons carrying at least one F- or T-only MV detected in 3 or more nuclei, or the nucleus marked by asterisk. MV 13–69308268-A-G (arrow) was detected in 2 nuclei (*), an ExN and an InN, consistent with a shared lineage. (c) Distribution MV 13–69308268-A-G across cortical areas in ID05. Left: lolliplot and Right: geoclone showing sqrt-t AFs of each sorted nuclear pool in different cortical locations, reproducing single-nucleus data. Note that DLX+ and TBR1+ nuclei show similar sqrt-t AF (geoclone) and are more similar to each other than COUPTF2+ AF (lolliplots). Dashed line: threshold. (d) Pseudo-bulk analysis after aggregation based on individual MVs (x-axis) and cell types and regions (y-axis). Note that the dendrogram cluster pseudo-bulk cell populations of ExN and InN in F (purple) or T (orange) lobes based upon shared MV, although some MVs are present in a single cell type. (e) Model for the shared origin of local ExN and InN cortical neurons. Dorsal clones can produce both TBR1+ excitatory neurons and DLX1+ inhibitory neurons (purple and blue arrows), evidenced both by similar spatial clonality from sqrt-t AFs, as well as shared MVs at the single cell level. Ventrally derived DLX1+ inhibitory neurons (yellow arrow) tangentially migrate and are more likely to disperse across the cortex.
Figure 5.
Figure 5.. Earlier establishment of the A-P axis compared to D-V restricted clonal spread (RCS) within a cortical lobe.
(a) Workflow for the observation of clonal dynamics in a lobe. A total of 17 punches were radially sampled and subject to MFNS to assess MVs. The AF of MVs in different sites were mapped onto the geoclones (checkerboard). (b) Heatmap and dendrogram hierarchical cluster of sorted nuclear pools based on sqrt-t AFs of 186 informative MVs from ID05 detected in the right parietal lobe. Sidebars left of the heatmap: cell type and sample location information, according to the convention in Fig. 3. Colors for lobar location taken from (a). Dendrogram highlights two main clusters (C1:blue; C2:red) that when mapped back onto the sampled spatial coordinates (c) are separated in the AP dimension (red and blue circle). (d) Geoclones of three individual MVs from (b, box, arrows), showing shades of pink are more different in the A-P axis than in the D-V axis. Gray box: not available. (e–f) Cell-type-resolved contour plots of 94 shared MVs from (b) (in the center) with kernel density estimation plots (in the periphery) for DLX1 (top) or TBR1 (bottom), showing MVs from both cell types with a greater normalized difference of sqrt-t AFs in A-P than in D-V. Black line: identity line, dots: individual MVs, large red dot: average across all MVs.

References

    1. Bulfone A. et al. Spatially restricted expression of Dlx-1, Dlx-2 (Tes-1), Gbx-2, and Wnt-3 in the embryonic day 12.5 mouse forebrain defines potential transverse and longitudinal segmental boundaries. J Neurosci 13, 3155–3172, doi:10.1523/JNEUROSCI.13-07-03155.1993 (1993). - DOI - PMC - PubMed
    1. Puelles L. & Rubenstein J. L. Forebrain gene expression domains and the evolving prosomeric model. Trends Neurosci 26, 469–476, doi:10.1016/S0166-2236(03)00234-0 (2003). - DOI - PubMed
    1. Furuta Y., Piston D. W. & Hogan B. L. Bone morphogenetic proteins (BMPs) as regulators of dorsal forebrain development. Development 124, 2203–2212, doi:10.1242/dev.124.11.2203 (1997). - DOI - PubMed
    1. Grove E. A., Tole S., Limon J., Yip L. & Ragsdale C. W. The hem of the embryonic cerebral cortex is defined by the expression of multiple Wnt genes and is compromised in Gli3-deficient mice. Development 125, 2315–2325, doi:10.1242/dev.125.12.2315 (1998). - DOI - PubMed
    1. Monuki E. S., Porter F. D. & Walsh C. A. Patterning of the dorsal telencephalon and cerebral cortex by a roof plate-Lhx2 pathway. Neuron 32, 591–604, doi:10.1016/s0896-6273(01)00504-9 (2001). - DOI - PubMed

Publication types