[Preprint]. 2023 Nov 2:2023.11.01.564054.
doi: 10.1101/2023.11.01.564054.

Pathological claustrum activity drives aberrant cognitive network processing in human chronic pain

Affiliations

Pathological claustrum activity drives aberrant cognitive network processing in human chronic pain

Brent W Stewart et al. bioRxiv. .

Update in

Abstract

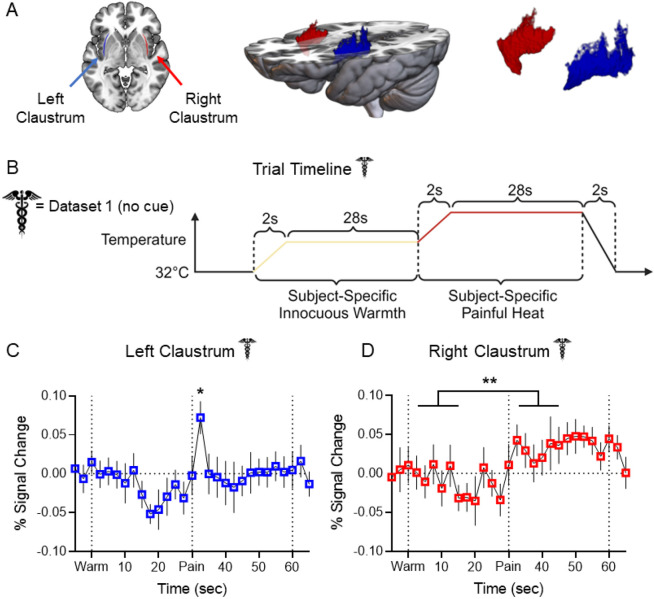
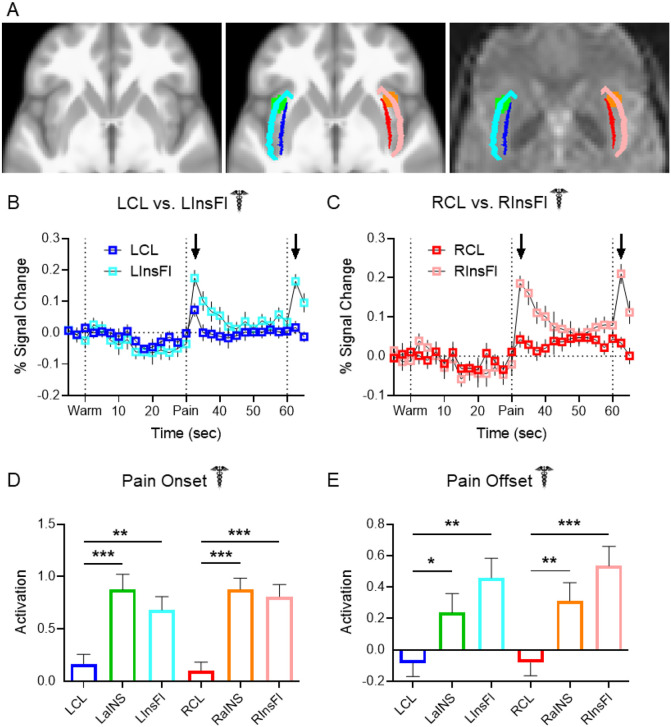
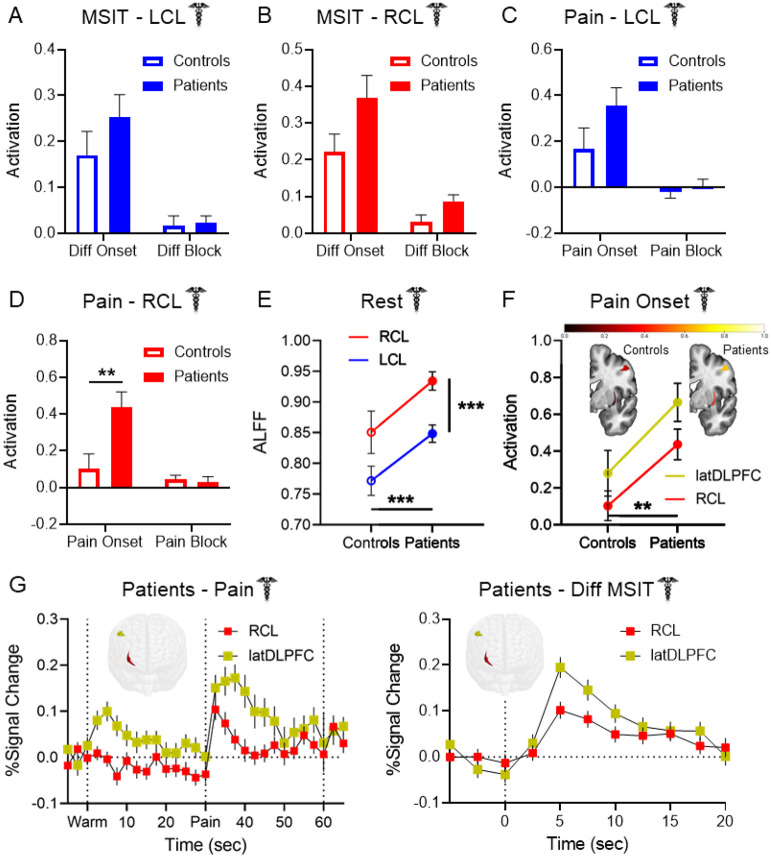
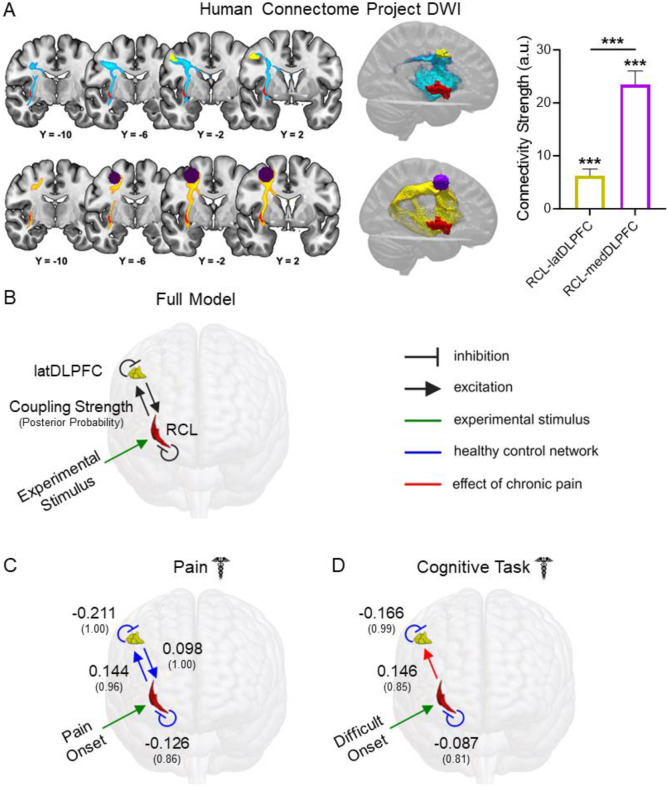
Aberrant cognitive network activity and cognitive deficits are established features of chronic pain. However, the nature of cognitive network alterations associated with chronic pain and their underlying mechanisms require elucidation. Here, we report that the claustrum, a subcortical nucleus implicated in cognitive network modulation, is activated by acute painful stimulation and pain-predictive cues in healthy participants. Moreover, we discover pathological activity of the claustrum and a lateral aspect of the right dorsolateral prefrontal cortex (latDLPFC) in migraine patients. Dynamic causal modeling suggests a directional influence of the claustrum on activity in this latDLPFC region, and diffusion weighted imaging (DWI) verifies their structural connectivity. These findings advance understanding of claustrum function during acute pain and provide evidence of a possible circuit mechanism driving cognitive impairments in chronic pain.

Keywords: Chronic pain; Claustrum; Cognition; Cognitive control; Migraine; Networks; Pain.


Conflict of interest statement

Declaration of Interests: The authors declare no competing interests.

Figures

Figure 1.
Figure 1.. Claustrum BOLD signal increases in response to experimental heat pain
(A) Left: Horizontal slice of MNI template displaying LCL (blue) and RCL (red) in neurological orientation. Middle: 3D rendering of MNI template displaying dorsoventral extent and placement of LCL and RCL. Right: 3D rendering displaying shape of LCL and RCL. (B) Experimental timeline for each trial in Dataset 1 pain scans. (C) Average FIR timeseries of LCL BOLD percent signal change showed a significant increase at t = 32.5 sec (pain “onset”: t = 3.011, p-FDR = 0.023) in Dataset 1 healthy participants (n = 34). (D) Average FIR timeseries of RCL BOLD percent signal change showed significantly greater signal during pain than warm timepoints (t = 2.882, p-FDR = 0.004). Error bars show standard error of the mean across subjects. * represents a p-value of < 0.05, ** < 0.01, *** < 0.001. Caduceus symbol signifies Dataset 1 results. Image by Clker-Free-Vector-Images from Pixabay. Unfilled bars/plot points signify healthy participant results. Acronyms: ALFF – Amplitude of Low Frequency Fluctuations, BOLD – Blood Oxygenation Level Dependent, DCM – Dynamic Causal Modeling, DWI – Diffusion Weighted Imaging, FIR – Finite Impulse Response, GLM – General Linear Model, HCP – Human Connectome Project, HRF – Hemodynamic Response Function, LaINS – Left Anterior Insula, latDLPFC – Lateral Right Dorsolateral Prefrontal Cortex (see text), LCL – Left Claustrum, LInsFl – Left Insular Flank (see text), LV – Latent Variable, medDLPFC – Medial Right Dorsolateral Prefrontal Cortex (see text), MNI – Montreal Neurological Institute, MSIT – Multi-Source Interference Task, RaINS – Right Anterior Insula, RCL – Right Claustrum, RInsFl – Right Insular Flank (see text), TR – Repetition Time, WM – White Matter. Figures generated in GraphPad Prism, MRICroGL, and BioRender.com.
Figure 2.
Figure 2.. Claustrum BOLD signal is distinguishable from neighboring regions
(A) Left: Horizontal slice of average anatomical scan from 56 Dataset 1 subjects. Middle: Same slice as left depicting shapes and locations of LCL (blue), LInsFl (light blue), LaINS (green), RCL (red), RInsFl (pink), and RaINS (orange) ROIs. Right: Same z-stack as left and middle with ROIs overlaid on a Dataset 1 healthy participant’s preprocessed functional resting state image. (B – C) Average FIR timeseries of Dataset 1 healthy participant thermal stimulation trials displayed greater increases at pain onset and pain offset (black arrows) in (B) LInsFl vs. LCL and (C) RInsFl vs. RCL BOLD percent signal change. No statistical tests were performed on (B) & (C). (D) Regional activation at pain onset was compared to assess the distinctiveness of claustrum signal change to a stimulus predicted to evoke similar responses across proximal ROIs. Average parameter estimation (regression slope) detected significantly different activation at pain onset (i.e., first two seconds of thermal stimulation) between LCL and LaINS (t = 4.086, p-FDR < 0.001), LCL and LInsFl (t = 3.266, p-FDR = 0.002), RCL and RaINS (t = 5.816, p-FDR < 0.001), and RCL and RInsFl (RCL vs. RInsFl: t = 5.039, p-FDR < 0.001). (E) Regional activation at pain offset was compared upon observing divergent claustrum and insular flank timeseries at pain offset in (B) & (C) to assess potential functional differences between proximal ROIs. Significantly different activation at pain offset was observed between LCL and LaINS (t = 2.133, p-FDR = 0.037), LCL and LInsFl (t = 3.551, p-FDR = 0.001), RCL and RaINS (t = 2.773, p-FDR = 0.0096), and RCL and RInsFl (t = 4.095, p-FDR < 0.001). Assessment of region effects via unpaired t-tests was limited to comparisons of LCL vs. LaINS, LCL vs. LInsFl, RCL vs. RaINS, and RCL vs. RInsFl.
Figure 3.
Figure 3.. Claustrum BOLD signal increases in response to a pain-predictive cue
(A) Timeline of thermal stimulation for each trial in Dataset 2, which comprised (n = 39) healthy participants. (B) LCL displayed significant activation in response to the cue preceding thermal stimulation (t = 3.172, p-FDR = 0.030) but not to the onset of any thermal stimulation conditions following the cue (intense onset: t = 1.034, p-FDR = 0.615; moderate onset: t = 0.460, p-FDR = 0.811; slight onset: t = 0.699, p-FDR = 0.699; warm onset: t = 0.153, p-FDR = 0.879). (C) RCL did not display significant activation in response to the cue (t = 2.341, p-FDR = 0.123) or the onset of any thermal stimulation conditions (intense onset: t = 1.416, p-FDR = 0.550; moderate onset: t = 0.707, p-FDR = 0.699; slight onset: t = 1.176, p-FDR = 0.615; warm onset: t = 0.319, p-FDR = 0.835). (D) Significantly different activation in response to the auditory cue was observed between LCL and LInsFl (t = 2.713, p-FDR = 0.033). Significantly different activation in response to the auditory cue was not observed between LCL and LaINS (t = 0.009, p-FDR = 0.993), RCL and RaINS (t = 0.059, p-FDR = 0.993), or RCL and RInsFl (t = 1.161, p-FDR = 0.499). (E) In response to the onset of intense pain, significantly different activation was observed between LCL and LaINS (t = 2.564, p-FDR = 0.049), but not between LCL and LInsFl (t = 1.817, p-FDR = 0.098), RCL and RaINS (t = 1.587, p-FDR = 0.117), or RCL and RInsFl (t = 1.816, p-FDR = 0.098). (F) In response to the offset of intense pain, significantly different activation was observed between LCL and LaINS (t = 3.745, p-FDR = 0.001), LCL and LInsFl (t = 2.553, p-FDR = 0.017), RCL and RaINS (t = 3.637, p-FDR = 0.001), but not between RCL and RInsFl (t = 1.938, p-FDR = 0.056). Assessment of condition effects in (B) & (C) via unpaired t-tests was limited to comparisons of cue with thermal stimulation onset conditions. Assessment of region effects via unpaired t-tests in (D) – (F) was limited to comparisons of LCL vs. LaINS, LCL vs. LInsFl, RCL vs. RaINS, and RCL vs. RInsFl. Speaker symbol signifies Dataset 2 results. Image by Clker-Free-Vector-Images from Pixabay.
Figure 4.
Figure 4.. Migraine patients engage a pain-responsive prefrontal cortex region during pain-free cognitive task processing
(A) Top left: Horizontal slices with reference sagittal slice illustrating the multivariate pattern accounting for the most variance (LV1) in brain activity associated with cognitive task conditions in Dataset 1 healthy controls (n = 35, LV1: p < 0.001). Top right: LV1 of brain activity associated with cognitive task conditions in Dataset 1 migraine patients (n = 112, LV1: p < 0.001). All voxels shown in top row exhibited signal increases (red) or decreases (blue) with increasing cognitive load (motor control tapping condition, easy cognitive task, difficult cognitive task). Bottom left: Voxels exhibiting significant signal increases in LV1 of healthy controls (blue), LV1 of migraine patients (red), and their overlap (purple). Bottom right: Clusters (> 50 voxels) depicting significantly different cognitive task-associated signal changes between patients and controls (patients vs. controls LV1: p < 0.048). All significant clusters exhibited greater signal in patients than controls. (B) Left: latDLPFC (gold) depicted alongside healthy controls’ cognitive task LV1 (blue). Note how latDLPFC fell entirely outside the healthy control cognitive task network. Middle: medDLPFC (purple) overlaid on healthy controls’ cognitive task LV1 (blue). medDLPFC (center: 28, 0, 52; radius: 10mm) was centered within the healthy control cognitive task LV1 and the migraine patient cognitive task LV1 (not pictured). Right: 3D rendering depicting shapes and locations of latDLPFC and medDLPFC. (C) Left: Cognitive task-induced latDLPFC activation was only observed in patients during difficult onset (t = 10.129, p-FDR < 0.001) and difficult block (t = 5.178, p-FDR < 0.001) conditions. Two-way ANOVA found significant main effects of group (F (1, 580) = 20.38, p < 0.001), condition (F (3, 580) = 18.84, p < 0.001), and their interaction (F (3, 580) = 10.20, p < 0.001), and post-hoc comparisons detected significantly greater activation in patients than controls during the difficult onset condition (t = 7.003, p < 0.001). Right: Significant medDLPFC activation was detected in cognitive task conditions in healthy controls (easy onset: t = 2.835, p-FDR = 0.008; difficult onset: t = 11.328, p-FDR < 0.001; difficult block: t = 9.327, p-FDR < 0.001) and migraine patients (easy onset: t = 3.956, p-FDR < 0.001; difficult onset: t = 14.767, p-FDR < 0.001; difficult block: t = 11.980, p-FDR < 0.001). No main effect of group was detected (F (1, 580) = 0.939, p = 0.333). (D) Left: Average FIR timeseries of medDLPFC BOLD percent signal change during thermal stimulation in healthy controls (n = 34) and migraine patients (n = 105). Middle: Average FIR timeseries of latDLPFC BOLD percent signal change during thermal stimulation in both groups. No statistical tests were performed on these timeseries. Right: Significant latDLPFC activation was observed in both groups at pain onset (controls: t = 2.265, p-FDR = 0.048; patients: t = 6.481, p-FDR < 0.001) and during pain block (controls: t = 3.557, p-FDR = 0.003; patients: t = 2.358, p-FDR = 0.041). Two-way ANOVA found significant main effects of group (F (1, 548) = 11.38, p < 0.001), and condition (F (3, 548) = 8.985, p < 0.001), but not their interaction (F (3, 548) = 2.396, p = 0.067), and post hoc comparisons detected significantly greater activation in patients than controls during the warm onset (t = 3.08, p = 0.009) and pain onset (t = 2.973, p = 0.012) conditions. (E) medDLPFC and latDLPFC activation aligned with LCL but diverged from bilateral anterior insula in Dataset 2 in response to the auditory cue (LCL: t = 3.172, p-FDR = 0.008; medDLPFC: t = 2.811, p-FDR = 0.013; latDLPFC: t = 3.151, p-FDR = 0.008; LaINS: t = 1.929, p-FDR = 0.077; RaINS: t = 1.437, p-FDR = 0.159), (F) the onset of intense pain (LCL: t = 1.034, p-FDR = 0.470; medDLPFC: t = 0.896, p-FDR = 0.470; latDLPFC: t = 0.216, p-FDR = 0.830; LaINS: t = 3.409, p-FDR = 0.008; RaINS: t = 2.649, p-FDR = 0.029), and (G) the offset of intense pain (LCL: t = 0.678, p-FDR = 0.627; medDLPFC: t = 1.025, p-FDR = 0.519; latDLPFC: t = 0.483, p-FDR = 0.632; LaINS: t = 3.926, p-FDR < 0.001; RaINS: t = 5.003, p-FDR < 0.001). Unfilled bars/plot points signify healthy participant results. Filled bars/plot points signify migraine patient results.
Figure 5.
Figure 5.. Pathological claustrum activity coincides with aberrant cognitive network region activity in migraine patients
No group differences were detected in (A) LCL or (B) RCL activation during cognitive task conditions between Dataset 1 healthy controls and migraine patients. (C) LCL activation during pain stimulation in Dataset 1 healthy controls and patients exhibited no significant group differences. (D) Patients exhibited significantly greater RCL activation than controls at pain onset (two-way ANOVA main effect of group: F (1, 274) = 3.891, p = 0.0496; condition: F (1, 274) = 8.279, p = 0.004; interaction: F (1, 274) = 4.666, p = 0.032; post hoc pain onset controls vs. patients: t = 2.922, p = 0.008). (E) Two-way ANOVA of ALFF detected significantly greater spontaneous claustrum activity at rest in migraine patients than controls (main effect of group: F (1, 280) = 13.30, p < 0.001), and in RCL than LCL (main effect of hemisphere: F (1, 280) = 14.07, p < 0.001). Post hoc comparisons found greater ALFF in patients than controls in RCL (t = 2.685, p = 0.015) and LCL (t = 2.473, p = 0.028). No significant interaction effect was observed (F (1, 280) = 0.022, p = 0.881). (F) Two-way ANOVA of RCL and latDLPFC activation at pain onset found significantly greater activation across regions in patients than controls (F (1, 274) = 8.503, p = 0.004). There was no significant main effect of region (F (1, 274) = 2.699, p = 0.102) or significant interaction (F (1, 274) = 0.044, p = 0.834). Heat maps of RCL (bottom structure) and latDLPFC (top structure) similarly depicted greater activation at pain onset across regions in patients (right) than controls (left). (G) FIR timeseries illustrated coincident increases in RCL and latDLPFC BOLD percent signal change in Dataset 1 patients at left: the onset of pain and right: the onset of the difficult cognitive task. Timeseries are consistent with changes at condition onsets due to hemodynamic delay. No statistical tests were performed on these timeseries. 3-D rendered brains display shape and location of RCL (red) and latDLPFC (gold).
Figure 6.
Figure 6.. Structural and effective connectivity are consistent with an excitatory RCL→latDLPFC projection altered in migraine patients
(A) Group tractograms of (left-top) RCL-latDLPFC and (left-bottom) RCL-medDLPFC structural connectivity thresholded at 50% (indicating WM fibers detected in at least 50% of individuals sampled) in healthy HCP participants (n = 174). Right: Median structural connectivity strength (a.u.) of RCL-latDLPFC and RCL-medDLPFC circuits in healthy HCP participants with 95% CI displayed. Both circuits showed significant structural connectivity (RCL-latDLPFC: W = 15225, p-FDR < 0.001; RCL-medDLPFC: W = 15225, p-FDR < 0.001), and RCL-medDLPFC showed significantly greater connectivity strength than RCL-latDLPFC (W = 12607, p-FDR < 0.001). (B) Fully connected DCM models with bidirectional RCL←→latDLPFC excitatory projections and self-inhibitory connections in both ROIs were modeled for Dataset 1 pain and cognitive task scans separately. Experimental stimuli (green arrow) were modeled to affect RCL due to the a priori circuit hypothesis. Here, modeled connections are displayed in black. In subsequent panels, blue lines represent connections detected on average across healthy participants. Red lines depict effects of chronic pain and therefore represent significant group differences. Large font numbers represent second level coupling parameters (positive = excitatory), and small font numbers in parentheses represent posterior probabilities quantifying the strength of evidence for each coupling parameter (0.00 – 1.00). A posterior probability exceeding 0.75 is considered “positive evidence.” Therefore, only parameters with posterior probability greater than 0.75 were included in figure panels. (C) DCM found evidence of bidirectional excitatory RCLl←→latDLPFC connectivity and self-inhibition in both ROIs at pain onset in healthy controls. No effects of chronic pain were detected for this model, meaning effective connectivity in patients at pain onset is not significantly different than controls. (D) At difficult cognitive task onset, DCM only found evidence of self-inhibition in RCL and latDLPFC in healthy controls, with no evidence for excitatory projections between regions. However, evidence was found for increased RCL→latDLPFC effective connectivity due to chronic pain, consistent with the appearance of an excitatory projection during cognitive task processing in patients.

Similar articles

References

    1. Abdallah M, Zanitti GE, Iovene V, Wassermann D. Functional gradients in the human lateral prefrontal cortex revealed by a comprehensive coordinate-based meta-analysis. Elife. 2022. Sep 28;11:e76926. doi: 10.7554/eLife.76926. - DOI - PMC - PubMed
    1. Allen M, Dietz M, Blair KS, van Beek M, Rees G, Vestergaard-Poulsen P, Lutz A, Roepstorff A. Cognitive-affective neural plasticity following active-controlled mindfulness intervention. J Neurosci. 2012. Oct 31;32(44):15601–10. doi: 10.1523/JNEUROSCI.2957-12.2012. - DOI - PMC - PubMed
    1. Andersson JL, Skare S, Ashburner J. How to correct susceptibility distortions in spin-echo echo-planar images: application to diffusion tensor imaging. Neuroimage. 2003. Oct;20(2):870–88. doi: 10.1016/S1053-8119(03)00336-7. - DOI - PubMed
    1. Andersson JL, Sotiropoulos SN. Non-parametric representation and prediction of single- and multi-shell diffusion-weighted MRI data using Gaussian processes. Neuroimage. 2015. Nov 15;122:166–76. doi: 10.1016/j.neuroimage.2015.07.067. Epub 2015 Jul 30. - DOI - PMC - PubMed
    1. Atlas LY, Bolger N, Lindquist MA, Wager TD. Brain mediators of predictive cue effects on perceived pain. J Neurosci. 2010. Sep 29;30(39):12964–77. doi: 10.1523/JNEUROSCI.0057-10.2010. - DOI - PMC - PubMed

Publication types