[Preprint]. 2023 Oct 23:2023.10.20.563266.
doi: 10.1101/2023.10.20.563266.

Dissecting signaling regulators driving AXL-mediated bypass resistance and associated phenotypes by phosphosite perturbations

Affiliations

Dissecting signaling regulators driving AXL-mediated bypass resistance and associated phenotypes by phosphosite perturbations

Marc Creixell et al. bioRxiv. .

Abstract

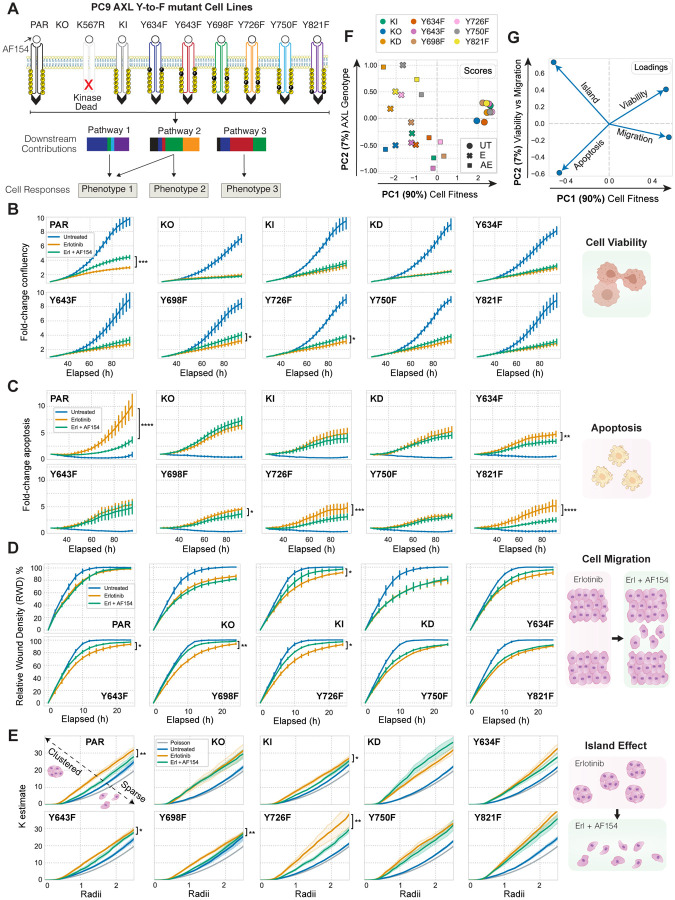
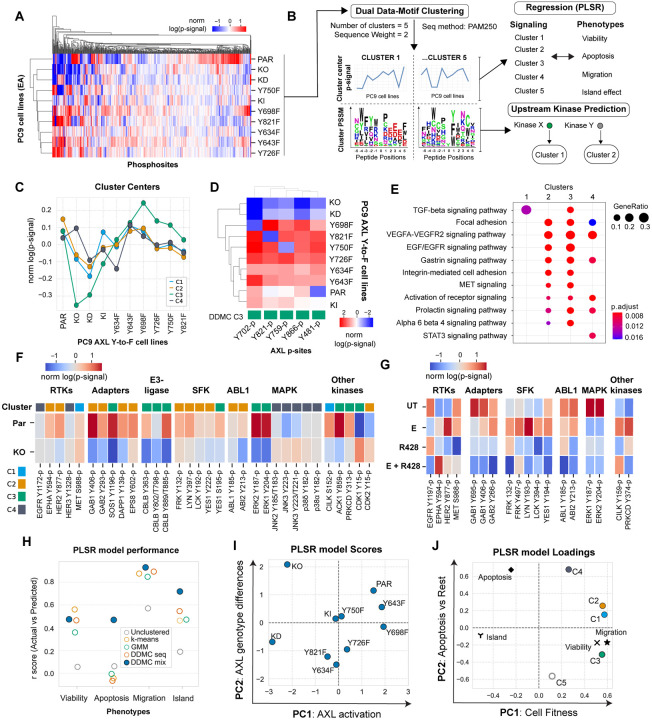
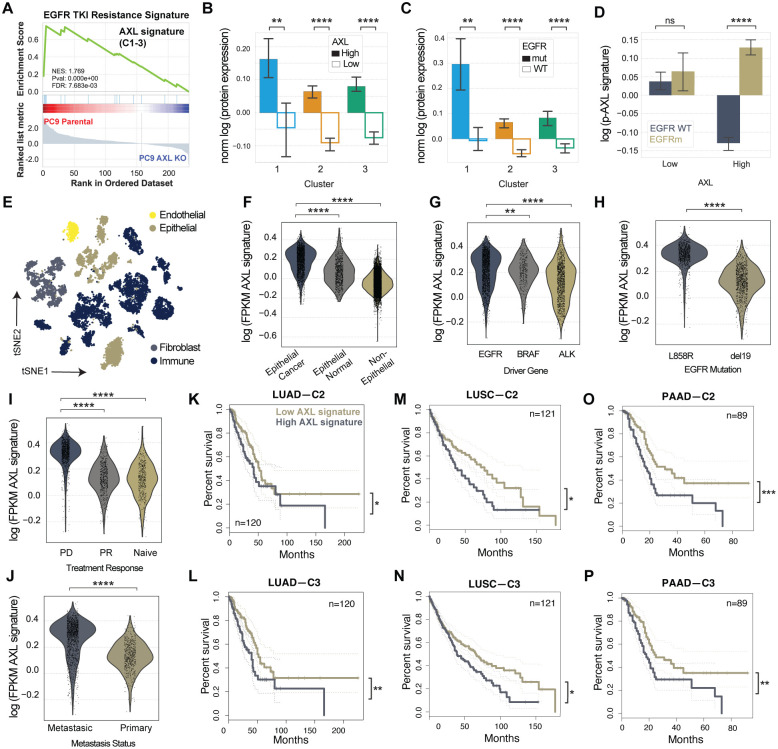
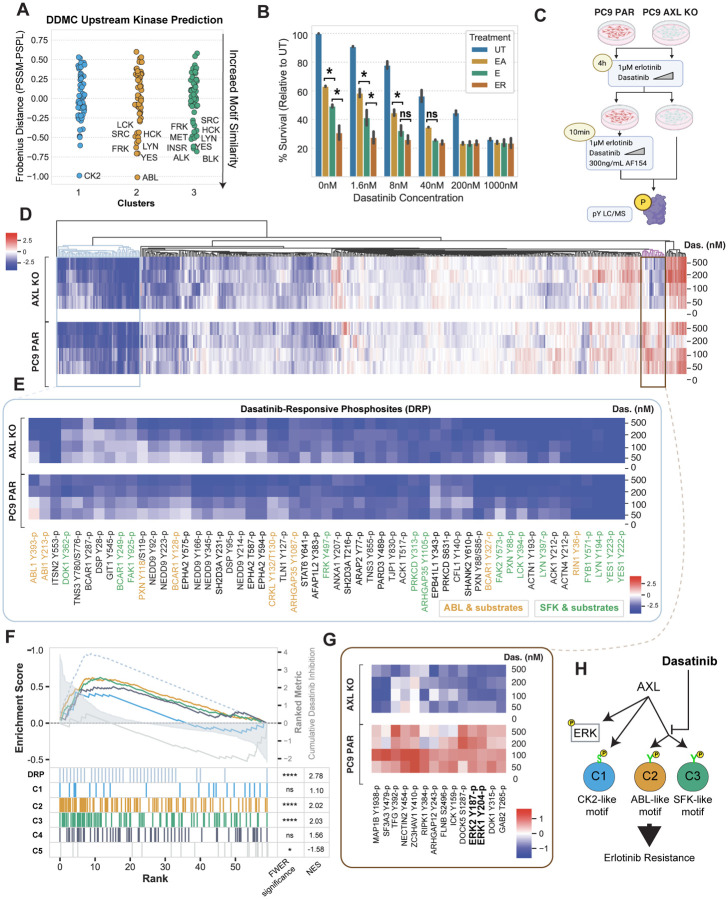
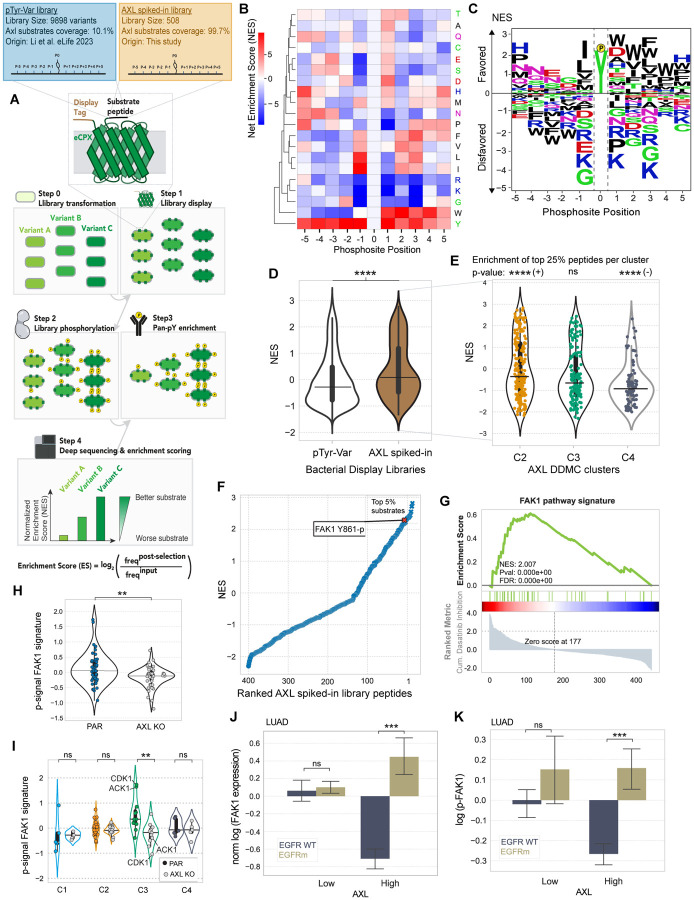
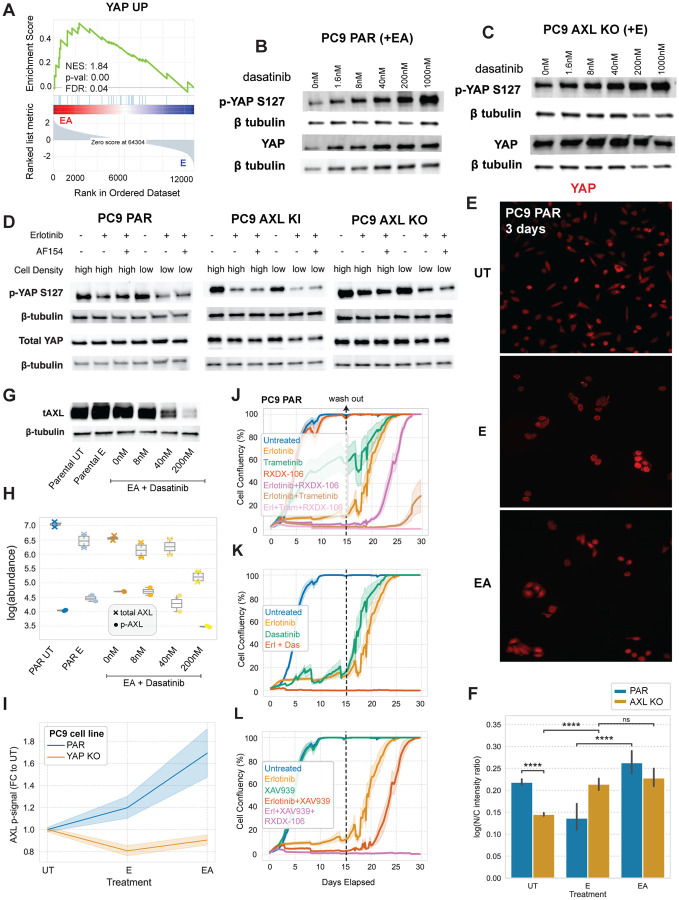
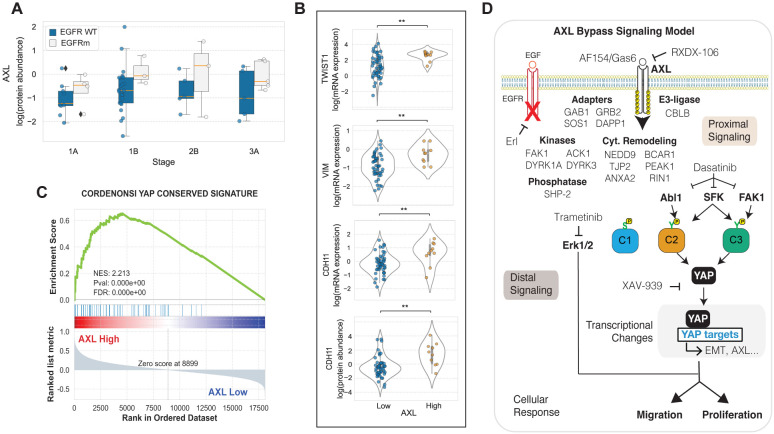
Receptor tyrosine kinase (RTK)-targeted therapies are often effective but invariably limited by drug resistance. A major mechanism of acquired resistance involves "bypass" switching to alternative pathways driven by non-targeted RTKs that restore proliferation. One such RTK is AXL whose overexpression, frequently observed in bypass resistant tumors, drives both cell survival and associated malignant phenotypes such as epithelial-to-mesenchymal (EMT) transition and migration. However, the signaling molecules and pathways eliciting these responses have remained elusive. To explore these coordinated effects, we generated a panel of mutant lung adenocarcinoma PC9 cell lines in which each AXL intracellular tyrosine residue was mutated to phenylalanine. By integrating measurements of phosphorylation signaling and other phenotypic changes associated with resistance through multivariate modeling, we mapped signaling perturbations to specific resistant phenotypes. Our results suggest that AXL signaling can be summarized into two clusters associated with progressive disease and poor clinical outcomes in lung cancer patients. These clusters displayed favorable Abl1 and SFK motifs and their phosphorylation was consistently decreased by dasatinib. High-throughput kinase specificity profiling showed that AXL likely activates the SFK cluster through FAK1 which is known to complex with Src. Moreover, the SFK cluster overlapped with a previously established focal adhesion kinase (FAK1) signature conferring EMT-mediated erlotinib resistance in lung cancer cells. Finally, we show that downstream of this kinase signaling, AXL and YAP form a positive feedback loop that sustains drug tolerant persister cells. Altogether, this work demonstrates an approach for dissecting signaling regulators by which AXL drives erlotinib resistance-associated phenotypic changes.


Conflict of interest statement

Competing interests: The authors declare that they have no competing interests.

Figures

Figure 1.
Figure 1.. Oncogenic phenotypes vary across PC9 AXL Y-to-F mutants.
(A) Schematic of the AXL Y-to-F mutant cell lines each causing distinct signaling and phenotypic consequences upon treatment with erlotinib for 4h and an AXL-activating antibody AF154 for 10 minutes. (B–C) Cell proliferation and cell death quantified for 96 hours using live cell imaging in response to E or EA. (D) Relative wound density (RWD) measured by a scratch wound assay across all PC9 cell lines treated with E or EA. (E) Extent of a E-induced cell island effect upon AXL activation measured by Ripley’s K function. Statistical significance of cell viability was calculated by t-tests in E- versus EA-treated cells across all time points in cell viability, cell death, and migration measurements, and across radii in cell island K estimates. *p-value < 0.05, **p-value < 0.001, ***p-value < 0.0001, ****p-value < 0.00001. Error bars are defined by the standard error of the mean.
Figure 2.
Figure 2.. DDMC signaling clusters predict the AXL-mediated phenotypes and identifies CK2, Abl1, and SFK as putative bypass signaling drivers.
(A) Global phosphoproteomic measurements from each of the PC9 AXL Y-to-F cell lines. (B) Computational strategy to map the network-level phosphoproteomic changes driving AXL-mediated phenotypic responses. The signaling data was clustered using DDMC to generate 5 clusters of peptides displaying similar phosphorylation behavior and sequence features. The cluster centers were then fit to a PLSR model to predict the phenotypic responses and find associations between clusters and phenotypes. DDMC was used to infer putative upstream kinases regulating clusters. (C) Average relative phosphorylation signal of the DDMC cluster centers. (D) Phosphorylation signal of AXL phosphosites per PC9 cell line and their cluster assignments. (E) Ranked GSEA analysis of DDMC clusters using ClusterProfiler. Gene lists per cluster were ranked based on the log phosphorylation abundance fold change of PC9 parental versus AXL KO cells. (F) Selected phosphosites and their cluster assignments in PC9 parental and AXL KO cells (G) Selected phosphosites in PC9 parental cells treated with E, R428, or both. (H) PLSR model prediction performance using the 5 indicated clustering strategies: no clustering (directly fitting the phosphoproteomic data, 5 cluster centers generated by k-means, clusters from a Gaussian Mixture Model (GMM), DDMC using only the peptide sequence information, or DDMC equally prioritizing the sequence and phosphorylation information. (I-J) PSLR scores (I) and loadings (J).
Figure 3.
Figure 3.. AXL downstream signature based on C2 and C3 is specific to AXL-high EGFRm LUAD tumors and correlates with progressive disease.
(A) EGFR TKI resistance signature found by a ranked GSEA analysis using the list of gene names included in C1, C2, and C3 and ranked by their log fold-change phosphorylation between PC9 parental and AXL KO cells. (B–C) Protein expression of C1, C2, and C3 members in (B) AXL-low versus AXL-high tumors or (C) EGFRm versus EGFR WT tumors. (D) Phosphorylation signal of AXL downstream signature by AXL levels and EGFR genotype. (E) tSNE plot of the different cell types of LUAD patient samples defined by Louvain clustering. (F) AXL signature score as defined by the mean gene expression of C1, C2, and C3 per cell in cancer cells, epithelial normal cells, or nonepithelial cells. (G–J) AXL signaling score of cancer cells by (G) driver mutation, (H) EGFR mutation, (I) treatment response or (J) metastatic status. (K–P) Kaplan-Meier curve of (K–L) LUAD, LUSC (M–N), and PAAD (O–P) patients according low or high C2 or C3 gene expression. PD: Progressive disease, PR: Partial Response. PAAD: Pancreatic adenocarcinoma. Error bars in (B-D) show the standard error of the mean. Statistical significance was calculated by Mann-Whitney U rank tests in (B-J) and by logrank tests in (K-P). *p-value < 0.05, **p-value < 0.001, ***p-value < 0.0001, ****p-value < 0.00001, ns means not significant.
Figure 4.
Figure 4.. Dasatinib inhibits C2 and C3.
(A) DDMC upstream kinase predictions. (B) Cell confluency of PC9 parental cells exposed to the indicated treatments with increasing concentrations of dasatinib for 72 hours. Data normalized to untreated cells. Statistical significance was calculated by Student’s t-tests. (C) Diagram of the MS experiment. Cells were treated with E and the indicated concentration of dasatinib for 4 hours and subsequently with AF154 for 10 minutes. Cells were then lysed and subjected to mass spectrometry (see Methods). (D) Hierarchical clustering of the entire phosphoproteomics data set of PC9 PAR and AXL KO cells showing the log phosphorylation signal of peptides normalized to the 0 nM dasatinib condition per cell line. (E) Heatmap of dasatinib-responsive phosphosites (DRP). Abl1 and SFK substrates were manually annotated according to PhosphoSitePlus. (F) Ranked GSEA of DRP and DDMC clusters. Peptides were ranked by calculating the cumulative inhibition across increasing dasatinib concentrations. (G) Cluster of phosphosites showing an increased signal in PC9 PAR but decreased phosphorylation in AXL KO cells treated with the indicated concentrations of dasatinib and EA. (I) Cartoon illustrating the effect of dasatinib on AXL downstream signaling. In B and F, *p-value < 0.05, ****p-value < 0.00001, ns means not significant.
Figure 5.
Figure 5.. A high-throughput specificity screen shows that AXL directly phosphorylates FAK1 which in turn regulates C3.
(A) Schematic describing the screen’s workflow. (B–C) AXL-BTN PSSM illustrated by either a heatmap (B) or a logo plot (C). (D) Violin plot showing the NES distribution split by whether a peptide is present in the AXL phosphoproteomics data set (brown) or not (white). (E) Violin plot showing the NES of all AXL MS peptides grouped by cluster. A hypergeometric test was used to calculate the enrichment of top 25% substrates within each cluster. Signs next to significance markers indicate whether clusters are enriched (+) or depleted (−) with top 25% substrates. (F) Ranked AXL substrates by NES. Refer to Supplemental Figure 5E for a selected list of top substrates by cluster. (G) Ranked GSEA of phosphosites of proteins included in the FAK1 pathway signature. Peptides were ranked by calculating the cumulative inhibition across increasing dasatinib concentrations. (H–I) Phosphorylation signal of the FAK1 signature members grouped by either cell line (H) or DDMC cluster (I). Note that the signal of CDK1 Y15-p was multiplied by −1 since it is a known inhibitory site of its kinase activity. (J-K) Pan-FAK1 total protein (I) or phosphorylation (K) in LUAD patient samples stratified by AXL-hi or AXL-low. In D, E, and H-K, statistical significance was calculated using Mann-Whitney U rank tests. *p-value < 0.05, **p-value < 0.001, ***p-value < 0.0001, ****p-value < 0.00001, ns indicates not significant. In J-K, the error bars are defined by the standard error of the mean.
Figure 6.
Figure 6.. AXL promotes the activation and nuclear translocation of YAP which, in turn, regulates AXL expression and kinase activity.
(A) Ranked GSEA analysis of the RNAseq data of the Y-to-F mutant cell lines ranked by the scores of a PCA analysis (see Fig. S6A). (B–C) Total and S126-p YAP levels of (B) PC9 PAR and (C) AXL KO cells with increasing concentrations of dasatinib in addition to EA. (D) Total and S126-p YAP levels of PC9 PAR, AXL KI, and PC9 AXL KO cells seeded at high or low cell density and treated with E or EA. (E–F) YAP immunofluorescence staining in PC9 parental cells under the indicated treatments for 3 days (E) and the corresponding quantification including AXL KO measurements (F). Statistical significance was calculated using a Mann-Whitney U rank test. ****p-value < 0.00001, and ns means not significant. (G) Western blot of total AXL in PC9 cells. (H) Luminex of total and phospho-AXL in PC9 cells. (I) Luminex of phospho-AXL in PC9 PAR and PC9 YAP KO cells treated with E and EA. (J–L) Cell viability assay of PC9 PAR cells treated with the indicated inhibitors for 15 days. Treatment conditions were replaced with media and drug-tolerant persister cells were allowed to regrow for 15 days. Treatment or media were refreshed every 3–5 days. All error bars or regions show the standard error of the mean.
Figure 7.
Figure 7.. AXL-high LUAD tumors display increased YAP activation and EMT markers.
(A) AXL protein levels grouped by EGFR mutational status and tumor stage. (B) Expression of mesenchymal markers by AXL levels. **p-value < 0.001 according to Student’s t-test. (C) Transcriptomic YAP signature in AXL-high vs AXL-low tumors. (D) Illustration of the AXL bypass signaling network identified in this study.

References

    1. Atlanta G., Cancer Facts & Figures 2022. American Cancer Society (2022).
    1. Hospital X., Hu C., Hospital S. X., Zhou C., Wu Y.-L., Chen G., Feng J., Liu X.-Q., Wang C., Zhang S., Wang J., Zhou S., Ren S., Lu S., Zhang L., Hu C., Luo Y., Chen L., Ye M., Huang J., Zhi X., Zhang Y., Xiu Q., Ma J., You C., Erlotinib versus chemotherapy as firstline treatment for patients with advanced EGFR mutation-positive non-small-cell lung cancer (OPTIMAL, CTONG-0802): a multicentre, open-label, randomised, phase 3 study. The Lancet. 12, 735–777 (2011). - PubMed
    1. Ramalingam S. S., Vansteenkiste J., Planchard D., Cho B. C., Gray J. E., Ohe Y., Zhou C., Reungwetwattana T., Cheng Y., Chewaskulyong B., Shah R., Cobo M., Lee K. H., Cheema P., Tiseo M., John T., Lin M.-C., Imamura F., Kurata T., Todd A., Hodge R., Saggese M., Rukazenkov Y., Soria J.-C., Overall Survival with Osimertinib in Untreated, EGFR -Mutated Advanced NSCLC. New England Journal of Medicine. 382, 41–50 (2020). - PubMed
    1. Manole S., Richards E. J., Meyer A. S., JNK pathway activation modulates acquired resistance to EGFR/HER2-targeted therapies. Cancer Res. 76, 5219–5228 (2016). - PMC - PubMed
    1. Wilson T. R., Fridlyand J., Yan Y., Penuel E., Burton L., Chan E., Peng J., Lin E., Wang Y., Sosman J., Ribas A., Li J., Moffat J., Sutherlin D. P., Koeppen H., Merchant M., Neve R., Settleman J., Widespread potential for growth-factor-driven resistance to anticancer kinase inhibitors. Nature. 487, 505–509 (2012). - PMC - PubMed

Publication types