[Preprint]. 2023 Oct 27:2023.10.24.563466.
doi: 10.1101/2023.10.24.563466.

Programs, Origins, and Niches of Immunomodulatory Myeloid Cells in Gliomas

Affiliations

Programs, Origins, and Niches of Immunomodulatory Myeloid Cells in Gliomas

Tyler E Miller et al. bioRxiv. .

Update in

  • Programs, origins and immunomodulatory functions of myeloid cells in glioma.
    Miller TE, El Farran CA, Couturier CP, Chen Z, D'Antonio JP, Verga J, Villanueva MA, Gonzalez Castro LN, Tong YE, Saadi TA, Chiocca AN, Zhang Y, Fischer DS, Heiland DH, Guerriero JL, Petrecca K, Suva ML, Shalek AK, Bernstein BE. Miller TE, et al. Nature. 2025 Apr;640(8060):1072-1082. doi: 10.1038/s41586-025-08633-8. Epub 2025 Feb 26. Nature. 2025. PMID: 40011771 Free PMC article.

Abstract

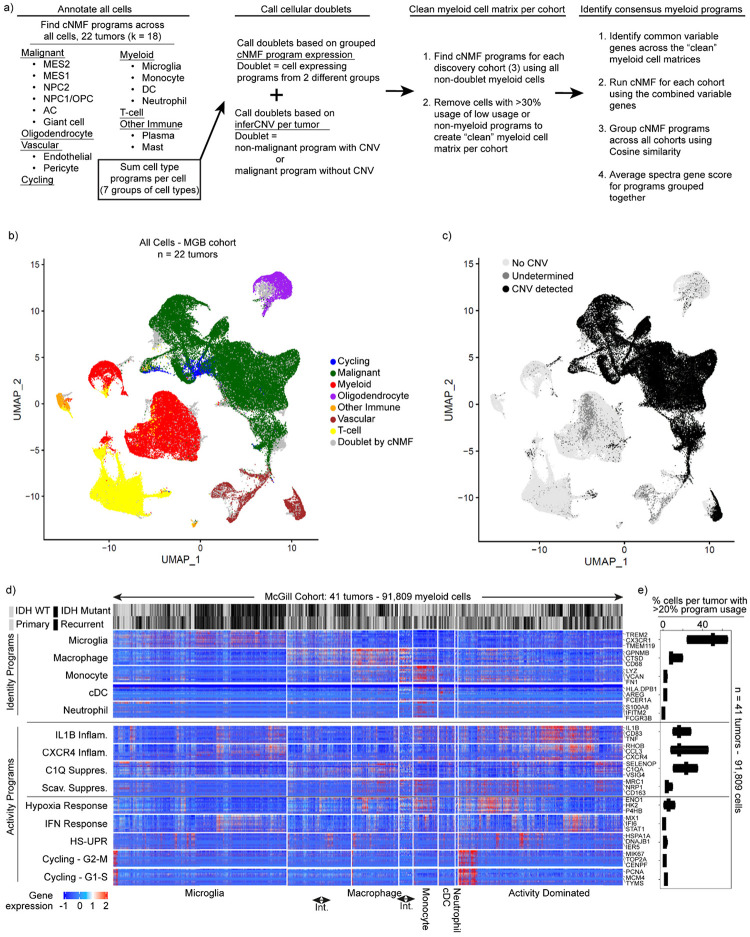
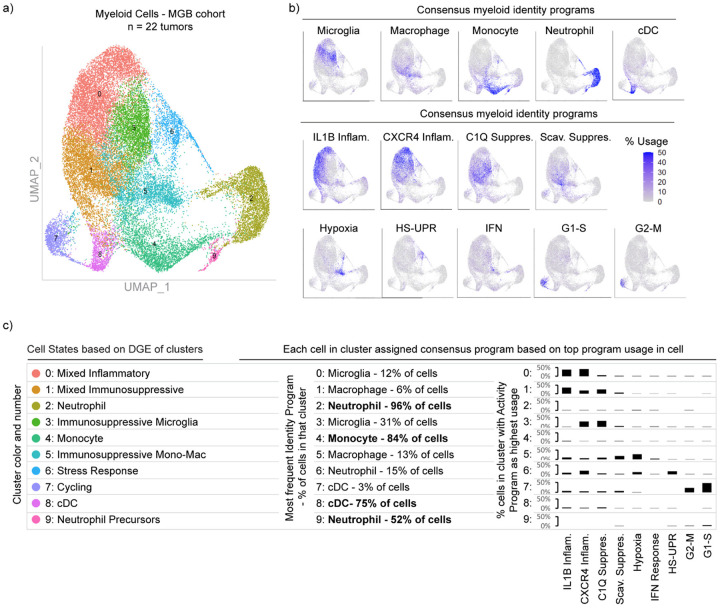
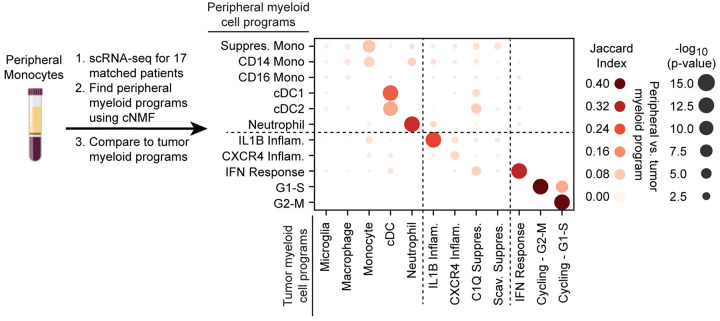
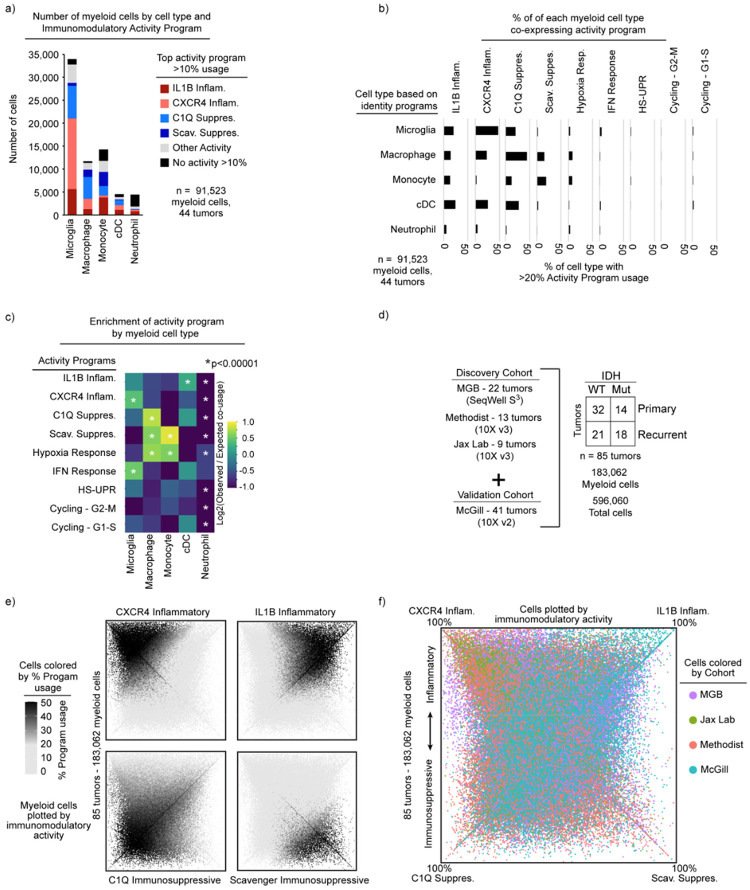
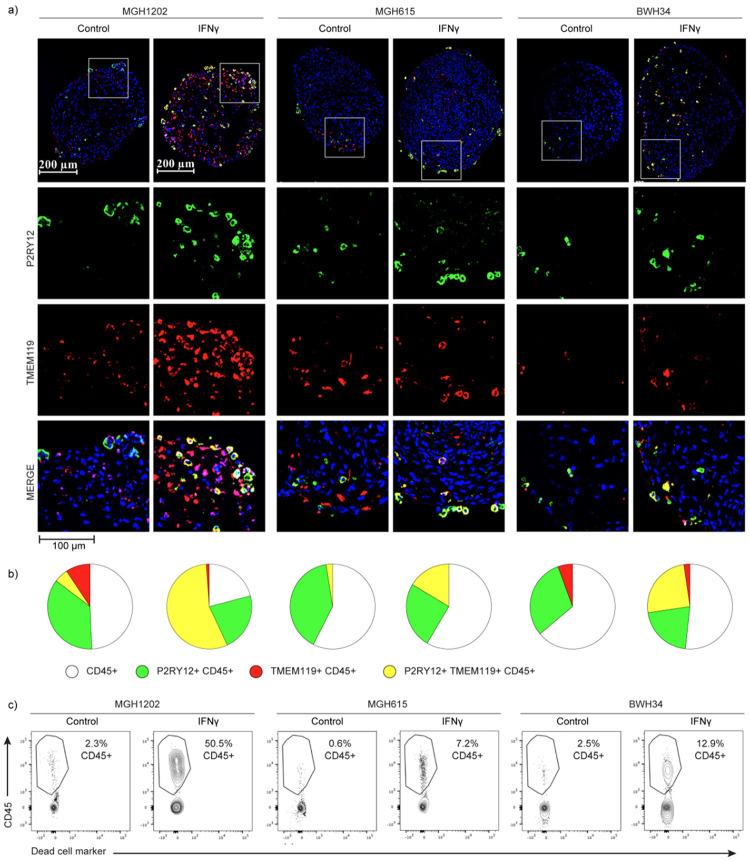
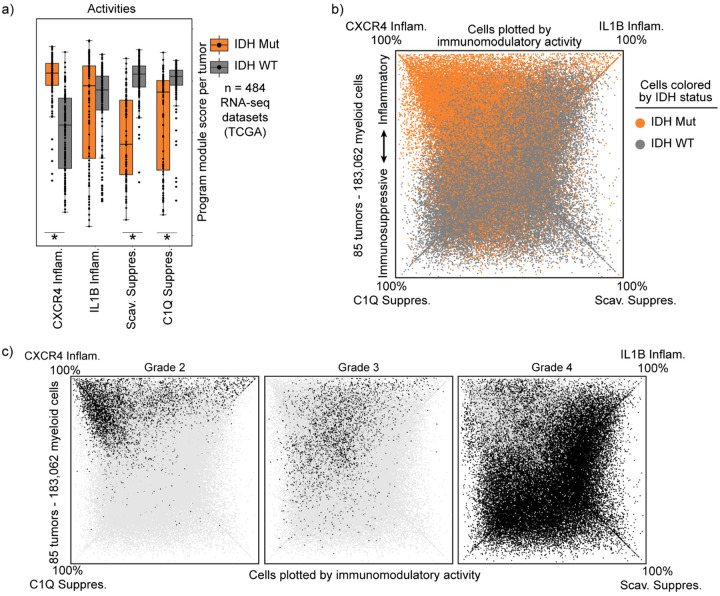
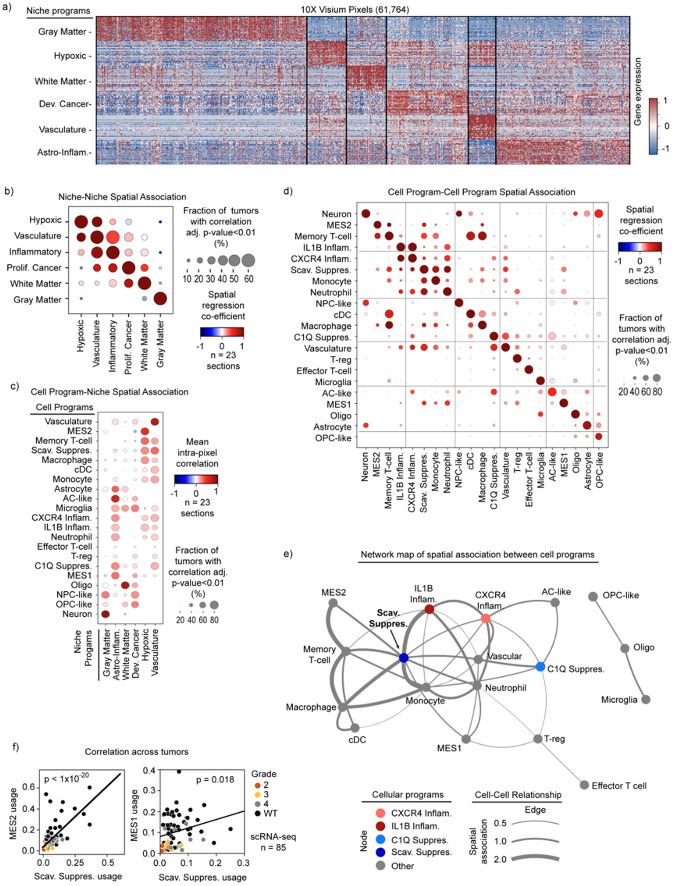
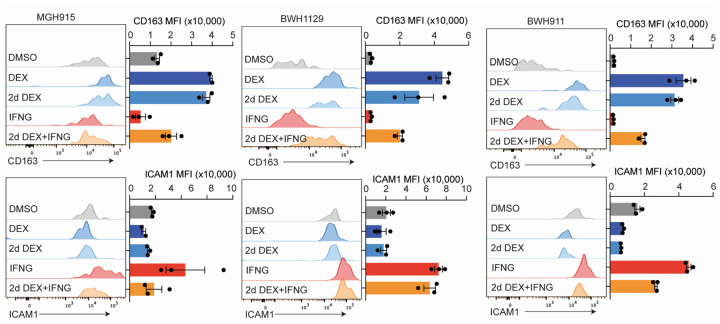
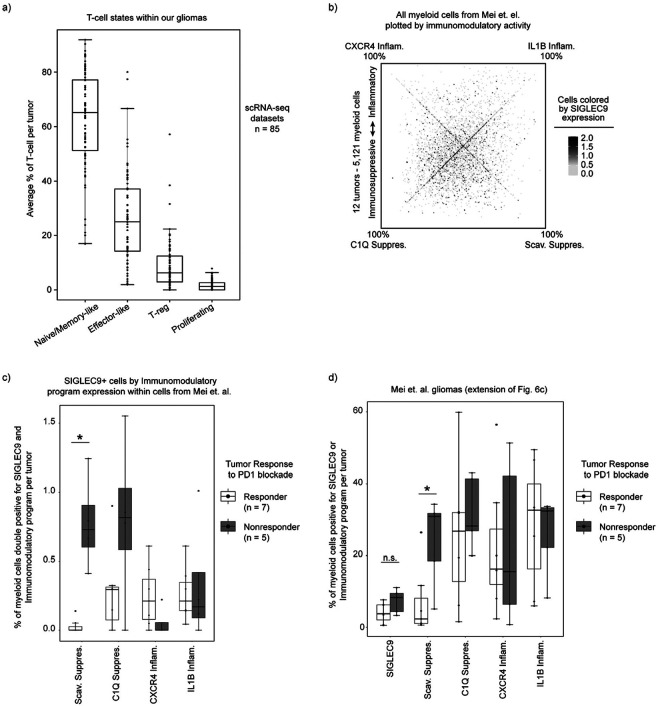
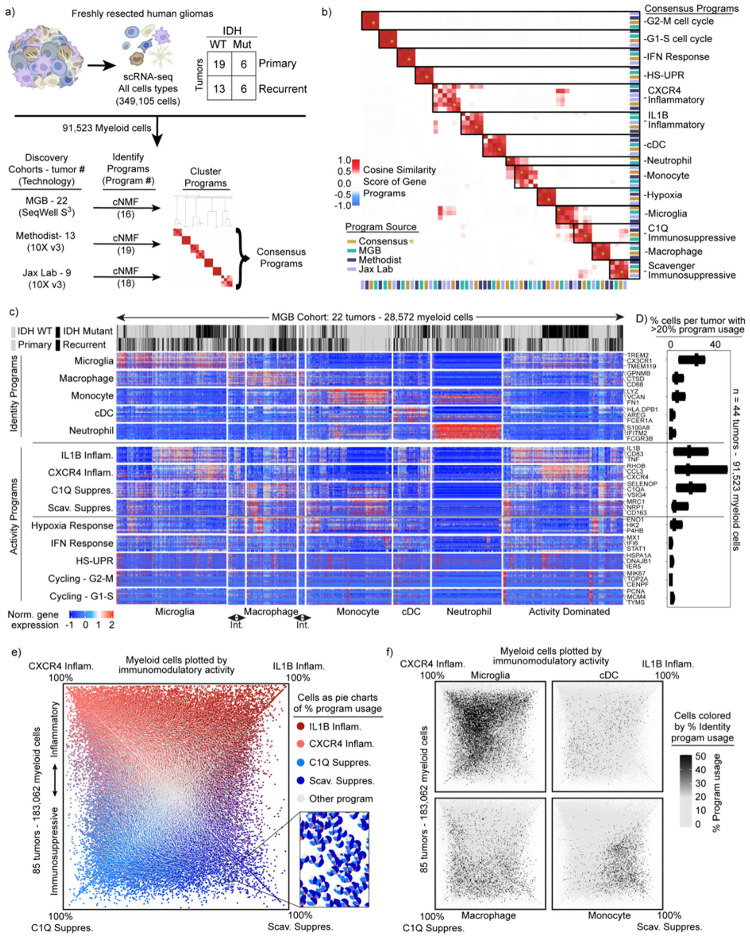
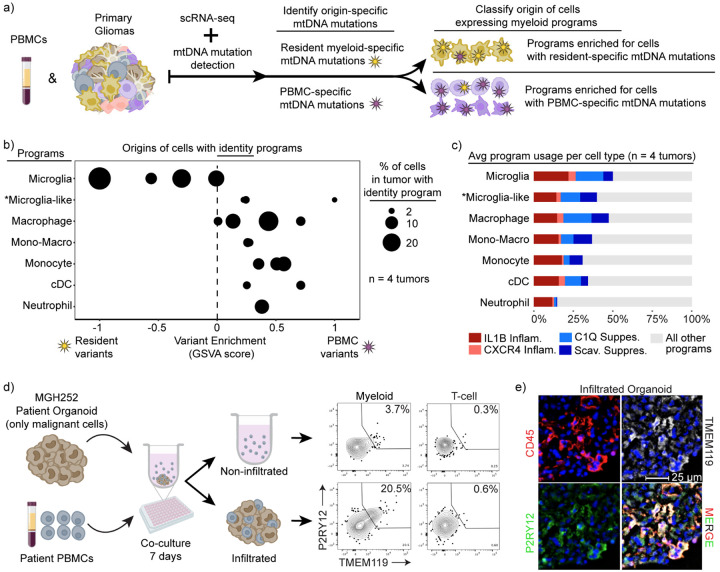
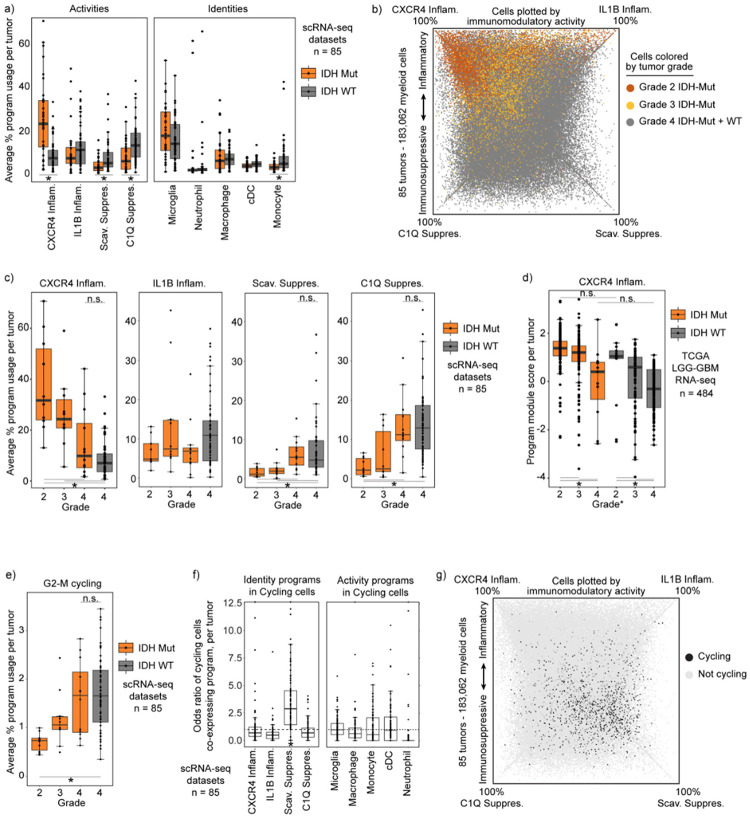
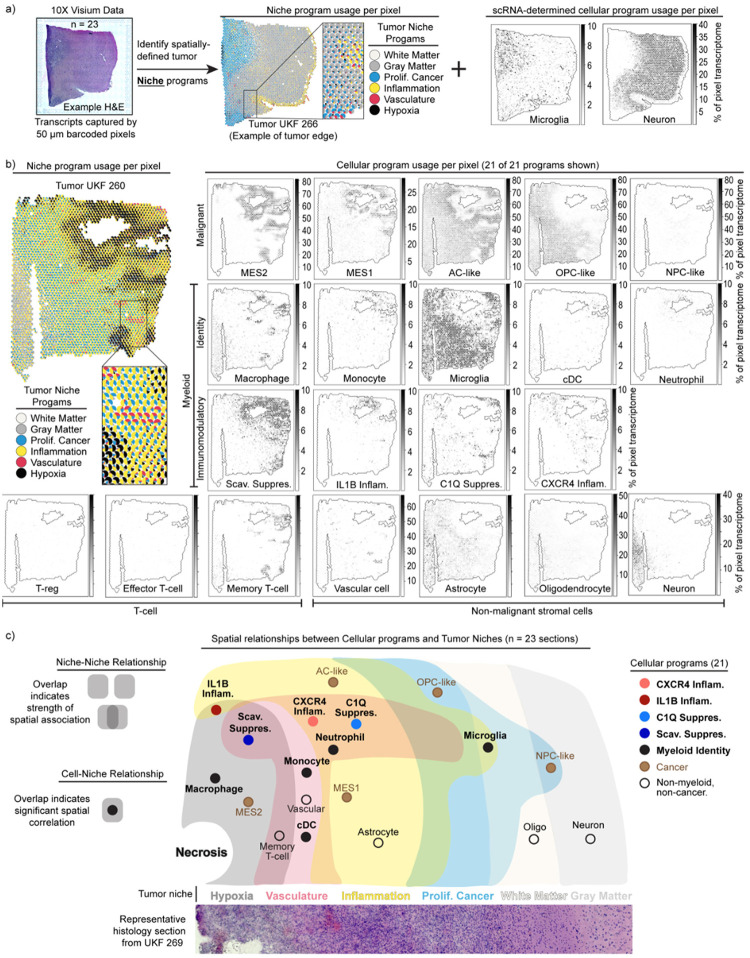
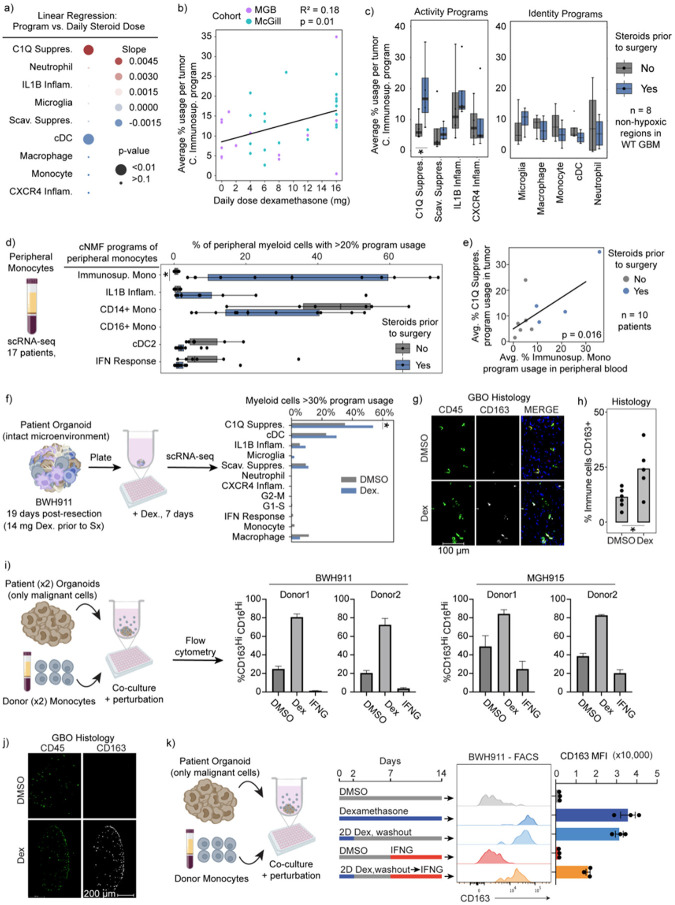
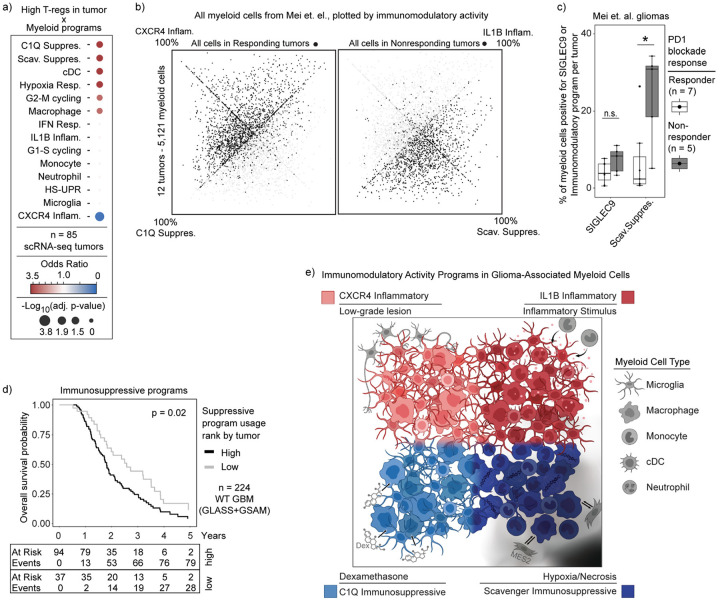
Gliomas are incurable malignancies notable for an immunosuppressive microenvironment with abundant myeloid cells whose immunomodulatory properties remain poorly defined. Here, utilizing scRNA-seq data for 183,062 myeloid cells from 85 human tumors, we discover that nearly all glioma-associated myeloid cells express at least one of four immunomodulatory activity programs: Scavenger Immunosuppressive, C1Q Immunosuppressive, CXCR4 Inflammatory, and IL1B Inflammatory. All four programs are present in IDH1 mutant and wild-type gliomas and are expressed in macrophages, monocytes, and microglia whether of blood or resident myeloid cell origins. Integrating our scRNA-seq data with mitochondrial DNA-based lineage tracing, spatial transcriptomics, and organoid explant systems that model peripheral monocyte infiltration, we show that these programs are driven by microenvironmental cues and therapies rather than myeloid cell type, origin, or mutation status. The C1Q Immunosuppressive program is driven by routinely administered dexamethasone. The Scavenger Immunosuppressive program includes ligands with established roles in T-cell suppression, is induced in hypoxic regions, and is associated with immunotherapy resistance. Both immunosuppressive programs are less prevalent in lower-grade gliomas, which are instead enriched for the CXCR4 Inflammatory program. Our study provides a framework to understand immunomodulatory myeloid cells in glioma, and a foundation to develop more effective immunotherapies.


Conflict of interest statement

Competing interests T.E.M. discloses financial interest in Reify Health, Care Access Research, and Telomere Diagnostics. C.P.C. reports compensation for consulting from Axoft inc. L.N.G.C. reports consulting fees from Elsevier, Oakstone Publishing and BMJ Best Practice, and research funding from Merck & Co (to DFCI). J.L.G. is consultant/serves on the Scientific Advisory Board of Array BioPharma, AstraZeneca, BD Biosciences, Carisma, Codagenix, Duke Street Bio, GlaxoSmithKline, Kowa, Kymera, OncoOne, and Verseau Therapeutics, and receives research support from Array BioPharma/Pfizer, Eli Lilly, GlaxoSmithKline, and Merck. M.L.S. is an equity holder, scientific co-founder and advisory board member of Immunitas Therapeutics. A.K.S. reports compensation for consulting and/or scientific advisory board membership from Honeycomb Biotechnologies, Cellarity, Ochre Bio, Relation Therapeutics, FL86, IntrECate Biotherapeutics, Senda Biosciences and Dahlia Biosciences unrelated to this work. B.E.B. discloses financial interests in Fulcrum Therapeutics, HiFiBio, Arsenal Biosciences, Chroma Medicine, Cell Signaling Technologies, and Design Pharmaceuticals.

Figures

Extended Data Fig. 1:
Extended Data Fig. 1:. Identification of consensus myeloid programs and validation
a) Schematics of the computational pipeline for the identification of the recurrent myeloid programs across the scRNA-Seq libraries of the three discovery cohorts. b) UMAP of the broad annotation of all cells in the MGB cohort according to the key. c) UMAP demonstrating the presence (black) or absence (gray) of copy number variation events in all cells of the MGB cohort tumors. d) Heatmaps demonstrating the expression of genes in recurrent myeloid programs (rows) by cell (column) grouped by cell type. Cell usage of myeloid identity programs was used to define myeloid cell type e) Boxplots exhibiting the percentage of cells by sample expressing the recurrent myeloid programs indicated on the left of the heatmap across the validation cohort.
Extended Data Fig. 2:
Extended Data Fig. 2:. Direct comparison of Louvain clustering and cNMF programs
a) UMAP exhibiting the Louvain clusters of batch-corrected singlet myeloid cells of the MGB cohort. b) UMAPs of the myeloid cells of the MGB cohort demonstrating the usage of indicated programs at the top of each UMAP. c) (left) Annotations of Louvain clusters in (a) based on standard differential gene expression analysis of clusters. (Center) Name and frequency of most frequent cell type in the Louvain cluster as annotated by cNMF identity programs. (Right) bar chart of the percent of cells in the Louvain cluster with a given activity program as top program used in that cell, based on cNMF programs.
Extended Data Fig. 3:
Extended Data Fig. 3:. Identification and comparison of peripheral myeloid cNMF program to tumor cNMF programs.
(Left) Schematic of peripheral myeloid cell program identification. (Right) Dot plot of Jaccard Index between peripheral myeloid cNMF programs and tumor cNMF programs.
Extended Data Fig. 4:
Extended Data Fig. 4:. Activity program usage among myeloid cell types.
a) Stacked bar plots of absolute number of cells with activity program usage per myeloid cell type. b) Horizontal bar chart of percent of cell type with >20% activity program usage. c) Enrichment plot demonstrating the enrichment level of the four immunomodulatory programs (left) in the shown identities (above). d) Schematics demonstrating the inclusion of the McGill Validation cohort in all subsequent analyses. e) Quadrant plots in which the color represents the usage level of the indicated immunomodulatory program. f) Quadrant plot in which the color represents the cohort from which the myeloid cell comes. The position of each dot represents the difference in the usage of immunosuppressive and inflammatory programs by that cell (the upper part of the plot is more inflammatory, vs. the lower part is more immunosuppressive).
Extended Data Fig. 5:
Extended Data Fig. 5:. Peripheral monocytes differentiate to express microglia markers in tumor microenvironment, which is potentiated by interferon
a) Representative immunofluorescence images of organoid sections from experiments related to Fig. 2d,e. b) Quantification of images in (a). c) Flow cytometry results of percent of CD45+ cells infiltrating into the organoids. Results are from multiple organoids mixed together for each condition.
Extended Data Fig 6:
Extended Data Fig 6:. Program composition varies with histopathological tumor grade more than IDH-mutation status.
a) Box plot exhibiting the program module scores in tumors of the TCGA cohort. Each dot represents a tumor. * FDR-corrected Wilcoxon Rank-Sum Test p-value < 0.05. b) Quadrant plot exhibiting the IDH mutation status of the tumors from which the myeloid cells come. c) Quadrant plots exhibiting the grade of the tumors from which the myeloid cells come. Black denotes that the myeloid cell comes from a tumor with the grade displayed at the top of each quadrant plot, whereas grey indicates not that grade.
Extended Data Fig. 7:
Extended Data Fig. 7:. Spatial associations of cells and niches in glioma
a) Heatmap shows gene (rows) expression across all pixels (columns) in the cohort of spatial transcriptomic samples. Top 40 genes of each niche program are shown. Gene expression data is cell normalized, then log normalized and scaled by variance. b) Dot plot displays the spatial proximity enrichment score between niche programs, calculated independently per sample (see Methods for details). Dot size denotes the proportion of samples showing a significant correlation (p-adj < 0.01), while color signifies a positive (red) or negative (blue) correlation. c) Dot plot represents intra-pixel correlation between niche and cell type scores, calculated independently for each sample. Dot size shows the proportion of samples with a statistically significant correlation (p-adj<0.01), while color indicates a positive (red) or negative (blue) correlation. d) Dot plot displays the spatial proximity enrichment score between cell programs, calculated independently per sample. e) Network graph illustrates recurrent spatial relationships of tumor cell types across spatial transcriptomic samples. Nodes denote cell types, with edges marking significantly enriched proximities between cell types, observed in at least 40% of samples with an average enrichment score of at least 0.1. Edge width reflects this average score. f) Scatter plot exhibits the mean Scavenger Immunosuppressive program score (x-axis) versus the MES2 or MES1 cancer program score (y-axis) in the scRNA-seq dataset. Linear least square results are shown (line, and p-value).
Extended Data Fig. 8:
Extended Data Fig. 8:. Additional patient organoid models show irreversible phenotype.
Flow cytometry results with organoids from multiple patients show the same phenotype as Fig. 5k. Bottom row shows ICAM1, a marker of the IL1B Inflammatory program.
Extended Data Fig. 9:
Extended Data Fig. 9:. Comparison of SIGLEC9 and Immunomodulatory programs in relation to immunotherapy resistance.
a) Boxplot of percent of T cell state per tumor from our scRNA-seq datasets. b) Quadrant plot of cells from Mei et. al., plotted based on expression of our immunomodulatory activity programs, highlighting SIGLEC9 expression heterogeneity. c) Boxplot of SIGLEC9-positive cells from Mei et. al. that were grouped by expression of our immunomodulatory programs, then divided by corresponding tumor response to immunotherapy. Average per tumor plotted. d) Boxplot of per tumor calculation of SIGLEC9-positive cells or Scavenger Immunosuppressive program usage > 20%.
Fig. 1:
Fig. 1:. Identification of consensus superimposable myeloid cell identity and cell activity programs.
a) Schematics of the analysis pipeline for identifying the recurrent myeloid programs across the three discovery glioma cohorts. b) Heatmap demonstrating the cosine similarity indices of the gene spectra scores of each program in the three discovery cohorts. c) Heatmaps demonstrating the expression of genes in recurrent myeloid programs (rows) by cell (column) grouped by cell type. Cell type defined by usage of myeloid identity programs. d) Box plots exhibiting the percentage of cells by sample expressing the recurrent myeloid programs indicated on the left of the heatmap across the three discovery cohorts. Int. = intermediate cells expressing adjacent identity programs. e) Quadrant plot of myeloid cells from the discovery and validation cohorts. Coordinates of cell determined by: (CXCR4 - Scav. program usage), (IL1B - C1Q program usage). Axes are diagonal. Each dot is a pie chart exhibiting the prevalence of the four indicated immunomodulatory programs in that cell. f) Quadrant plots displaying myeloid cell identify usage per cell.
Fig. 2:
Fig. 2:. Convergent phenotypes of microglia- and bone marrow-derived myeloid cells in glioma.
a) Schematics of the MAESTER analysis pipeline for determining the origin of myeloid cells in the glioma microenvironment. b) Dot plot exhibiting the enrichment difference between PBMC-specific and Resident-specific variants. Each dot represents the enrichment level of the indicated identities (left) in each patient. X-axis denotes the scaled difference between GSVA enrichment of PBMC-specific variants and Resident variants. c) Stacked bar charts indicating the average usage of the indicated myeloid programs in the key across the four patients. The “other programs” category encompasses the other identities and activities. d) Schematic (left) and flow cytometry plots (right) of myeloid cells from indicated condition. T cells are used as gating control for P2RY12 and TMEM119. e) Immunofluorescence image showing matched patient derived PBMC cells infiltrated into a glioblastoma organoid.
Fig. 3:
Fig. 3:. Immunomodulatory program composition varies with histopathological tumor grade.
a) Boxplot exhibiting the average usage of the indicated activity or identity programs. *FDR-corrected Wilcoxon Rank-Sum Test p-value < 0.01. b) Quadrant plot exhibiting myeloid cells colored the grades of the associated tumors. c) Boxplot showing the average usage of each program by histopathological tumor grade. d) Boxplot showing module score calculated per tumor in the TCGA LGG-GBM dataset. Score derived using CXCR4 program gene set. e) Boxplot similar to (c) but with cycling program usage. f) Boxplot showing the odds ratio of cycling in each myeloid cell state, calculated independently for each tumor. ‘Cycling’ and program defined by a cell usage >20% of both cycling and indicated program. Increased odds *p<0.05 g) Quadrant plot illustrating cycling cell distribution among programs.
Fig. 4:
Fig. 4:. Spatial transcriptomics associates immunomodulatory programs with tumor niches.
a) Schematic illustrates the dual analysis approach for spatial transcriptomics samples: cNMF defines broad transcriptomic niches, and RCTD demultiplexes cell content by pixel based on scRNA-seq signatures. The middle and right plots were generated in an identical manner as those in Fig. 4b. b) Scatterpie plot (left) of 10X Visium section. Each pie chart represents a pixel. Scatter plot (right) of the same section. Colors show the RCTD-predicted pixel proportions for adjacent cell types. c) Cell-niche map illustrates conserved spatial relationships of tumor cell types and their ties to transcriptomic niches across spatial transcriptomic samples.
Fig. 5:
Fig. 5:. Dexamethasone drives the C1Q Immunosuppressive program.
a) Dot plot displays the linear regression coefficient between each myeloid program’s average usage per sample and the respective patient’s pre-surgery daily dexamethasone dose, using only IDH-WT samples. b) Scatterplot of mean C1Q Immunosuppressive program with least-square linear regression line. c) Boxplot displays the average usage of programs stratified by use of dexamethasone in IDH-WT tumors with low hypoxic program usage in the MGB cohort. d) Boxplot of the percent of myeloid cells with the indicated peripheral myeloid programs in peripheral myeloid cells from patients with gliomas. e) Scatterplot illustrates the average C1Q Immunosuppressive usage in myeloid cells of tumor samples versus average Immunosuppressive Monocyte usage in related peripheral myeloid cells. Only tumors with low hypoxic program usage are considered. f) Schematic (left) and bar graph (right) of the percentage of myeloid cells expressing the C1Q Immunosuppressive program. P-value obtained using Fisher’s Exact test. * p-value <0.05, all others have p-value > 0.2. g) Immunofluorescence image of a GBO with intact endogenous TME co-cultured for 7 days with DMSO or 100 nM dexamethasone. h) Quantification of marker positive cells in sectioned organoids. Each dot represents an organoid in the condition. Student’s T-test p<0.05. i) Schematic (left) and bar plot of flow cytometry results from experiment. Error bars St. Dev. j) Representative section of organoid and infiltrated monocytes when treated with dexamethasone. k) (left) Schematic of experimental design. (right) Flow cytometry results. Error bars St. Dev. Unless otherwise indicated *FDR-corrected Wilcoxon Rank-Sum Test p-value < 0.05.
Fig. 6:
Fig. 6:. Immunosuppressive programs associated with immunotherapy resistance and worse overall survival.
a) Dot plot displaying the odds ratio for high program expression in tumors with high T-reg abundance. b) Quadrant plot of cells from Mei et. al., plotted based on expression of our immunomodulatory activity programs, highlighting cells in tumors with response or nonresponse to immunotherapy. c) Boxplot of per tumor calculation of SIGLEC9-positive cells or Scavenger Immunosuppressive program usage > 20%. d) Kaplan-Meyer curve of overall survival by combined immunosuppressive program expression. P-value calculated using the Cox proportional hazards regression model. e) Summary figure.

References

    1. Neftel C. et al. An Integrative Model of Cellular States , Plasticity , and Genetics for Glioblastoma Article An Integrative Model of Cellular States , Plasticity , and Genetics for Glioblastoma. Cell 835–849 (2019). - PMC - PubMed
    1. Ceccarelli M. et al. Molecular Profiling Reveals Biologically Discrete Subsets and Pathways of Progression in Diffuse Glioma. Cell 164, 550–563 (2016). - PMC - PubMed
    1. Couturier C. P. et al. Single-cell RNA-seq reveals that glioblastoma recapitulates a normal neurodevelopmental hierarchy. Nat. Commun. 11, 1–19 (2020). - PMC - PubMed
    1. Venteicher A. S. et al. Decoupling genetics, lineages, and microenvironment in IDH-mutant gliomas by single-cell RNA-seq. Science (2017) doi:10.1126/science.aai8478. - DOI - PMC - PubMed
    1. Garofano L. et al. Pathway-based classification of glioblastoma uncovers a mitochondrial subtype with therapeutic vulnerabilities. Nat Cancer 2, 141–156 (2021). - PMC - PubMed

Publication types