[Preprint]. 2025 Mar 13:2023.10.26.564041.
doi: 10.1101/2023.10.26.564041.

A Latent Activated Olfactory Stem Cell State Revealed by Single-Cell Transcriptomic and Epigenomic Profiling

Affiliations

A Latent Activated Olfactory Stem Cell State Revealed by Single-Cell Transcriptomic and Epigenomic Profiling

Koen Van den Berge et al. bioRxiv. .

Abstract

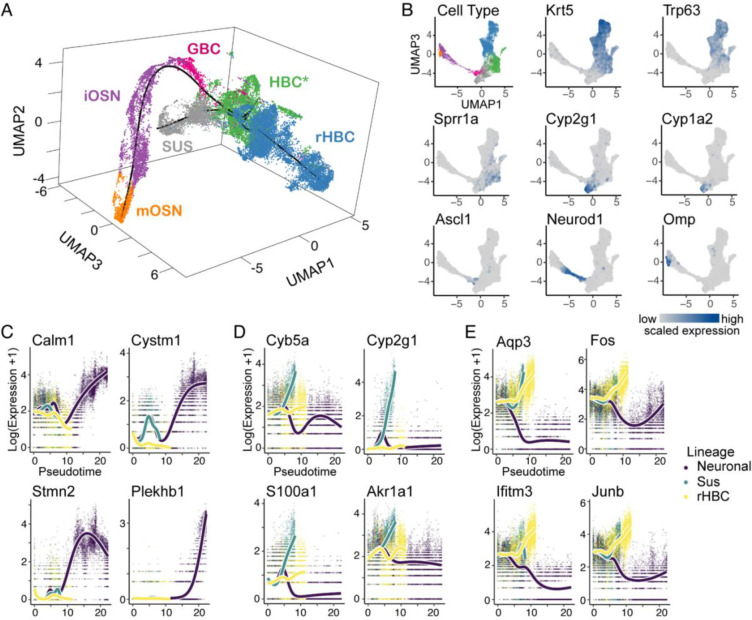
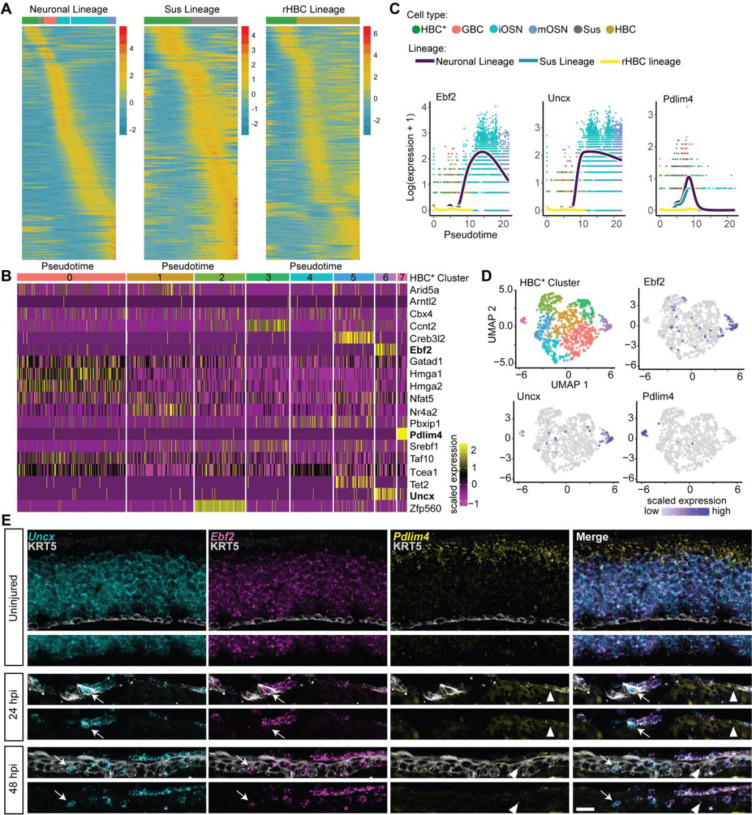
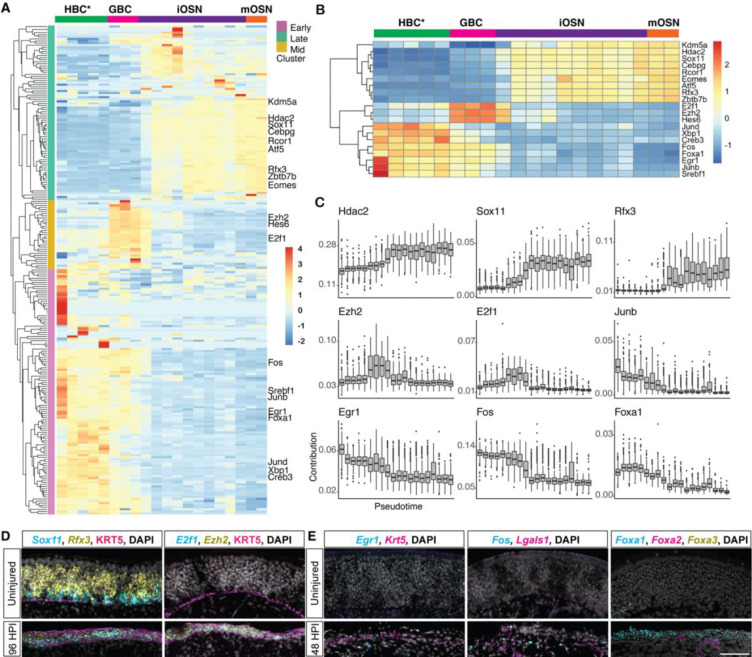
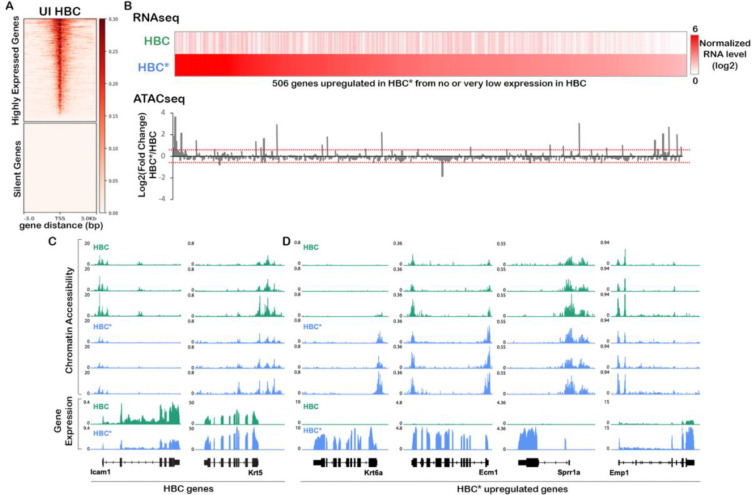
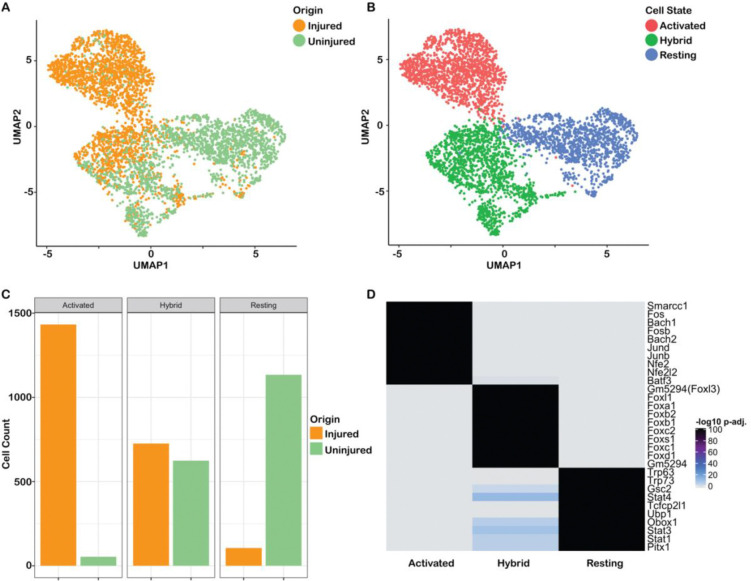
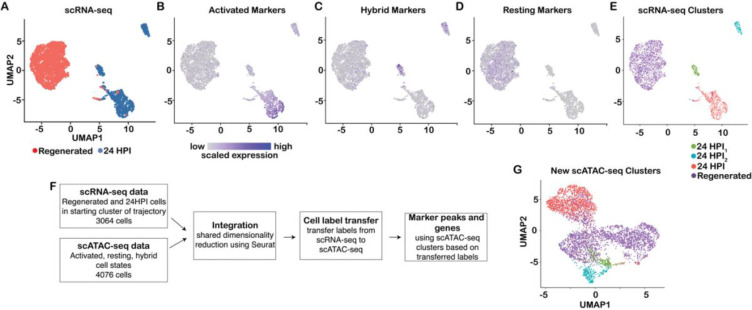
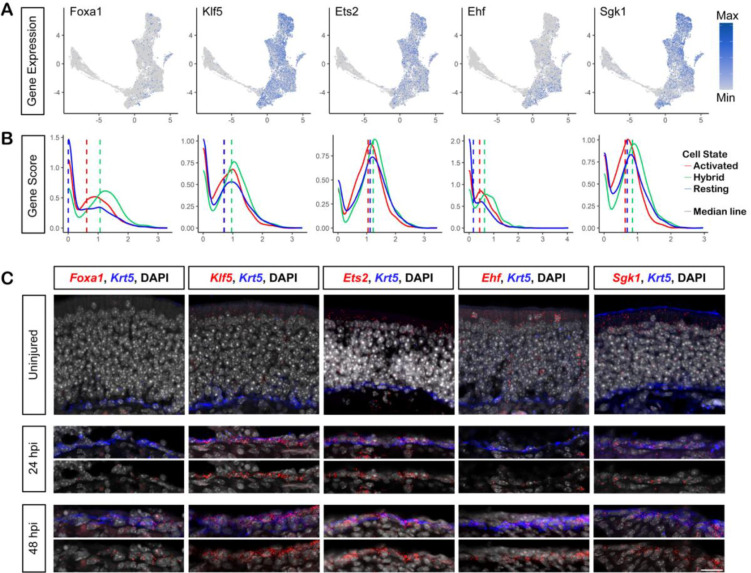
The olfactory epithelium is one of the few regions of the nervous system that sustains neurogenesis throughout life. Its experimental accessibility makes it especially tractable for studying molecular mechanisms that drive neural regeneration in response to injury. In this study, we used single-cell sequencing to identify the transcriptional cascades and epigenetic processes involved in determining olfactory epithelial stem cell fate during injury-induced regeneration. By combining gene expression and accessible chromatin profiles of individual lineage-traced olfactory stem cells, we identified transcriptional heterogeneity among activated stem cells at a stage when cell fates are being specified. We further identified a subset of resting cells that appears poised for activation, characterized by accessible chromatin around wound response and lineage-specific genes prior to their later expression in response to injury. Together these results provide evidence for a latent activated stem cell state, in which a subset of quiescent olfactory epithelial stem cells are epigenetically primed to support injury-induced regeneration.


Figures

Figure 1:
Figure 1:
Trajectory inference and differential expression analysis of lineage-traced scRNA-seq data. (A) Inferred trajectory in 3D UMAP space, with cells colored according to cell type. Starting from the HBC* population, the trajectory consists of three lineages developing into rHBC, Sus, and mOSN cells. (B) Cells in 2D UMAP space, colored according to cell type (top left panel) or the expression of known markers (all other panels), grey denoting no/low expression and blue denoting high expression. (C-E) Markers for each lineage identified by differential expression for the neuronal (C), sustentacular (D), and rHBC lineage (E).
Figure 2:
Figure 2:
Activated HBCs transiently express lineage-enriched transcription factors. (A) Inferred transcription factor (TF) expression cascade for each of the three lineages in the trajectory. Heatmaps of fitted expression measures from tradeSeq, where the x-axis for each panel represents 100 equally wide pseudotime bins for a given lineage, and the most abundant cell type in each bin is indicated using the colorbar at the top of the heatmap (colors correspond to the key in C; If there are too few cells in a bin, no color is provided). Each row in each heatmap represents the expression of a TF normalized to zero mean and unit variance within a lineage. The TFs are ordered according to the pseudotime of their most significant peak, uncovering a TF activity cascade within each lineage. (B) Heatmap of the expression of “shared” TFs in activated HBCs clustered on the expression of these 19 TFs. Each row represents the scaled expression of a TF, and the colorbar at the top of the heatmap indicates the cluster label. (C) Expression of Ebf2, Uncx, and Pdlim4 (left to right) in each lineage over pseudotime as visualized using tradeSeq. (D) Activated HBCs represented in the heatmap in B plotted in 2D UMAP space and colored according to cluster (left) or the expression level of the TF indicated. (E) Fluorescent in-situ hybridization (FISH) of Ebf2, Uncx, and Pdlim4 in sections of uninjured, 24 HPI, and 48 HPI OE. Ebf2 is shown in magenta, Uncx in cyan, and Pdlim4 in yellow. Immunohistochemistry using an antibody to KRT5 to mark HBCs is shown in grey.
Figure 3:
Figure 3:
Deconvolution of gene expression reveals dynamic TF activity along the mOSN lineage. (A) Clustered heatmap of scaled activity for TFs (rows) that are differentially active along the mOSN lineage. The x-axis represents pseudotime and the dominant cell type in each pseudotime bin is indicated at the top of the heatmap. Hierarchical clustering revealed three groups of TFs: early (mauve), mid (amber), and late (green). (B) Clustered heatmap of scaled TF activity for the 20 most variable TFs. (C) Change in TF activity over pseudotime for representative TFs from each cluster. (D) Fluorescent in situ hybridization (FISH) of Sox11 (cyan), and Rfx3 (yellow) or E2f1 (cyan) and Ezh2 (yellow) showing increased expression in regenerating OE at 96 HPI. HBCs were identified with an antibody to KRT5 (magenta) and nuclei with DAPI (grey). (E) FISH of two TFs active at the HBC* stage, Egr1 and Fos (cyan), showing increased expression in activated HBCs (high Krt5 or Lgals1, magenta) at 48 HPI compared with before injury, and FISH of Foxa1 (cyan), Foxa2 (magenta), and Foxa3 (yellow) showing increased expression of Foxa1 in basal cells at 48 HPI (magenta, yellow signal is non-specific). Nuclei labeled with DAPI (grey). Scale bar in E for D,E = 50 microns
Figure 4.
Figure 4.
Early response genes are primed for activation at the chromatin level. (A) Heatmaps of ATAC-seq read counts from uninjured (UI) HBCs around the TSS of highly expressed genes (top) or silent olfactory receptor genes (bottom). (B) Heatmap of normalized bulk gene expression values (average RPKM of two biological replicates) in uninjured HBCs versus injured HBCs (HBC*) for the top 506 genes that are upregulated in HBCs after injury, with genes ordered from left to right according to descending expression in injured HBCs (top). Bar graph showing the log2(fold-change) in chromatin accessibility after injury relative to before injury (bottom), where dotted lines indicate log2(fold-change) of 0.5 and −0.5. (C,D) ATAC-seq (top) and bulk RNA-seq (bottom) read counts before (green) and after (blue) injury around genes that are known to decrease (Icam1) or increase (Krt5) in expression in injured HBCs (C) and wound response genes (Krt6a, Ecm1, Sprr1a, and Emp1) (D).
Figure 5:
Figure 5:
scATAC-seq data uncover three HBC states. (A-B) UMAP dimensionality reduction of the scATAC-seq data; cells are colored according to origin (A) or according to state (B). (C) Barplot visualizing the number of (un)injured cells in each cluster. (D) Heatmap (unclustered) showing the Benjamini-Hochberg FDR adjusted p-values for testing the null hypothesis of no enrichment, of the top 10 enriched TF motifs (rows) for each cell state (columns). The heatmap clearly illustrates that the three sets of TFs are high/insignificant (grey) in specific HBC groups and low/significant (black) in others.
Figure 6:
Figure 6:
Integration of scRNA-seq and scATAC-seq data. (A-D) scRNA-seq data of activated and regenerated HBCs visualized in UMAP space. (A) scRNA-seq data with cells colored according to cell type. (B-D) scRNA-seq data with cells colored according to expression of genes that were found to be markers for each of the three cell states identified using scATAC-seq gene activity scores. ‘Activated’ and ‘Resting’ genes identified using scATAC-seq are correspondingly upregulated in scRNA-seq data for activated cells (B) and regenerated cells (D), while ‘Hybrid’ genes are upregulated in the two small activated subclusters (C). The expression values were first scaled within each gene to have zero mean and unit variance across all cells, upon which the scaled expression was summed across genes within each cell. (E) scRNA-seq data with cells colored according to cell state. (F) Workflow for cell label transfer from scRNA-seq to scATAC-seq data. First, Seurat was applied to integrate the scRNA-seq and scATAC-seq data by shared dimensionality reduction using canonical correlation and to transfer the scRNA-seq cell labels to the scATAC-seq dataset. Next, the transferred labels are used to define marker peaks and genes in the scATAC-seq dataset. (G) scATAC-seq data with cells colored according to cell state predicted by transferring cell labels from scRNA-seq data.
Figure 7:
Figure 7:
Genes proximal to regions of differentially accessible chromatin in hybrid cells are upregulated following injury. (A) Cells in 2D UMAP space, colored according to the expression of selected genes proximal to hybrid cell differentially accessible chromatin, gray denoting no/low expression and blue denoting high expression. The cells at the upper right of the UMAP represent the rHBC lineage, the extended arc of cells toward the left the neuronal lineage, and the cells at the bottom the sustentacular lineage. (B) Density plots of normalized gene activity scores for lineage-specific genes in resting (blue), hybrid (green), and activated HBCs. (C) Fluorescent in-situ hybridization (FISH) for each gene in (top to bottom) uninjured OE, 24 hours post injury and 48 hours post injury. FISH for each gene shown in red, Krt5 immunohistochemistry shown in blue, and DAPI in grey. Scale bar = 20μM.

Similar articles

References

    1. Aibar Sara, González-Blas Carmen Bravo, Moerman Thomas, Huynh-Thu Vân Anh, Imrichova Hana, Hulselmans Gert, Rambow Florian, et al. 2017. “SCENIC: Single-Cell Regulatory Network Inference and Clustering.” Nature Methods 14 (11): 1083–86. - PMC - PubMed
    1. Azuara Véronique, Perry Pascale, Sauer Stephan, Spivakov Mikhail, Jørgensen Helle F., John Rosalind M., Gouti Mina, et al. 2006. “Chromatin Signatures of Pluripotent Cell Lines.” Nature Cell Biology 8 (5): 532–38. - PubMed
    1. Bell Sheila M., Zhang Liqian, Xu Yan, Besnard Valerie, Wert Susan E., Shroyer Noah, and Whitsett Jeffrey A.. 2013. “Kruppel-like Factor 5 Controls Villus Formation and Initiation of Cytodifferentiation in the Embryonic Intestinal Epithelium.” Developmental Biology 375 (2): 128–39. - PMC - PubMed
    1. Benjamini Yoav, and Hochberg Yosef. 1995. “Controlling the False Discovery Rate: A Practical and Powerful Approach to Multiple Testing.” Journal of the Royal Statistical Society. Series B, Statistical Methodology 57 (1): 289–300.
    1. Bernstein Bradley E., Mikkelsen Tarjei S., Xie Xiaohui, Kamal Michael, Huebert Dana J., Cuff James, Fry Ben, et al. 2006. “A Bivalent Chromatin Structure Marks Key Developmental Genes in Embryonic Stem Cells.” Cell 125 (2): 315–26. - PubMed

Publication types