[Preprint]. 2024 May 11:2023.10.20.563322.
doi: 10.1101/2023.10.20.563322.

Presynaptic inhibition selectively suppresses leg proprioception in behaving Drosophila

Affiliations

Presynaptic inhibition selectively suppresses leg proprioception in behaving Drosophila

Chris J Dallmann et al. bioRxiv. .

Abstract

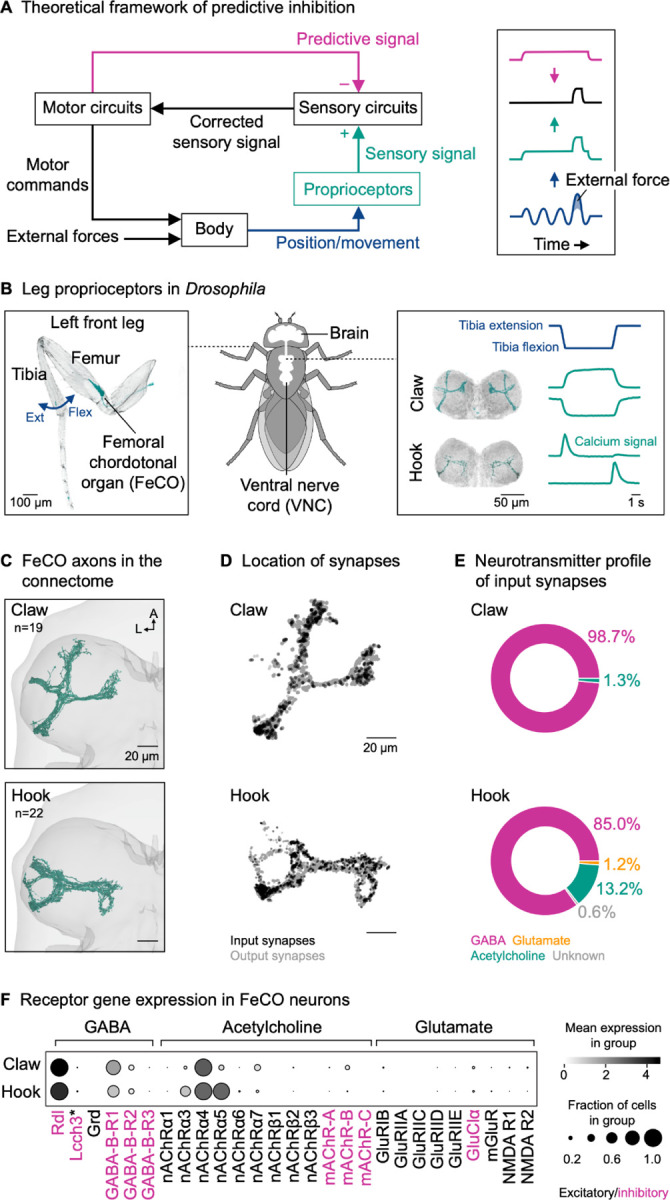
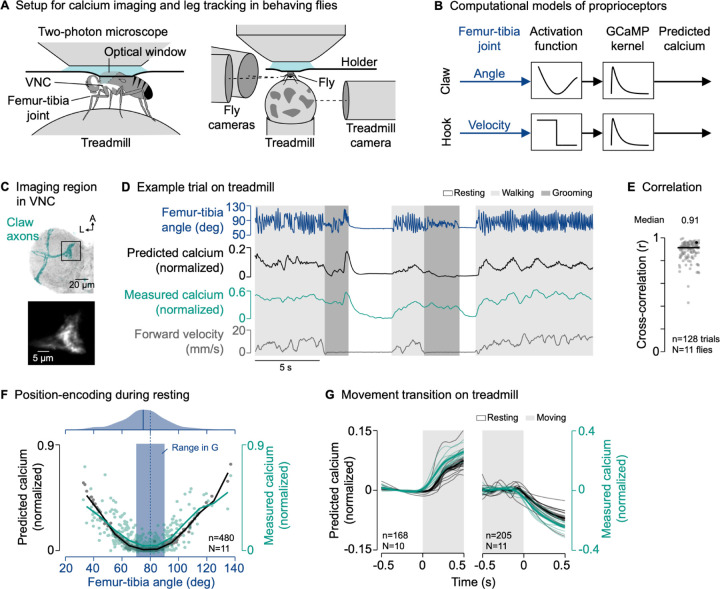
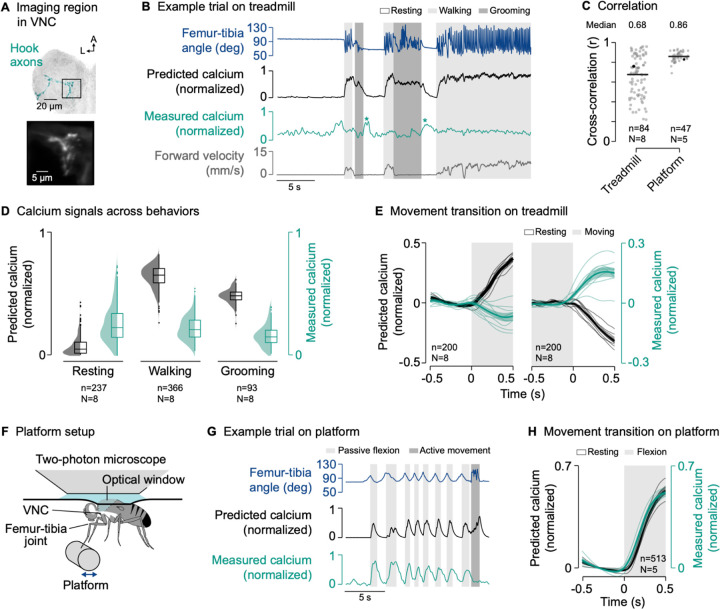
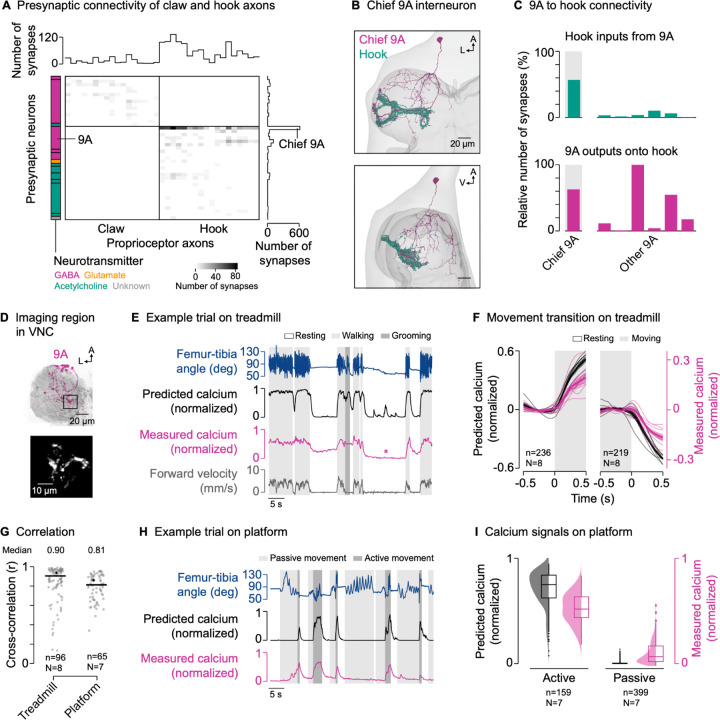
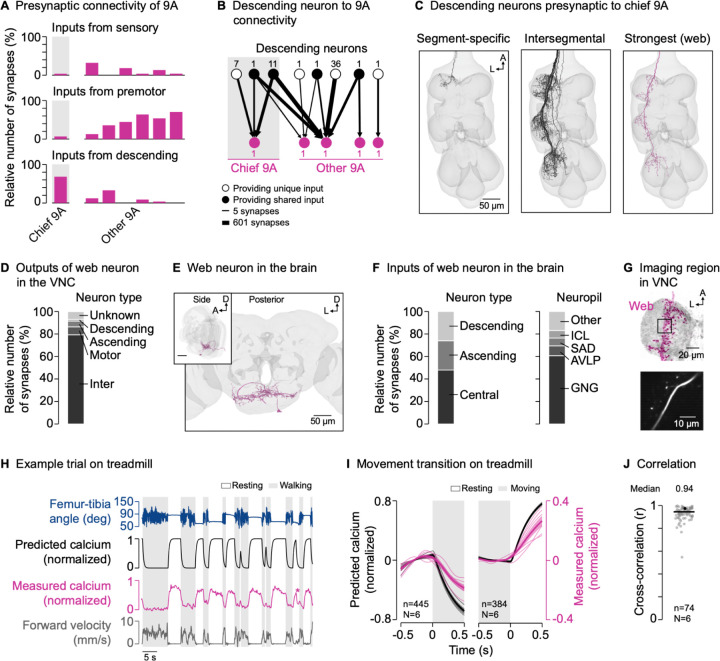
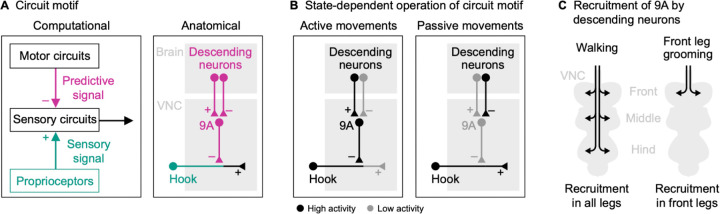
Controlling arms and legs requires feedback from proprioceptive sensory neurons that detect joint position and movement. Proprioceptive feedback must be tuned for different behavioral contexts, but the underlying circuit mechanisms remain poorly understood. Using calcium imaging in behaving Drosophila, we find that the axons of position-encoding leg proprioceptors are active across behaviors, whereas the axons of movement-encoding leg proprioceptors are suppressed during walking and grooming. Using connectomics, we identify a specific class of interneurons that provide GABAergic presynaptic inhibition to the axons of movement-encoding proprioceptors. The predominant synaptic inputs to these interneurons are descending neurons, suggesting they are driven by predictions of leg movement originating in the brain. Calcium imaging from both the interneurons and their descending inputs confirmed that their activity is correlated with self-generated but not passive leg movements. Overall, our findings elucidate a neural circuit for suppressing specific proprioceptive feedback signals during self-generated movements.

Keywords: Drosophila; Motor control; corollary discharge; efference copy; predictive signaling; presynaptic inhibition; proprioception; ventral nerve cord.


Conflict of interest statement

Declaration of interests The authors declare no competing interests.

Figures

Figure 1.
Figure 1.. Proprioceptor axons from the Drosophila leg are positioned to receive presynaptic inhibition
(A) Left: Theoretical framework for predictive inhibition of proprioceptive pathways. Motor circuits send a predictive inhibitory signal (magenta) based on the motor commands to the sensory circuits. The predictive signal is subtracted from the measured sensory signal (green), representing a joint angle (blue) resulting from self-generated motor commands and external forces. The corrected sensory signal (black) can be used to counteract external forces without impeding voluntary movement. Right: Schematic time courses illustrating a situation where the predictive signal matches the sensory signal in timing and amplitude. (B) Left: Confocal image of a Drosophila front leg showing the location of the femoral chordotonal organ (FeCO) cell bodies and dendrites. Green: GFP; gray: cuticle auto-fluorescence. The blue arrow indicates the extension (Ext) and flexion (Flex) of the tibia relative to the femur. Right: Confocal image of position-encoding claw and movement-encoding hook axons in the fly ventral nerve cord (VNC). Flexion- and extension-encoding hook axons are overlaid. Green: GFP; gray: neuropil stain (nc82). Schematized calcium signals from claw and hook axons (GCaMP, green) in response to a controlled, passive movement of the femur-tibia joint (blue) based on Mamiya et al.. (C) Top view of reconstructed claw and hook axons in the left front leg neuromere of the FANC connectome. n: number of axons; A: anterior; L: lateral. (D) Location of input and output synapses of all reconstructed claw and hook axons. View as in (C). (E) Neurotransmitter profile of the input synapses of claw and hook axons. (F) Expression levels of receptor genes in claw and hook neurons. Black intensity represents the mean level of gene expression in a cluster relative to the level in other clusters. Dot size represents the percent of cells in which gene expression was detected. Asterisk indicates that Lcch3 forms inhibitory channels with Rdl and excitatory channels with Grd. See also Video S1.
Figure 2.
Figure 2.. The axons of position-encoding proprioceptors are not suppressed during active leg movements
(A) Experimental setup for two-photon calcium imaging from VNC neurons and 3D leg tracking of the left front leg of tethered flies on a treadmill. (B) Computational models of FeCO proprioceptors translating time courses of joint angles into time courses of calcium signals. The activation functions were fitted to calcium signals measured during passive leg movement. (C) Top: Confocal image of position-encoding claw axons in the VNC. The black box indicates the imaging region. Green: GFP; gray: neuropil stain (nc82). A: anterior; L: lateral. Bottom: Mean tdTomato signal within the imaging region during an example trial. (D) Example trial of two-photon calcium imaging of claw axons in the neuromere of the left front leg and behavior tracking on the treadmill. (E) Cross-correlation coefficient between predicted and measured calcium signals per trial at a time lag of zero. The black line shows the median. The black dot marks the trial shown in (D). n: number of trials; N: number of flies. (F) Median predicted and measured calcium signals as a function of the median femur-tibia angle for individual resting bouts. Bouts are ≥1 s in duration. The black and green line indicate the mean calcium signals in bins of 10°. The dashed blue line indicates the resting angle at which activity is minimal. The blue rectangle indicates the range of resting angles analyzed in (G). The plot on top shows a kernel density estimation of the femur-tibia angles during resting. The solid blue line indicates the most frequent femur-tibia angle (mode of the distribution). n: number of resting bouts; N: number of flies. (G) Predicted and measured calcium signals aligned to the transitions into and out of movement. Movement includes walking and grooming. Thin lines show animal means, thick lines show mean of means, shadings show standard error of the mean. n: number of transitions; N: number of flies. See also Figures S1 and S2 and Video S2.
Figure 3.
Figure 3.. The axons of movement-encoding proprioceptors are suppressed during active leg movements
(A) Top: Confocal image of movement-encoding hook (flexion) axons in the VNC. The black box indicates the imaging region. Green: GFP; gray: neuropil stain (nc82). A: anterior; L: lateral. Bottom: Mean tdTomato signal within the imaging region during an example trial. (B) Example trial of two-photon calcium imaging of hook flexion axons in the neuromere of the left front leg and behavior tracking on the treadmill. The asterisks highlight resting bouts during which the front leg was held in the air and slowly flexed, likely as a result of passive forces produced by leg muscles and skeletal structures. (C) Cross-correlation coefficient between predicted and measured calcium signals per trial at a time lag of zero in different movement contexts. Black lines show medians. Black dots mark the trials shown in (B) and (G). In platform trials, active movements were excluded for the cross-correlation. n: number of trials; N: number of flies. (D) Median predicted and measured calcium signals during resting, walking, and grooming. Bouts are ≥1 s in duration. Distributions show kernel density estimations. n: number of behavioral bouts; N: number of flies. (E) Predicted and measured calcium signals aligned to the transitions into and out of movement. Signals are baseline subtracted (mean from −0.5 to 0 s). Movement includes walking and grooming. Thin lines show animal means, thick lines show mean of means, shadings show standard error of the mean. n: number of transitions; N: number of flies. (F) Experimental setup for passively moving the left front leg via a platform during two-photon calcium imaging from the VNC. (G) Example trial of two-photon calcium imaging of hook flexion axons and behavior tracking on the platform. (H) Predicted and measured calcium signals aligned to the transition into passive flexion of the femur-tibia joint. Lines and labels as in (E). See also Figures S1 and S3 and S4 and S5 and S6 and Video S3.
Figure 4.
Figure 4.. GABAergic interneurons provide presynaptic inhibition to movement-encoding proprioceptor axons
(A) Connectivity of presynaptic neurons with claw and hook axons. The grayscale heatmap indicates the number of synapses between neurons (connection strength). Boxes on the left group presynaptic neurons of the same developmental lineage, with the color indicating their primary fast-acting neurotransmitter. Boxes from top to bottom: 13B and 19A (both GABA); 3A (acetylcholine); 9A, 13B, and 19A (all GABA); 8A (glutamate); 1A, 8B, 18B, 22A, hook axons, and hair plate axon (all acetylcholine); unknown. (B) Top and side view of the chief GABAergic 9A neuron presynaptic to hook axons in the left front leg neuromere in FANC. A: anterior; L: lateral; V: ventral. (C) Connectivity between 9A neurons and hook axons. (D) Top: Confocal image of 9A neurons in the VNC. The black box indicates the imaging region. Magenta: GFP; gray: neuropil stain (nc82). A: anterior; L: lateral. Bottom: Mean tdTomato signal within the imaging region during an example trial. (E) Example trial of two-photon calcium imaging of 9A neurons in the neuromere of the left front leg and behavior tracking on the treadmill. The asterisk highlights a resting bout during which the front leg was moved passively by the grooming hind legs. (F) Predicted and measured calcium signals aligned to the transitions into and out of movement. Movement includes walking and grooming. Thin lines show animal means, thick lines show mean of means, shadings show standard error of the mean. n: number of transitions; N: number of flies. (G) Cross-correlation coefficient between predicted and measured calcium signals per trial at a time lag of zero in different movement contexts. Black lines show medians. Black dots mark the trials shown in (E) and (H). n: number of trials; N: number of flies. (H) Example trial of two-photon calcium imaging of 9A neurons and behavior tracking on the platform. (I) Median predicted and measured calcium signals during active and passive movement bouts on the platform. Bouts are ≥1 s in duration. Distributions show kernel density estimations. n: number of movement bouts; N: number of flies. See also Figure S7 and Videos S1 and S5.
Figure 5.
Figure 5.. GABAergic interneurons receive descending input from the brain
(A) Inputs from sensory neurons, premotor neurons, and descending neurons onto individual 9A neurons presynaptic to hook axons in the front leg neuromere (FANC connectome). (B) Connectivity between descending neurons and the 9A neurons presynaptic to hook axons (FANC connectome). Numbers next to nodes indicate the number of neurons with the same connectivity motif. Lines indicate the log10 of the number of synapses. (C) Segment-specific and intersegmental descending neurons presynaptic to chief 9A, including the most strongly connected descending neuron (web; FANC connectome). A: anterior; L: lateral. (D) Outputs of the descending web neuron in the VNC (MANC connectome). (E) Posterior and side view of the descending web neuron in the brain (FlyWire connectome). A: anterior; D: dorsal; L: lateral. (F) Inputs to the descending web neuron in the brain (FlyWire connectome). GNG: gnathal ganglia; AVLP: anterior ventrolateral protocerebrum; SAD: saddle; ICL: inferior clamp. (G) Top: Confocal image of web neuron in the VNC. The black box indicates the imaging region. Magenta: GFP; gray: neuropil stain (nc82). A: anterior; L: lateral. Bottom: Mean tdTomato signal within the imaging region during an example trial. (H) Example trial of two-photon calcium imaging of the web neuron in the neuromere of the left front leg and behavior tracking on the treadmill. The asterisk highlights part of a front leg resting bout during which the hind legs were grooming. (I) Predicted and measured calcium signals aligned to the transitions into and out of movement. Movement includes walking and grooming. Thin lines show animal means, thick lines show mean of means, shadings show standard error of the mean. n: number of transitions; N: number of flies. (J) Cross-correlation coefficient between predicted and measured calcium signals per trial at a time lag of zero. The black line shows the median. The black dot marks the trial shown in (H). n: number of trials; N: number of flies. See also Figure S8 and Videos S1 and S6.
Figure 6.
Figure 6.. Summary of neural circuit for selectively suppressing proprioceptive movement feedback
(A) A set of descending neurons target GABAergic 9A neurons in the VNC, which suppress feedback from movement-encoding hook axons via presynaptic inhibition during active, self-generated leg movements. (B) Context-dependent operation of the circuit motif during active leg movements and passive leg movements/resting. (C) Recruitment of 9A neurons in different VNC neuropils by excitatory descending neurons that drive walking and front leg grooming.

References

    1. Proske U., and Gandevia S.C. (2012). The proprioceptive senses: their roles in signaling body shape, body position and movement, and muscle force. Physiol. Rev. 92, 1651–1697. - PubMed
    1. Tuthill J.C., and Azim E. (2018). Proprioception. Curr. Biol. 28, R194–R203. - PubMed
    1. Rossignol S., Dubuc R., and Gossard J.-P. (2006). Dynamic sensorimotor interactions in locomotion. Physiol. Rev. 86, 89–154. - PubMed
    1. Dallmann C.J., Karashchuk P., Brunton B.W., and Tuthill J.C. (2021). A leg to stand on: computational models of proprioception. Curr. Opin. Physiol. 22, 100426. - PMC - PubMed
    1. Frigon A., Akay T., and Prilutsky B.I. (2021). Control of mammalian locomotion by somatosensory feedback. In Comprehensive Physiology, Prakash Y. S., ed. (Wiley; ), pp. 2877–2947. - PMC - PubMed

Publication types