[Preprint]. 2024 Sep 14:2023.11.04.565649.
doi: 10.1101/2023.11.04.565649.

Aryl hydrocarbon receptor restricts axon regeneration of DRG neurons in response to injury

Affiliations

Aryl hydrocarbon receptor restricts axon regeneration of DRG neurons in response to injury

Dalia Halawani et al. bioRxiv. .

Abstract

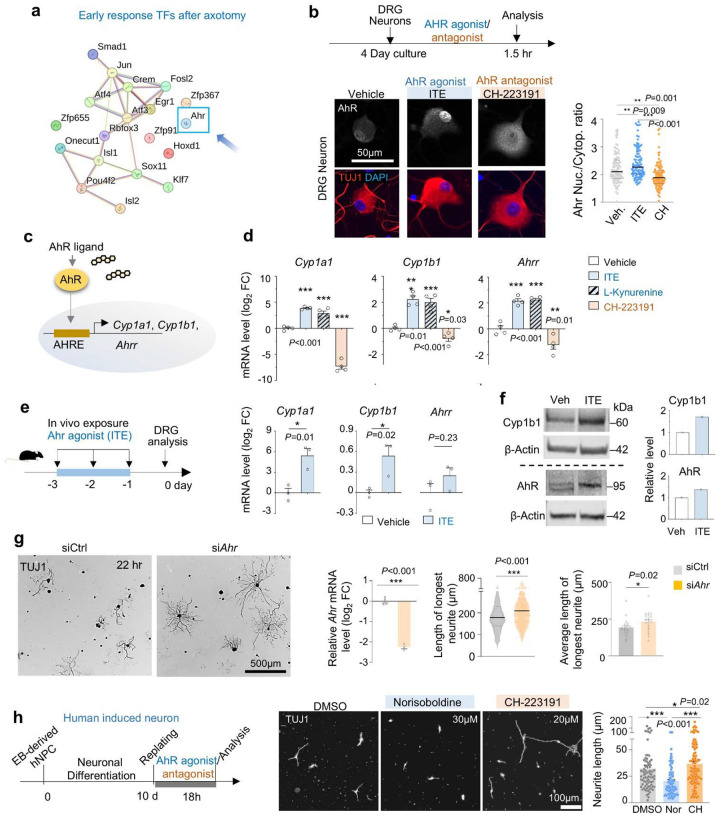
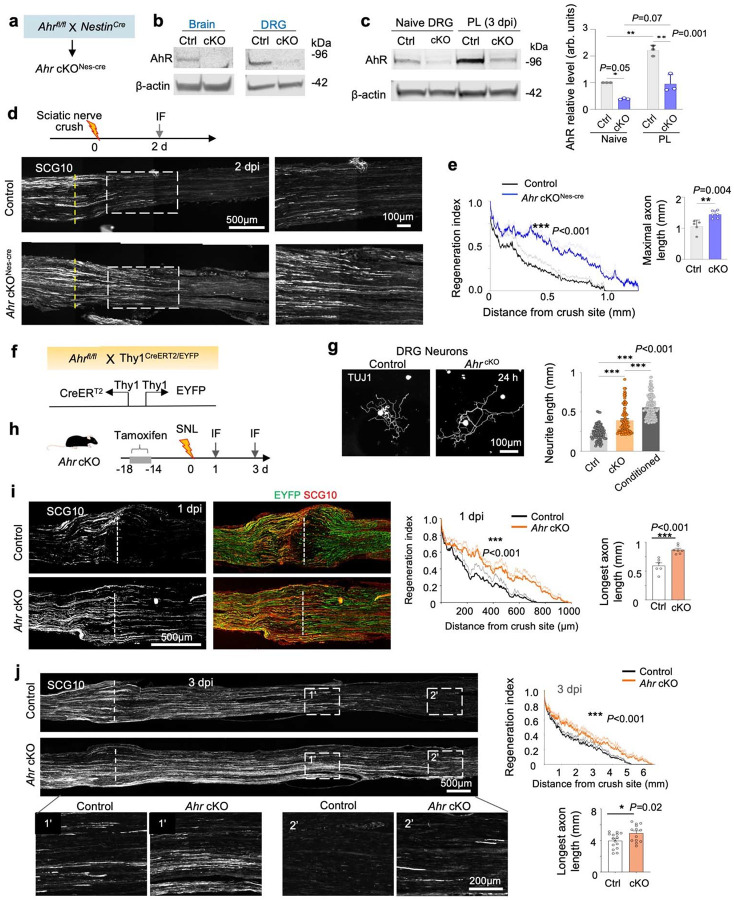
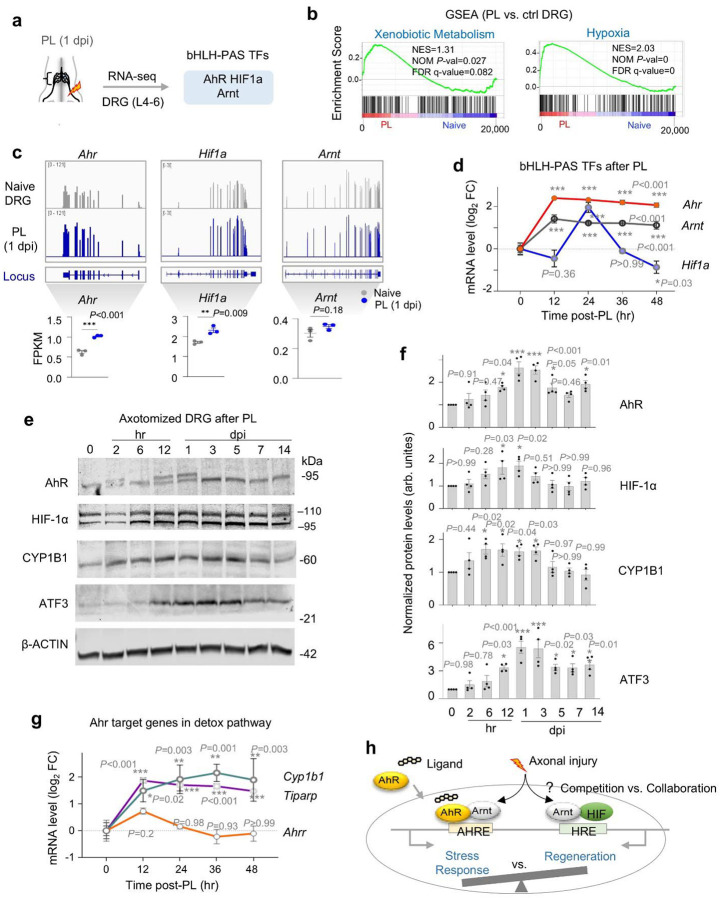
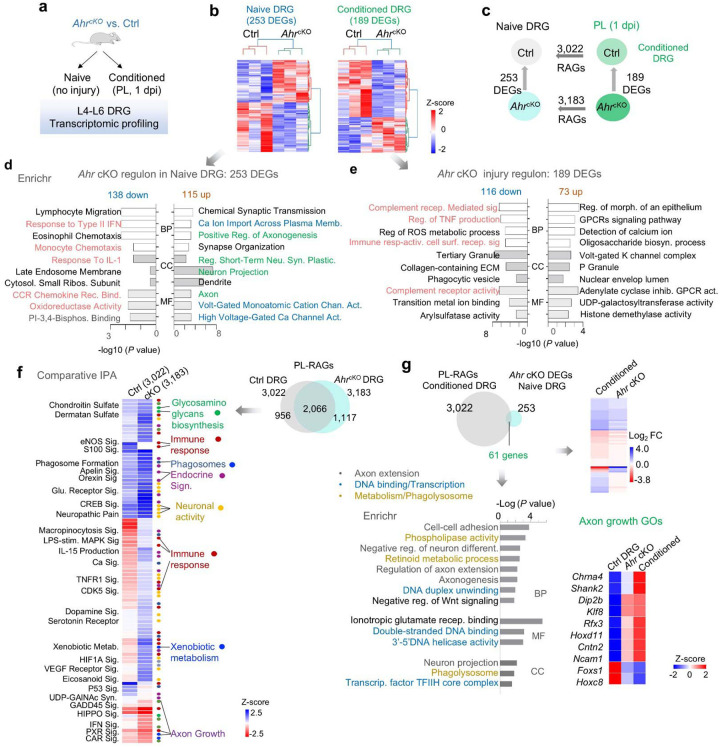
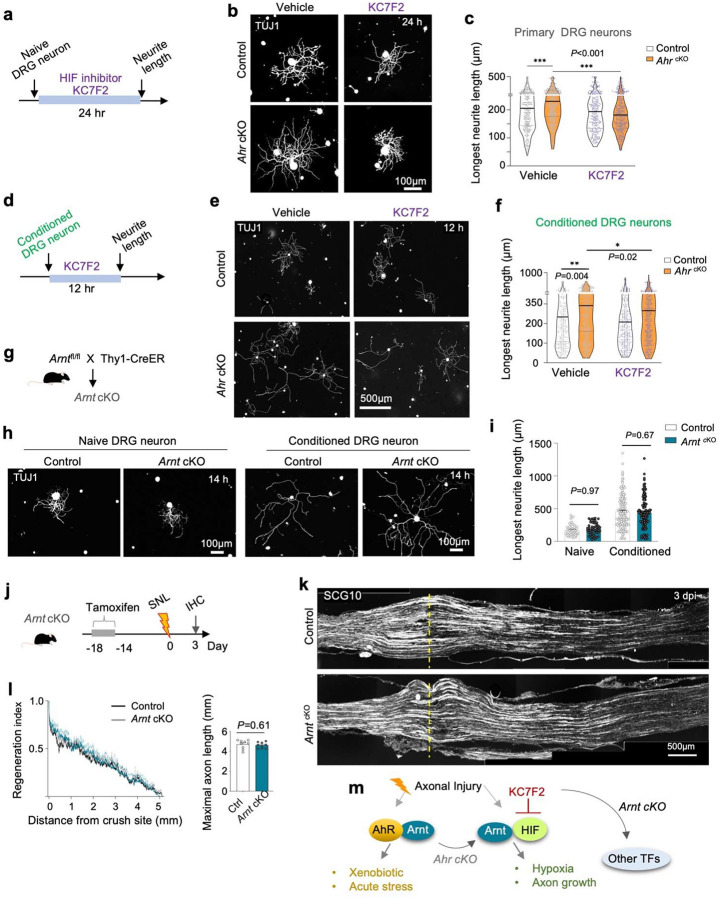
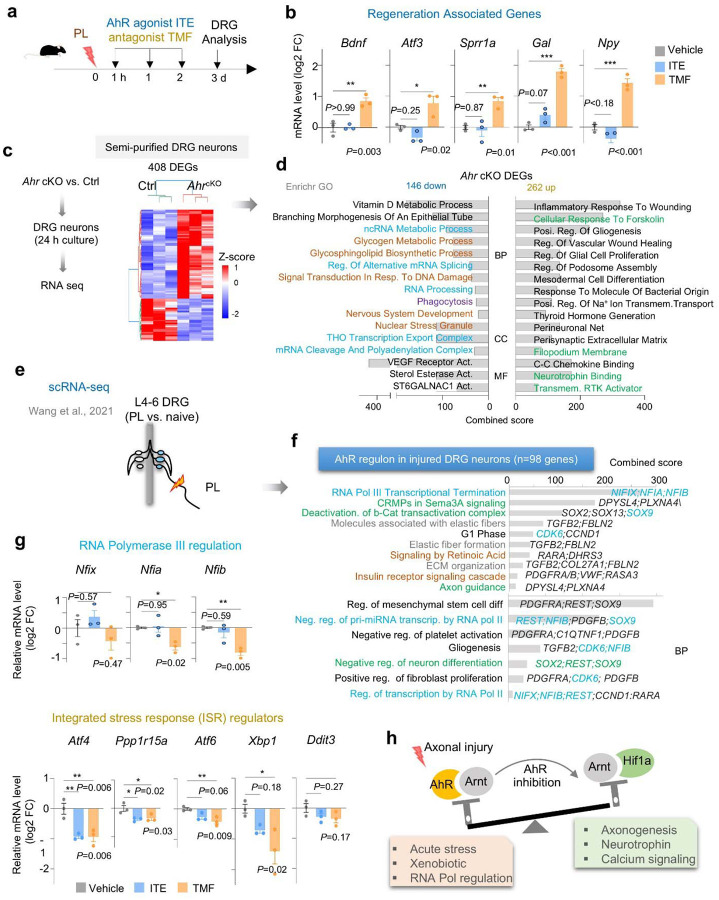
Injured neurons sense environmental cues to balance neural protection and axon regeneration, but the mechanisms are unclear. Here, we unveil aryl hydrocarbon receptor (AhR), a ligand-activated bHLH-PAS transcription factor, as a molecular sensor and key regulator of acute stress response at the expense of axon regeneration. We demonstrate responsiveness of DRG sensory neurons to AhR signaling, which functions to inhibit axon regeneration. Conditional Ahr deletion in neurons accelerates axon regeneration after sciatic nerve injury. Ahr deletion partially mimics the conditioning lesion in priming DRG to initiate axonogenesis gene programs; upon peripheral axotomy, Ahr ablation suppresses inflammation and stress signaling while augmenting pro-growth pathways. Moreover, comparative transcriptomics revealed signaling interactions between AhR and HIF-1α, two structurally related bHLH-PAS α units that share the dimerization partner Arnt/HIF-1β. Functional assays showed that the growth advantage of AhR-deficient DRG neurons requires HIF-1α; but in the absence of Arnt, DRG neurons can still mount a regenerative response. We further unveil a link between bHLH-PAS transcription factors and DNA hydroxymethylation in response to peripheral axotomy, while RNA-seq of DRG neurons and neuronal single cell RNA-seq analysis revealed a link of AhR regulon to RNA regulation and integrated stress response (ISR). Altogether, AhR activation favors stress coping and inflammation at the expense of axon regeneration; targeting AhR has the potential to enhance nerve repair.

Keywords: Arnt; Aryl hydrocarbon receptor (AhR); Axon regeneration; Conditioning lesion of DRG; DNA hydroxymethylation; Hypoxia-inducible factor (HIF); Integrated stress response (ISR); Spinal cord injury.


Conflict of interest statement

Competing Interests Statement: All authors declare no competing interests.

Figures

Figure 1.
Figure 1.. DRG neurons are responsive to ligand-mediated AhR signaling.
a. STRING protein-protein interaction network analysis revealed absence of known signaling link of AhR with other regeneration-associated TFs identified in our previous study (Zou et al. 2009). b. Top, schematic of primary DRG neuron cultures treated with AhR agonist, antagonist or vehicle and analyzed 1.5 hr later. Bottom, representative IF images show changes of cytoplasm-nuclear shuttling of AhR in response to AhR agonist (ITE, 10 μM) or AhR antagonist (CH, 10 μM). Violin plots of AhR nuclear to cytoplasmic ratio for n=100 DRG neuron per condition. Black line represents median. One-way ANOVA with Dunnett’s multiple test correction. c. Diagram of ligand-mediated AhR activation to induce canonical target genes through AHR response element (AHRE). d. qRT-PCR results of AhR target genes normalized to housekeeping gene Hprt1 in primary DRG neurons with different drug treatments (25 μM) for 24 hr. n=4 independent DRG neuron cultures per group. Data represent mean ± SEM. One-way ANOVA with Dunnett’s multiple test correction. e. Left, experimental paradigm of adult mice receiving AhR agonist ITE (10 mg/kg; i.p, 3 daily injections) or vehicle (DMSO), followed by DRG analysis 1 day later. Right, qRT-PCR results of gene expression of AhR canonical target genes normalized to Hprt1 in DRG from vehicle- or ITE-treated mice. n=3 independent L4–6 DRG samples from 3 mice. Data represent mean ± SEM. Unpaired two-tailed Student’s t-test. f. Western blots and quantifications of Cyp1b1 and AhR in DRG from vehicle- or ITE-treated mice. Note the electrophoretic mobility shift of AhR in DRGs from ITE-treated mice. g. Left, IF images of siRNA treated DRG neurons show enhanced neurite outgrowth with Ahr knockdown, confirmed by qRT-PCR analysis. n=4 independent cultures for siCtrl and n=3 for siAhr. Bar graphs represent mean ± SEM. Quantification of longest neurite length from n=489 neurons for siCtrl and n=482 for siAhr, pooled from 4 independent cultures for each condition. Black horizontal lines in violin plots indicated median. Mann-Whitney two-tailed test. Quantification of average longest neurite length of 25 neurons from n=20 images collected from n=4 independent cultures for each condition. Mann-Whitney two-tailed test. h. Left, experimental schematic of AhR agonist or antagonist stimulation of human induced neurons from hESC via neuronal differentiation of embryoid body (EB) and human neuroprogenitor cells. Middle, IF images for TUJ1 of induced neurons after replating. Right, quantifications of neurite length. n=83 cells for DMSO, n=90 for NOR, n=106 for CH treatment. Data represent mean ± SEM. One-way ANOVA with Dunnett’s multiple test correction.
Figure 2.
Figure 2.. Neuronal AhR deletion enhances axon regeneration after sciatic nerve injury.
a. Diagram of generating Ahr cKONes-cre mice by breeding Ahr floxed mice with Nestin-Cre allele. b. Western blots show depletion of AhR in brain and DRGs from Ahr cKONes-cre mice. β-actin served as loading control. c. Western blots and quantifications show expression of AhR in naive and conditioned DRG (3 dpi after PL) from Ahr cKONes-cre relative to control (Ctrl) mice, β-actin as loading control. n=3 independent samples from 3 mice, each from pooled L4-L6 DRGs. Data represent mean ± SEM. Two-way ANOVA with Bonferroni multiple test correction. d. Top, experimental paradigm. Bottom, IF images show enhanced axon regrowth (SCG10+) in Ahr cKONes-cre mice compared to littermate controls at 2 dpi. Dashed lines denote crush center (based on highest immunointensity of SCG10). e. Left, quantification of SCG10+ axons transversing lesion center. Mean + SEM. Right, bar graph of longest axon length distal to lesion center. n=5 mice for control and n=6 for cKO mice. Two-way ANOVA for regeneration index. Unpaired two-tailed Student’s t-test for maximal axon length. Data represent mean ± SEM. f. Diagram of crossing Ahrfl/fl allele to Thy1CreERT2/EYFP transgenic line expressing tamoxifen inducible CreERT2 and EYFP (driven by bidirectional Thy1 promoter). g. IF images and quantification of neurite outgrowth (TUJ1+) of primary DRG neurons from Ahrfl/fl Thy1CreERT2/EYFP (Ahr cKO) or littermate controls after tamoxifen injection (100 mg/kg; i.p., 5 consecutive days) 14 days prior. n=81, 81, and 149 for control, Ahr cKO, or pre-conditioned DRG neurons, respectively, collected from n=2 mice per genotype. Bar graphs represent mean ± SEM. One-way ANOVA with Dunn’s multiple comparisons test. Pre-conditioned neuron dataset used from. h. Experimental paradigm: tamoxifen (100 mg/kg; i.p., 5 consecutive days) administered 14 days prior to sciatic nerve crush lesion (SNL), axon regeneration assessed by IF for SCG10 at 1 and 3 dpi. i, j. IF images and quantifications of SCG10+ axons traversing lesion center of crushed sciatic nerve (dashed lines) at 1 or 3 dpi. Mean + SEM. Magnified images are shown below. n=6 control and n=7 cKO mice per group for 1 dpi. n=15 control and n=13 cKO for 3 dpi. For regeneration index, two-way ANOVA with Bonferroni multiple test correction; for longest axon length distal to lesion center, unpaired two-tailed Student’s t-test. Data represent mean ± SEM.
Figure 3.
Figure 3.. Peripheral lesion of DRG results in early induction of AhR and HIF-1α.
a. Diagram of RNA-seq analysis of lumbar 4–6 DRGs at 1 day after PL as compared to uninjured (naive) DRGs. bHLH-TFs are denoted in blue. b. GSEA shows enrichment of Xenobiotic metabolism and Hypoxia in axotomized DRG at 1 dpi as compared to naive DRG (~20,000 genes). NES, normalized enrichment score; FDR, false discovery rate. c. Top, RNA-seq read tracks of the indicated TFs. Bottom, graphs showing FPKM (fragments per kilobase of transcript per million reads) of the genes. n=3 independent DRG samples per condition. Unpaired two-tailed Student’s t-test. d. Time-course qRT-PCR analyses at early time points after PL, normalized to housekeeping gene Hprt1. Data represent mean ± SEM. n=3 independent samples, each pooled from L4-L6 DRGs from n=3 mice per group. One-way ANOVA with Dunnett’s multiple test correction. ***P<0.001. e, f. Western blots (e) and quantifications (f) of protein expression in DRG at different time points after PL relative to no injury (β-actin as loading control). n=4 independent DRG samples from 4 mice per time point. Bar graphs represent mean ± SEM. One-way ANOVA with Dunnett’s multiple test correction. g. Time course qRT-PCR analyses of canonical AhR target genes in DRG after PL relative to no injury (normalized to Hprt1). Data represent mean ± SEM. n=3 independent samples from 3 mice per group, each pooled from L4-L6 DRGs. One-way ANOVA with Dunnett’s multiple test correction. h. Schematic model of competitive vs. collaborative interaction between AhR and HIF pathways to regulate shared or distinct injury response or regeneration-associated genes.
Figure 4.
Figure 4.. AhR cKO partially mimics conditioning lesion in initiating axonogenesis gene program while suppressing stress response.
a. Experimental paradigm of RNA-seq of DRG from AhrcKO vs. littermate controls (n=3) in naive state or after PL at 1 dpi. b. Heatmaps of hierarchically clustered differentially expressed genes (DEGs) in AhrcKO vs. control DRG in naive or axotomized state (triplicates each, cutoff: abs (log2 FC) >0.25, P <0.05). c. Summary diagram of 4-way comparison of DEGs in control or AhrcKO DRGs in naive or axotomized state. PL-RAGs in control DRG (n=3,022) were previously reported (Halawani et al. 2023). d, e. Enrichr pathway analysis of up- and downregulated DEGs (Ahr cKO/Ctrl) in naive or axotomized DRG at 1 dpi. BP, biological process; CC, cellular component; MF, molecular function. f. Left, comparative IPA of PL-induced regeneration associated genes (RAGs) at 1 dpi in control (n=3,022) and AhrcKO DRGs (n=3,183) with selected annotation on left. Colored dots on right denote pathway classification. Right, Venn diagram showing overlap of DEGs. g. Top left, Venn diagram showing overlap of genes between PL-RAGs after conditioning lesion at 1 dpi and AhR regulon in naive DRG. Bottom left, top enriched ontologies of 61 overlapping genes. Top right, heatmap of relative expression of 61 overlapping genes. Bottom right, heatmap of relative expression of selected genes of the gene ontologies (GOs) Neuro-projection, Axonogenesis, and Axon guidance (part of the 61 overlapping RAGs).
Figure 5.
Figure 5.. Growth promoting effect of Ahr deletion requires HIF1α.
a-f. Neurite outgrowth assay of primary DRG neurons (a-c) or conditioned DRG neurons with peripheral axotomy 3 days prior (d-f). Left, experimental schemes: DRG neurons treated with HIF1α inhibitor KC7F2 (10 μM) and examined 24 or 12 hrs after plating. Right, representative IF images for TUJ1 and quantifications of neurite outgrowth. Violin plots of n=250–408 neurons for each condition. Horizontal black line denotes median. Two-way ANOVA followed by Bonferroni’s multiple comparison test. g. Experimental scheme for generation of Arnt cKO (Arntfl/fl Thy1-CreERT2/EYFP) mice. h, i. Representative IF images for TUJ1 and quantifications of naive or conditioned DRG neurons from Arnt cKO or control mice at 14 hr post-seeding. n=51–52 neurons for naive and n=122–157 for conditioned DRG neurons from n=5 mice per genotype. Bar graphs represent mean ± SEM. Two-way ANOVA followed by Bonferroni’s multiple comparison test. j-l. Experimental paradigm: sciatic nerve crush lesion (SNL) performed 14 days after tamoxifen injection (100 mg/kg; 5 daily i.p.,) and axon regrowth analyzed at 3 dpi. Representative IF images and quantification of axon regeneration (SCG10+) at 3 dpi. Dashed lines: lesion center. n=9 mice per genotype. Two-way ANOVA for regeneration index. Unpaired two-tailed Student’s t test for maximal axon length. m. Working model of AhR and HIF competition for heterodimerization partner Arnt.
Figure 6.
Figure 6.. Pharmacological attenuation of AhR activation impacts RNA Polymerase III regulation and ISR in injured DRG.
a. Experimental paradigm of in vivo injection of AhR agonist, antagonist (10 mg/kg; i.p.) or vehicle (DMSO) after sciatic nerve crush injury. DRGs were collected for analysis at 3 dpi. b. qRT-PCR results normalized to housekeeping gene Hprt1 demonstrate augmented induction of RAGs with AhR antagonist TMF after PL. Data represent mean ± SEM. n=3 independent samples, each pooled from L4–L6 DRGs from 3 mice per group. One-way ANOVA with Dunnett’s multiple test correction. c. Left, experimental paradigm for semi-purified DRG neuron isolation from Ahr cKO or control mice for RNA-seq analysis at 24 hr post-seeding. Right, heatmap of the DEGs (Ahr cKO vs. Ctrl) from triplicate samples of semi-purified DRG neurons isolated from n=3 mice per group, cutoff: abs (log2 FC) >0.25, P <0.01. d. Enrichr analysis reveals top pathways for the 408 DEGs (Ahr cKO vs. control) in semi-purified DRG neurons (axotomized during dissociation). BP, biological process; CC, cellular component; MF, molecular function. e. Schematic of scRNA-seq of axotomized DRG after sciatic nerve injury relative to no injury DRG (Wang et al. 2021). Predicted AhR regulon of 98 genes based on bioinformatic analysis of TFs driving DEGs across a time-course of 6, 24 hr, 2, 7, and 14 days in DRG neurons after axotomy. f. Enrichr analysis reveals top pathways for the 98 predicted DRG neuron specific AhR regulon genes after PL from scRNA-seq. BP, biological process. g. qRT-PCR analysis of genes from the indicated Enrichr GO terms shown above. Results were normalized to housekeeping gene Hprt1. Data represent mean ± SEM. n=3 independent samples, each pooled from L4–L6 DRGs from 3 mice per group. One-way ANOVA with Dunnett’s multiple test correction. h. Working model of the role of AhR in balancing neural injury and regenerative responses.

Similar articles

References

    1. Bersten D. C., Sullivan A. E., Peet D. J. & Whitelaw M. L. bHLH-PAS proteins in cancer. Nat Rev Cancer 13, 827–841 (2013). 10.1038/nrc3621 - DOI - PubMed
    1. Mulero-Navarro S. & Fernandez-Salguero P. M. New Trends in Aryl Hydrocarbon Receptor Biology. Front Cell Dev Biol 4, 45 (2016). 10.3389/fcell.2016.00045 - DOI - PMC - PubMed
    1. Halawani D. et al. Circadian clock regulator Bmal1 gates axon regeneration via Tet3 epigenetics in mouse sensory neurons. Nat Commun 14, 5165 (2023). 10.1038/s41467-023-40816-7 - DOI - PMC - PubMed
    1. Cho Y. et al. Activating Injury-Responsive Genes with Hypoxia Enhances Axon Regeneration through Neuronal HIF-1alpha. Neuron 88, 720–734 (2015). 10.1016/j.neuron.2015.09.050 - DOI - PMC - PubMed
    1. Rothhammer V. & Quintana F. J. The aryl hydrocarbon receptor: an environmental sensor integrating immune responses in health and disease. Nat Rev Immunol 19, 184–197 (2019). 10.1038/s41577-019-0125-8 - DOI - PubMed

Publication types