[Preprint]. 2023 Oct 28:2023.10.25.564019.
doi: 10.1101/2023.10.25.564019.

Metabolic similarity and the predictability of microbial community assembly

Affiliations

Metabolic similarity and the predictability of microbial community assembly

Jean C C Vila et al. bioRxiv. .

Abstract

When microbial communities form, their composition is shaped by selective pressures imposed by the environment. Can we predict which communities will assemble under different environmental conditions? Here, we hypothesize that quantitative similarities in metabolic traits across metabolically similar environments lead to predictable similarities in community composition. To that end, we measured the growth rate and by-product profile of a library of proteobacterial strains in a large number of single nutrient environments. We found that growth rates and secretion profiles were positively correlated across environments when the supplied substrate was metabolically similar. By analyzing hundreds of in-vitro communities experimentally assembled in an array of different synthetic environments, we then show that metabolically similar substrates select for taxonomically similar communities. These findings lead us to propose and then validate a comparative approach for quantitatively predicting the effects of novel substrates on the composition of complex microbial consortia.


Conflict of interest statement

Competing interests: The authors declare that no competing interests exist in relation to this manuscript.

Figures

Figure 1:
Figure 1:. Is microbial community assembly predictable across similar environments?
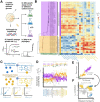
A) Our goal is to determine whether one can predict the effect of novel environments on the composition of diverse microbial consortia. We hypothesize that community composition in new environments might be predictable using the community composition observed in similar metabolic environments (B) To test this hypothesis, we turned to an in vitro community system in which diverse inocula are assembled in minimal media containing different carbon sources. We assembled enrichment communities from 12 inocula by passaging for 12 transfers on one of 7 different carbon sources. (C) In this panel we show the relative abundance of the two dominant proteobacterial clades after 12 transfers (Methods). The purple E+ clade includes Enterobacteriaceae, Aeromonadaceae, Erwiniaceae, and Yersianiaceae, while the orange P+ clade includes Pseudomonadaceae and Moraxellaceae. Different carbon sources resulted in different community compositions at this coarse-grain phylogenetic level with a shift in composition that appears to qualitatively track a primary axis in central metabolism. Arrows indicate the entry point of D-Glucose (Blue) and L-Leucine (Yellow) into central metabolism (D) Given this observation, we hypothesize that microbial isolates grown on substrates using similar metabolic pathways would exhibit similarities in growth rate and secrete similar metabolic by-products. If our hypothesis is true, then we expect metabolically similar substrates to select for predictably similar microbial communities.
Figure 2:
Figure 2:. A quantitative measure of substrate similarity predicts growth rate similarities
(A) Diagram of experimental procedure. 62 proteobacteria isolates with unique 16s sequences where isolated (Fig. S2) and grown in minimal media containing one of 19 different carbon sources. The average growth rate of each isolate on each carbon source was quantified and normalized to allow for comparison across environments (Methods). (B) Phylogenetic heat map shows the taxonomic distribution of growth rates. Carbon sources are ordered heuristically by the order of entry into central metabolism (Fig. S3). Carbon sources that enter metabolism via glycolysis are coloured in Blue (Glycolytic) and Carbon sources entering metabolism via the TCA cycle are coloured in yellow (Gluconeogenic). (C) To quantify the similarity of substrate pairs, we performed flux-balance analysis on individual carbon sources and calculated the correlation in predicted intracellular metabolic fluxes (methods). Sub-panels illustrate this calculation for D-glucose and D-Fructose which are both glycolytic, Fumarate and Succinate which are both gluconeogenic and D-Glucose and Succinate. (D) When we rank order carbon sources by quantitative similarity to D-Glucose, we find that all Enterobacteriaceae+ strains (purple) have higher growth rates on carbon sources that are more quantitatively similar to D-Glucose whereas all Pseudomonadaceae+ strains (orange) have higher growth rates on carbon sources that are more dissimilar to D-Glucose. (E) Quantitatively similar carbon sources such as D-Glucose and D-Fructose display a strong positive correlation in growth rate (see Fig S7 for correlation between all pairs of carbon sources). (F) More positive growth rate correlations are observed between more metabolically similar carbon sources (Mantel Test P<1e-04). Stronger positive correlations are observed for pairs of more similar glycolytic resources (blue inset), but not for more similar gluconeogenic carbon sources (yellow inset). The weakest correlations are observed when comparing growth on a glycolytic carbon source to growth on a gluconeogenic carbon source (gray circles, (pearson’s r = −0.172±0.34, mean±sd)).
Fig 3:
Fig 3:. Metabolic secretions are similar in metabolically similar environments.
(A) Diagram of experimental procedure. Strains were inoculated and grown on minimal media supplemented with different carbon sources. Samples were filtered to obtain the spent media and the metabolite profile was quantified using either targeted or untargeted metabolomics (LC-MS). Targeted LC-MS was used to quantify absolute concentration of a known set of metabolites at multiple time-points. Untargeted LC-MS was used to compare the metabolite profile across many carbon sources at a single time-point. (B) Concentrations of the 3 most abundant metabolites secreted by an Enterobacter strain on 5 different carbon sources (see Fig S10 for other metabolites and strain). Similar secretions are observed when strains are grown on similar carbon sources such as D-Glucose and D-Fructose (Fig. S11). (C) Untargeted LC-MS on the spent media of a Klebsiella strain after 24hrs of growth on 16 different carbon sources. Heatmap shows normalized peak height for each metabolite averaged across 3 replicates (see Fig. S13A for individual replicates). Red cells correspond to carbon sources on which each metabolite is more abundant whereas blue cells correspond to carbon sources on which each metabolite is less abundant. Carbon sources are clustered based on the correlation in by-product profile. (D) Klebsiella has a more correlated by-product profile when grown on more similar carbon sources (Mantel Test, P<2e-04). (E) A Pseudomonas strain grown on 11 carbon sources displays a qualitatively similar relationship (Mantel Test, P<0.005) (Fig. S12,S13B)
Fig 4:
Fig 4:. Metabolically similar carbon sources select for taxonomically similar communities.
A) Diagram of experimental procedure. Diverse microbiomes were collected from 3 different environmental sources and used as inoculum for enrichment communities assembled in one of 42 different carbon sources. Communities were passaged every 48hrs for 10 transfers after which community composition was determined using 16s rRNA sequencing (Fig S15). (B) Relative abundance of the Enterobacteriaceae+ (Purple) and Pseudomonadaceae+ (Orange) clade on each carbon source after 10 transfers. Carbon sources are rank ordered along the X axis by the metabolic similarity to D-Glucose. Different shapes in this plot corresponds to communities assembled from different inocula. Metabolically similar carbon sources select for taxonomically similar communities at the (C) ESV level, (D), Genus level, (E) Family level, and (F) Clade level (i.e P+/E+). In Panels C-F we show this relationship for a single inoculum (see Fig. S17 for all three inocula). The correlation between metabolic similarity and community similarity was calculated for each inoculum separately and was statistically significant in every instance (Mantel Test P< 1e-4).
Fig 5:
Fig 5:. Community assembly in new environments is predictable using a comparative approach.
(A) We propose a simple comparative approach for predicting community composition in new environments. The composition in a new ‘target’ environment can be predicted using community composition observed in the most metabolically similar ‘template’ environment. We evaluated the performance of this approach by conducting "Leave-One-Carbon-Source-Out” cross-validation using the communities assembled on different carbon sources (Fig 4). (B) Observed composition for communities assembled on different carbon sources (Inoculum 1). Different ESV are shown in different shades of Purple (E+ Strains), Orange (P+ strains) and Green (Other). (C) Composition predicted using the community assembled in the most metabolically similar environment from the same inoculum (Inoculum 1). (D) Composition predicted using the community assembled in the most metabolically similar environment from a different inoculum (Inoculum 2). The performance of these predictions is quantified by calculating the community similarity (Renkonen similarity) between predicted and observed composition on each carbon source at different taxonomic levels. (E) Distribution of performance for predictions made using the same inoculum (yellow) (F) Distribution of performance for predictions made using different inocula (yellow). We compared the performance of our comparative approach to the performance of a null model where predictions are made using a random environment (Grey). In Panels E-F, the dotted lines show the median performance for the prediction and the null. In each panel we test whether median performance using our comparative approach was higher than the performance of the null model using one tailed Mann-Whitney U-test

References

    1. Aguirre de Cárcer Daniel. 2019. “A Conceptual Framework for the Phylogenetically Constrained Assembly of Microbial Communities.” Microbiome 7 (1): 142. - PMC - PubMed
    1. Allison S. D., Hanson C. A., and Treseder K. K. 2007. “Nitrogen Fertilization Reduces Diversity and Alters Community Structure of Active Fungi in Boreal Ecosystems.” Soil Biology & Biochemistry. https://www.sciencedirect.com/science/article/pii/S0038071707000685.
    1. Aranda-Díaz Andrés, Willis Lisa, Nguyen Taylor H., Ho Po-Yi, Vila Jean, Thomsen Tani, Chavez Taylor, et al. 2023. “Assembly of Gut-Derived Bacterial Communities Follows ‘early-Bird’ Resource Utilization Dynamics.” bioRxiv. 10.1101/2023.01.13.523996. - DOI
    1. Naomi Iris van den Berg, Machado Daniel, Santos Sophia, Rocha Isabel, Chacón Jeremy, Harcombe William, Mitri Sara, and Patil Kiran R. 2022. “Ecological Modelling Approaches for Predicting Emergent Properties in Microbial Communities.” Nature Ecology & Evolution 6 (7): 855–65. - PMC - PubMed
    1. Bittleston Leonora S., Gralka Matti, Leventhal Gabriel E., Mizrahi Itzhak, and Cordero Otto X. 2020. “Context-Dependent Dynamics Lead to the Assembly of Functionally Distinct Microbial Communities.” Nature Communications 11 (1): 1440. - PMC - PubMed

Publication types