[Preprint]. 2023 Oct 31:rs.3.rs-3491540.
doi: 10.21203/rs.3.rs-3491540/v1.

Cytokine polarized, alternatively activated bone marrow neutrophils drive axon regeneration

Affiliations

Cytokine polarized, alternatively activated bone marrow neutrophils drive axon regeneration

Andrew D Jerome et al. Res Sq. .

Update in

Abstract

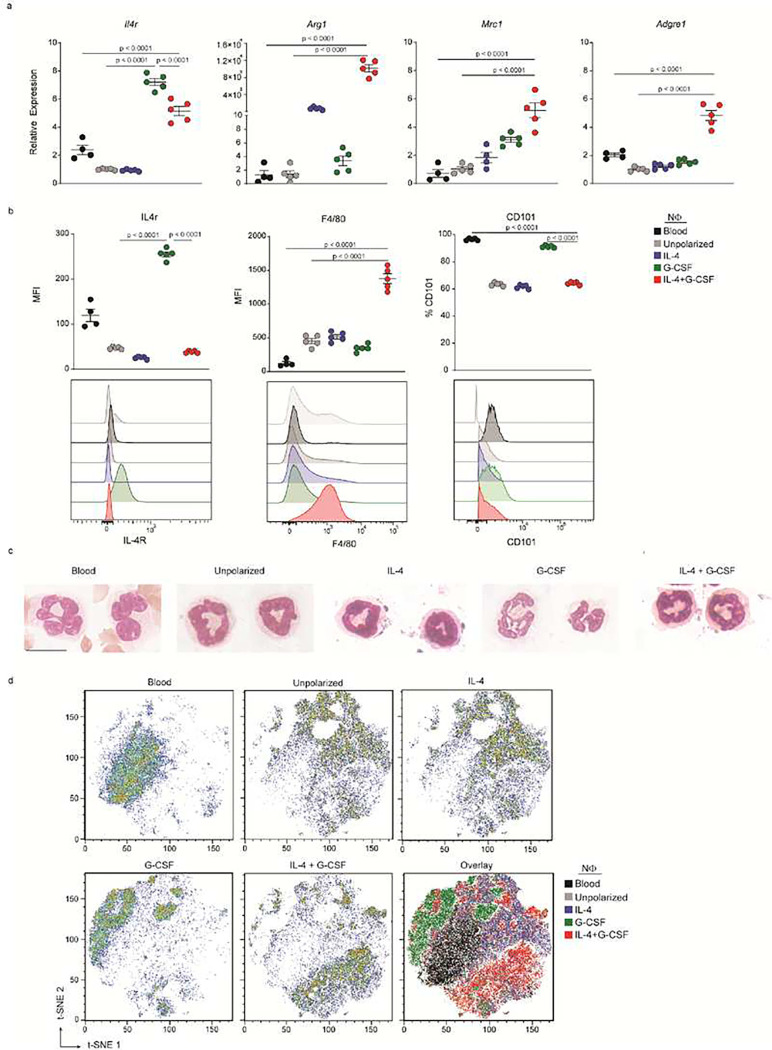
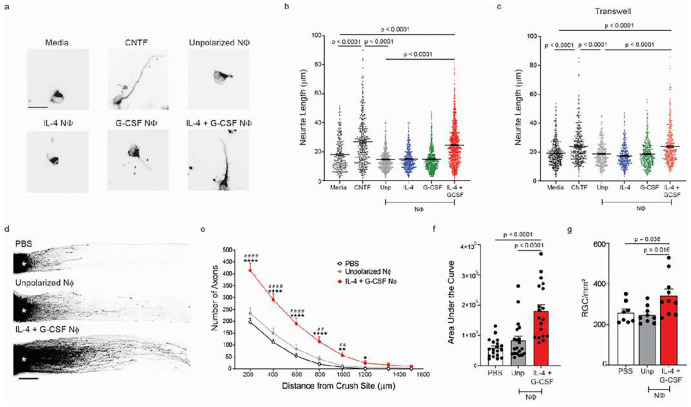
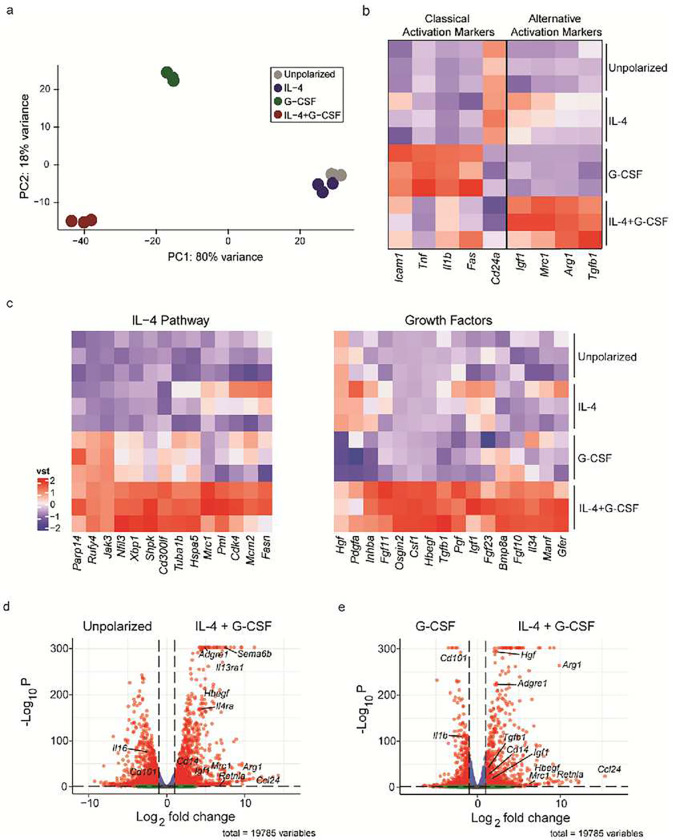
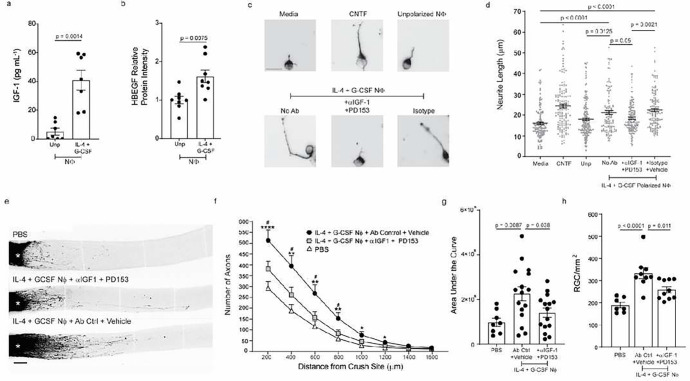
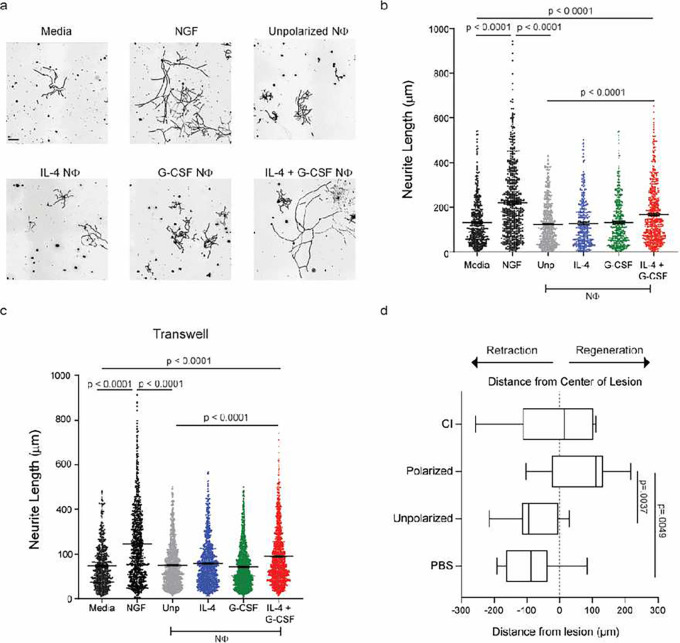
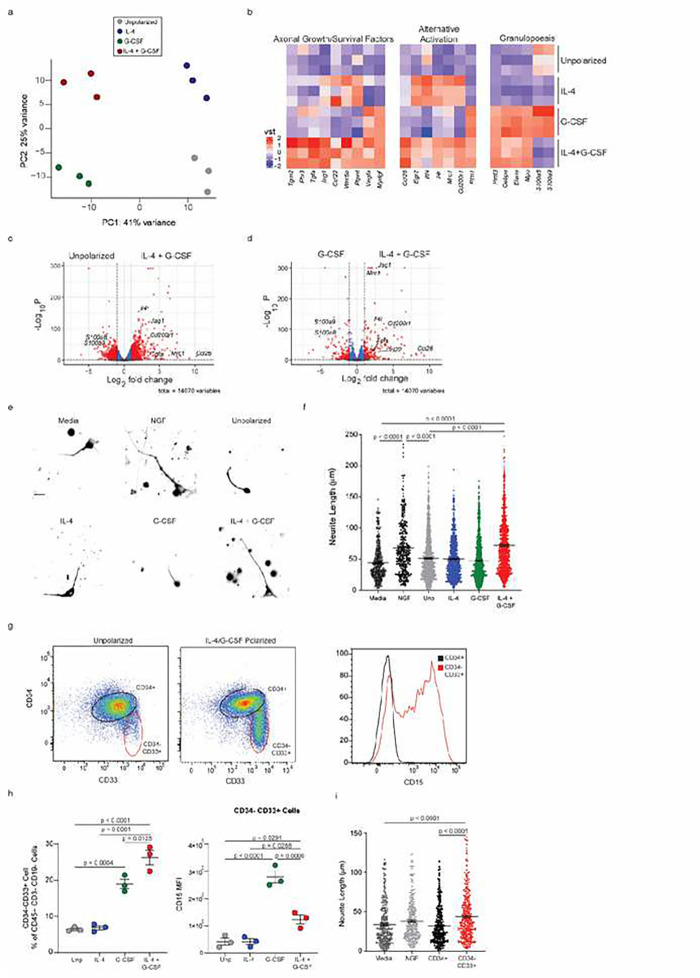
The adult central nervous system (CNS) possesses a limited capacity for self-repair. Severed CNS axons typically fail to regrow. There is an unmet need for treatments designed to enhance neuronal viability, facilitate axon regeneration, and ultimately restore lost neurological functions to individuals affected by traumatic CNS injury, multiple sclerosis, stroke, and other neurological disorders. Here we demonstrate that both mouse and human bone marrow (BM) neutrophils, when polarized with a combination of recombinant interleukin (IL)-4 and granulocyte-colony stimulating factor (G-CSF), upregulate alternative activation markers and produce an array of growth factors, thereby gaining the capacity to promote neurite outgrowth. Moreover, adoptive transfer of IL-4/G-CSF polarized BM neutrophils into experimental models of CNS injury triggered substantial axon regeneration within the optic nerve and spinal cord. These findings have far-reaching implications for the future development of autologous myeloid cell-based therapies that may bring us closer to effective solutions for reversing CNS damage.


Conflict of interest statement

Competing interests B.M.S., A.R.S. and A.D.J. are investors of a patent licensed by the Ohio State University for the use of engineered cells in the treatment of neurological disorders.

Figures

Figure 1
Figure 1
IL-4/G-CSF polarized murine bone marrow neutrophils (BMNΦ) exhibit an immature, alternatively activated phenotype. a-d, Ly6G+ neutrophils (NΦ) were isolated from naïve C57BL/6 bone marrow (BM) cells and cultured with or without polarizing factors for 24 hours. a, RNA was extracted from the cultured BMNΦ, or from peripheral blood NΦ directly ex vivo. Levels of transcripts encoding IL-4 receptor α chain (IL-4Rα, Il4r), arginase-1 (Arg1), mannose receptor (Mrc1), and F4/80 (Adgre1), were measured by RTqPCR and normalized to β-Actin (Actb). Data are presented as fold increase over mean normalized levels in unpolarized BM NΦ. Each symbol represents data from an individual mouse (n=4–5 mice per group). Data shown are from one experiment, representative of four independent experiments. b-c, Ly6G+ bone marrow cells cultured under the specified conditions, and Ly6G+ peripheral blood NΦ, were analyzed by flow cytometry. b, Cell surface expression of indicated molecules on Ly6G+ cells. Upper panels, mean fluorescence intensity (MFI) of cell surface IL4Rα and F4/80, and the percentage of CD101+ cells. Each symbol represents data from a single mouse. (n=4–5 mice per group). Lower panels display representative histograms. Data shown are representative of five independent experiments. c,Representative cytospins of Ly6G+ BM NΦ, after culture under the specified conditions, stained with Wright-Giemsa solution. Scale bar,10 μm. d, Representative sample and overlay t-SNE plots generated by combining flow cytometric data from the analysis of polarized and unpolarized BM NΦ, along with naïve peripheral blood NΦ. Data shown from one experiment, representative of four independent experiments. a, b, Statistical significance was determined using one-way ANOVA followed by Dunnett’s post hoc test
Figure 2
Figure 2
IL-4/G-CSF polarized bone marrow neutrophils enhance RGC survival and axon regrowth. a-c, Ly6G+ BMNΦ, polarized under the indicated conditions, were co-cultured with primary RGCs for 24 hours. RGCs and NΦ were either plated in direct contact with one another (a, b), or separated across a transwell (c). a, Representative images of RGCs from each group (scale bar = 20 μm). b, c, Mean length of the longest neurite grown by cultured RGCs. Each symbol represents one RGC. (n=3 mice per condition, > 400 RGCs per condition). RGCs were cultured with recombinant ciliary neurotrophic factor (CNTF) as a positive control, or media alone as a negative control (n > 150 RGCs per condition). Statistical significance was determined by one way ANOVA followed by Dunnett’s post hoc test. Data shown from one experiment, representative of three independent experiments. d-g, Mice were injected i.o. with IL-4/G-CSF polarized or unpolarized BMNΦ, or with PBS alone, on days 0 and 3 post-ONC injury. RGC uptake and anterograde transport of Alexa 647 conjugated CTB tracer was assessed on day 14 post-ONC. d, Representative images of optic nerves from each group. Scale bar, 200 μm. e, Density of CTB+ regenerating axons in longitudinal optic nerve sections, counted at serial distances from the crush site (n=18–20 nerves per group). f, Area under the curve (AUC) measured for each treatment group from the data shown in (e). Each symbol represents results obtained from an individual nerve (n=18–20 nerves per group). e, f, Data are representative of five independent experiments. g, Frequency of viable Brn3a+ RGCs per mm2 in retinal whole mounts (n=8–10 eyes per group). Each symbol represents results obtained from an individual retina. Data are from one experiment, representative of two independent experiments. e, Statistical significance was determined via unpaired t-test with Welch correction. *P < 0.05; **P < 0.01, ***P < 0.001 and ****P < 0.0001, compared with i.o. PBS; # P < 0.05, ##P < 0.01 and ####P < 0.0001, compared with unpolarized NΦ group. f, g, Statistical significance was determined by one-way ANOVA followed by Dunnett’s post hoc test
Figure 3
Figure 3
IL-4/G-CSF polarized neutrophils exhibit a transcriptome indicative of alternative activation and a regenerative phenotype. Purified Ly6G+ BMNΦ, harvested 24 hours after culture with or without the polarizing factors indicated, were analyzed by bulk RNA sequencing. a, Principal component analysis (PCA) plot. Each symbol represents data collected from one biological replicate (n=3). b, c Heat maps depicting scaled expression of selected genes associated with classical activation (b, left panel), alternative activation (b, right panel), or IL-4 signaling (c, left panel), or genes encoding growth factors (c, right panel). d, e, Volcano plots illustrating the differences in gene expression between unpolarized BMNΦ and IL-4/G-CSF polarized BMNΦ (d), and between G-CSF polarized BMNΦ and IL-4/G-CSF polarized BMNΦ (e). Red dots represent genes that are below an adjusted P value of 0.05 and greater than an absolute log2-fold change of 0.25. Green dots represent genes that meet the fold change threshold but not the P value threshold. Blue dots represent genes that meet the p value threshold, but not the fold change threshold
Figure 4
Figure 4
IL-4/G-CSF polarized BMNΦ enhance axon regeneration, in part, via the production of IGF-1 and HBEGF. a, b Ly6G+ BMNΦ were cultured either with recombinant IL-4 and G-CSF, or without recombinant cytokines (Unp), for 24 hours. a, Cells from both groups were harvested, washed, resuspended in fresh media, and cultured without exogenous cytokines. Conditioned media were collected 24 hours later. IGF-1 levels were measured via ELISA. b, HBEGF levels were measured in cell lysates via western blot analysis. Band intensity was normalized to total protein. Data are shown as fold increase over levels in unpolarized cells. a, b, Each dot represents one biological replicate. Pooled from 2 independent experiments. c, d, RGCs were co-cultured with IL-4/G-CSF polarized BMNΦ for 24 hours in the presence or absence of an anti-IGF-1 neutralizing antibody and/or a small molecule antagonist of the EGF receptor (PD153). c, Representative images of RGCs in each experimental group are displayed. Scale bar, 20 μm. d, Each symbol represents one RGC. Some RGCs were cultured with recombinant CNTF, as a positive control, while others were cultured in media alone, as a negative control. (n=3 mice per condition, > 400 RGCs per condition). Data shown are from one experiment, representative of two independent experiments. e-h, On days 0 and 3 post-ONC injury, mice received i.o. injections of PBS or IL-4/G-CSF polarized BMNΦ in combination with IGF-1 neutralizing antibody and PD153, or with control antibody and vehicle. Alexa 647-conjugated CTB tracer was injected i.o. on day 12 post injury. Optic nerves and retinas were harvested 2 days later. e, Representative images of CTB+ optic nerves. Scale bar, 200 μm. f, Density of CTB+ regenerating axons in longitudinal optic nerve sections at serial distances from the crush site (n=15–16 nerves per treatment group; n=8 nerves in PBS control group). Data shown are pooled from two independent experiments. g, Area under the curve (AUC) was measured using the data shown in (f). h, Frequency of viable Brn3a+ RGCs per mm2 in retinal whole mounts. (n=7–9 retinas per group). Data shown from one experiment, representative of two independent experiments. g, h, Each dot represents an individual nerve or retina. a, b, f, Statistical significance was determined by unpaired t-test with Welch correction. g, h, Statistical significance was determined by one-way ANOVA followed by Dunnett’s post hoc test. f, *P < 0.05; **P < 0.01, and ****P < 0.0001, compared with i.o. PBS; # P < 0.05, compared with with αIGF-1 + PD153 group
Figure 5
Figure 5
IL-4/G-CSF polarized neutrophils drive the regeneration of spinal cord axons. Ly6G+ BMNΦ, polarized under the indicated conditions, were harvested, washed, and co-cultured with primary DRG neurons for 24 hours. Other DRG neurons were cultured with NGF as a positive control, or in media alone as a negative control. a, Representative images of DRGs from each group. Scale bar, 100 μm. b, Mean length of the longest neurite grown by the cultured DRG neurons. Each symbol represents one neuron. (n=4 mouse per condition, >400 DRGs per condition). Data shown are from one experiment, representative of three independent experiments. c, Mean length of the longest neurite grown by DRG neurons, co-cultured with BMNΦ across a transwell (n=3 mice per condition, >400 DRGs per condition). Data shown are from one experiment, representative of two independent experiments. d, Spinal cord (SC) axon regeneration in mice following transection of SC dorsal columns and administration of various treatments, as indicated. In one group, mice were injected in the right sciatic nerve with IL-4/G-CSF polarized BMNΦ and in the left sciatic nerve with unpolarized BM NΦ on the day of injury. For an additional negative control, other mice were injected in both sciatic nerves with PBS on the day of SC transection. An independent group of mice was subjected to a conditioning injury via sciatic nerve crush 5 days prior to SC transection, as a positive control. Eight weeks following spinal cord transection, all mice were injected with Texas red-conjugated dextran 3,000 Da MW, in the right sciatic nerve, and Alexa Fluor 680-conjugated 3,000 Da MW in the left sciatic nerve. Spinal cords were harvested 10 days later, cleared and imaged. The data show the distance between the lesion center and the rostral tip of the longest regenerating axon (n=8–10 SCs per group). The vertical line in each box plot represents the median, the box indicates the interquartile range, and the whiskers indicate the minimum and maximum values. Data are shown from one experiment, representative of two independent experiments. b-d, Statistical significance was determined by one-way ANOVA followed by Dunnett’s post hoc test
Figure 6
Figure 6
IL-4/G-CSF polarized CD34+ BM cells contain a subset of neuro-regenerative immature neutrophils. CD34+ human BM cells were cultured in media alone, or in the presence of recombinant human IL-4 and /or G-CSF, for 48 hours. a-d, RNA was extracted from cells in each group for bulk RNA sequencing. a, PCA plot. Each symbol represents 1 biological replicate, each comprised of cells derived from a single unique donor (n=3). b, Heat maps depicting scaled expression of selected genes associated with neuroprotection/ axonal regeneration (left), alternative activation (middle), and granulopoesis (right). c, d, Volcano plots illustrating differences in gene expression comparing unpolarized and IL-4/G-CSF polarized human BM cells (c), and G-CSF polarized and IL-4/G-CSF polarized human BM cells (d). Red dots represent genes that are below an adjusted P value of 0.05 and greater than an absolute log2-fold change of 0.25. Green dots show genes that meet the fold change threshold but not the P value threshold. Blue dots show genes that meet the p value threshold, but not the fold change threshold. e, f Human cortical neurons were co-cultured for 24 hours with polarized or unpolarized human CD34+ BM cells. BM cells derived from unique donors were cultured independently of one another. Additional neurons were cultured with recombinant NGF as a positive control, or in media alone as a negative control. e, Representative images of cortical neurons cultured with BM cells from each group, or with NGF or media alone. Scale bar, 20 μm. f, Mean length of the longest neurite grown by the cultured human cortical neurons. Each symbol represents one neuron. (n= 6 unique donors per set of conditions; > 150 neurons per condition). g-h, IL-4/G-CSF polarized or unpolarized CD34+ human BM cells were analyzed by flow cytometry. g, Representative pseudo-color plots showing expression of CD34 and CD33, gated on viable CD45+CD3− CD19− cells (left and middle panels). Histogram showing CD15 expression, gated on CD34+ cells (black) or CD34− CD33+ cells (red), among the IL-4/G-CSF polarized human BM cells (right panel). h, Percentage of CD45+CD19− CD3− cells that are CD33+ in each group (left panel). CD15 MFI, gating on CD33+ cells (right) (n=3 unique donors). Data shown are from one experiment, representative of two independent experiments. i, Human cortical neurons were co-cultured for 24 hours with either CD34+ or CD34− CD33+ cells, which were FACS sorted from IL-4/G-CSF polarized human BM cells. Additional neurons were cultured with recombinant NGF as a positive control, or in media alone as a negative control. Data are shown as the mean length of the longest neurite grown by the cultured human cortical neurons. Each symbol represents one neuron. (n=2 unique donors, >200 neurons per condition). Data are from one experiment, representative of two independent experiments. f, h, i, Statistical significance was determined by one-way ANOVA followed by Dunnett’s post hoc test

References

    1. Willenborg S., Injarabian L. & Eming S. A. Role of Macrophages in Wound Healing. Cold Spring Harb Perspect Biol 14, doi: 10.1101/cshperspect.a041216 (2022). - DOI - PMC - PubMed
    1. Mantovani A., Biswas S. K., Galdiero M. R., Sica A. & Locati M. Macrophage plasticity and polarization in tissue repair and remodelling. J Pathol 229, 176–185, doi: 10.1002/path.4133 (2013). - DOI - PubMed
    1. Chinetti-Gbaguidi G., Colin S. & Staels B. Macrophage subsets in atherosclerosis. Nat Rev Cardiol 12, 10–17, doi: 10.1038/nrcardio.2014.173 (2015). - DOI - PubMed
    1. Lucas T. et al. Differential roles of macrophages in diverse phases of skin repair. J Immunol 184, 3964–3977, doi: 10.4049/jimmunol.0903356 (2010). - DOI - PubMed
    1. Tourki B. & Halade G. Leukocyte diversity in resolving and nonresolving mechanisms of cardiac remodeling. FASEB J 31, 4226–4239, doi: 10.1096/fj.201700109R (2017). - DOI - PMC - PubMed

Publication types