[Preprint]. 2023 Nov 6:2023.10.31.564838.
doi: 10.1101/2023.10.31.564838.

Nanometer-scale views of visual cortex reveal anatomical features of primary cilia poised to detect synaptic spillover

Affiliations

Nanometer-scale views of visual cortex reveal anatomical features of primary cilia poised to detect synaptic spillover

Carolyn M Ott et al. bioRxiv. .

Update in

Abstract

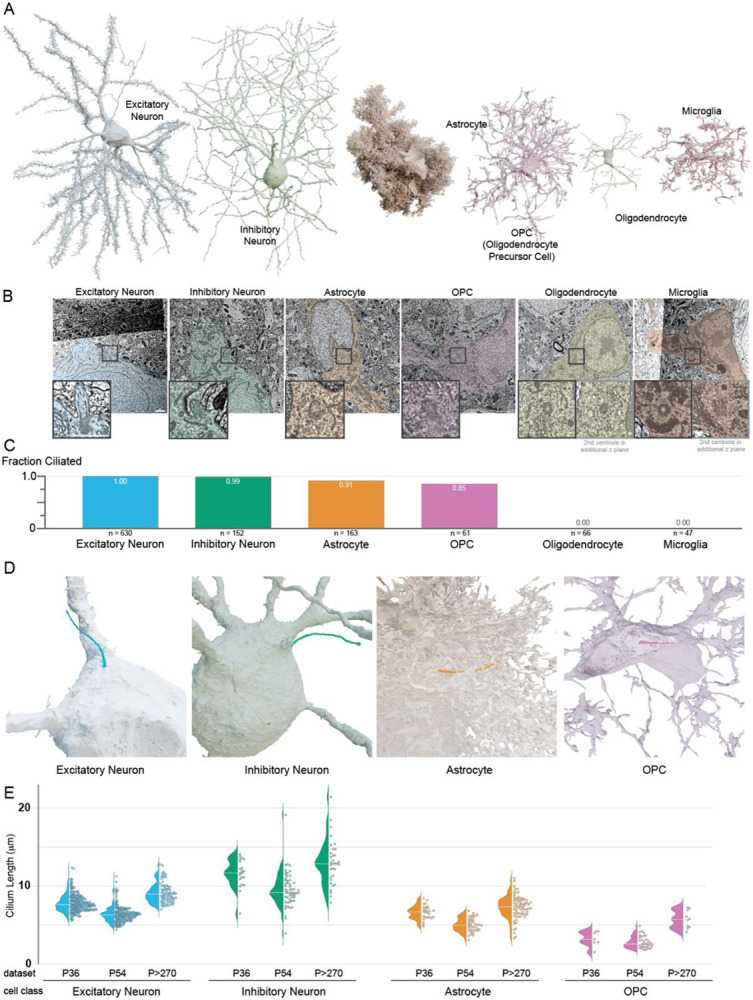
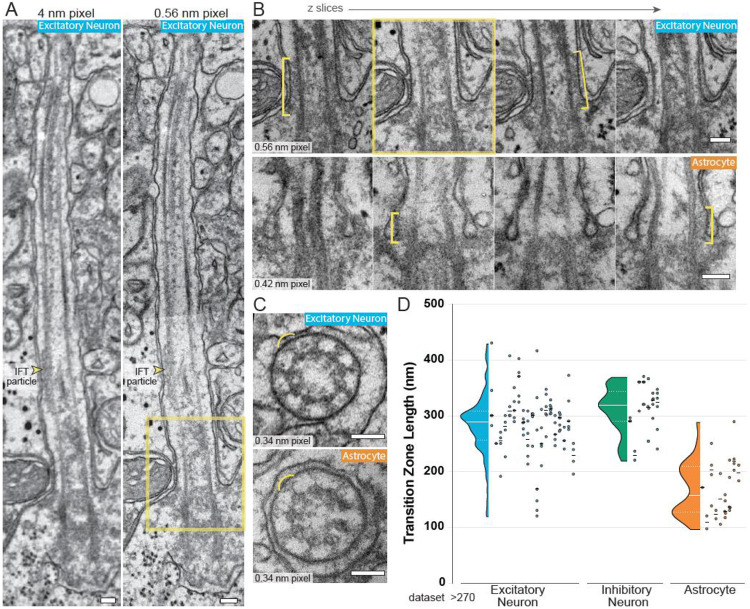
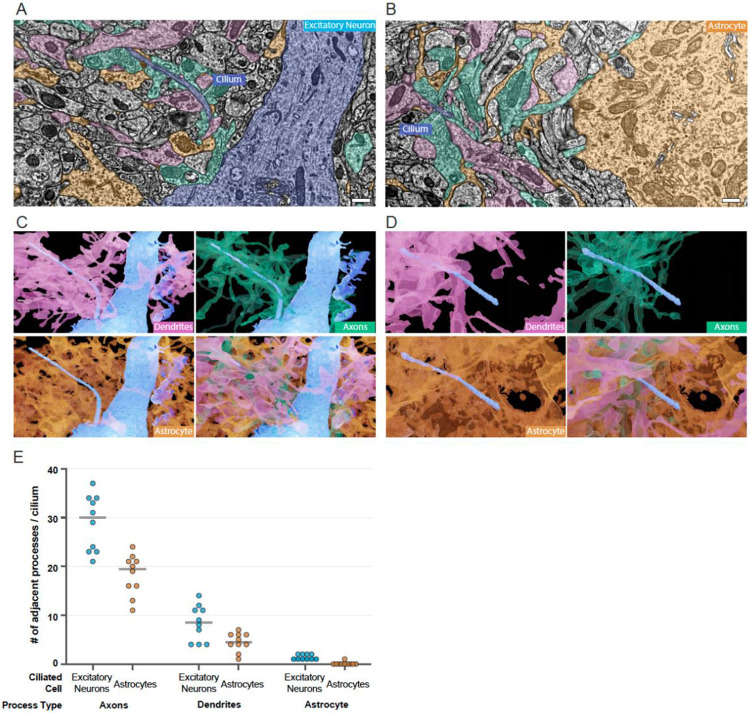
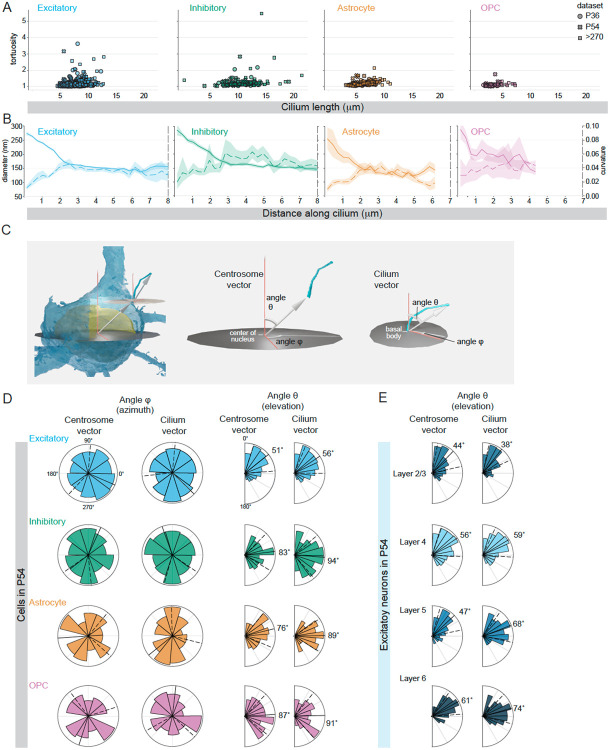
A primary cilium is a thin membrane-bound extension off a cell surface that contains receptors for perceiving and transmitting signals that modulate cell state and activity. While many cell types have a primary cilium, little is known about primary cilia in the brain, where they are less accessible than cilia on cultured cells or epithelial tissues and protrude from cell bodies into a deep, dense network of glial and neuronal processes. Here, we investigated cilia frequency, internal structure, shape, and position in large, high-resolution transmission electron microscopy volumes of mouse primary visual cortex. Cilia extended from the cell bodies of nearly all excitatory and inhibitory neurons, astrocytes, and oligodendrocyte precursor cells (OPCs), but were absent from oligodendrocytes and microglia. Structural comparisons revealed that the membrane structure at the base of the cilium and the microtubule organization differed between neurons and glia. OPC cilia were distinct in that they were the shortest and contained pervasive internal vesicles only occasionally observed in neuron and astrocyte cilia. Investigating cilia-proximal features revealed that many cilia were directly adjacent to synapses, suggesting cilia are well poised to encounter locally released signaling molecules. Cilia proximity to synapses was random, not enriched, in the synapse-rich neuropil. The internal anatomy, including microtubule changes and centriole location, defined key structural features including cilium placement and shape. Together, the anatomical insights both within and around neuron and glia cilia provide new insights into cilia formation and function across cell types in the brain.

Keywords: Cilia; astrocyte; axoneme; centrosome; ciliary pocket; electron microscopy; neuronal cilia; oligodendrocyte precursor cell; transition zone.


Figures

Figure 1:
Figure 1:. Primary cilia are pervasive on neurons, astrocytes and OPCs in primary visual cortex, and absent from oligodendrocytes and microglia
A. 3D renderings of the six cell classes in primary visual cortex annotated in this study. B. Electron micrographs of the cells rendered in A. The inset images show either the base of the cilium or both centrioles for cells that are nonciliated. Scale bar in both image and inset is 1 μm. C. Plot of the fraction of cells with cilia by cell class. D. 3D renderings of the cilia on the cells shown in A. Portions of the astrocyte and OPC were cut away to reveal the cilium. E. Cilium length of every cilium annotated is graphed both as a distribution (left) and individual value (right).
Figure 2:
Figure 2:. Neuron cilia dock directly at the plasma membrane, while glia cilia are associated with a ciliary pocket
A - B. Illustrations of cilia either docked directly at the plasma membrane (Surface Cilium) or recessed in a ciliary pocket (Pocket Cilium) are paired with 3D segmented representations of (A) an excitatory neuron and (B) an astrocyte cilium (cyan) and the cell interior (pink) overlaid onto a single EM plane. C. For each cell class from each EM volume, the fraction of cilia emerging from a ciliary pocket is graphed. D. The ciliary pocket shields the base of the cilium so only a portion of the cilium is external. The distribution of cilium lengths for astrocytes and OPCs in each volume is plotted adjacent to the distribution of the external length of the cilium. E - G. 3D segmented OPC cilia (E, F) or ciliary vesicle (G) (cyan) and cytoplasm (pink) overlaid onto EM images. The ROIs are enlarged to the right of each image to illustrate that the cilium barely emerges (E) or is completely concealed (F). All OPCs without cilia had ciliary vesicles associated with the mother centriole (G). (Several OPC have membrane structures in the ciliary pocket illustrated here in yellow.) Scale bar is 200 nm; inset ROI has a length of 1085 nm. H. The fraction of cilia of each classification is plotted for each volume. n is the number of OPC cells examined in each volume. I. Example images of vesicles inside OPC primary cilia. Scale bar is 200 nm. J. The percentage of annotated cilia with internal cilia vesicles was graphed for each cell class in each dataset.
Figure 3:
Figure 3:. Astrocyte transition zones are shorter than neuron transition zones.
A. To improve the resolution of the transition zone, specific cilia from the P>270 dataset were located on the original EM grids and reimaged at higher resolutions. In A, the image on the left is from the original dataset; the panel on the right was reimaged at higher resolution (two images were aligned to show a similar area). An IFT particle is visible between the ciliary membrane and a microtubule. B. Serial images of the base of an excitatory neuron cilium and an astrocyte cilium are shown. The yellow box indicates the image that matches the ROI in A. The transition zone is visible in alternating slices and is highlighted by a yellow bracket. C. The expected Y-link structures (yellow arcs) of the transition zone are resolved in high-resolution images of cilia cross-sections in both excitatory neuron and astrocyte cilia. D. The length of the transition zone of each cilium sectioned lengthwise in the P>270 dataset was measured in sequential images. The distribution of all length measurements is plotted on the left for each cell class. On the right, the measurements for each individual cilium are plotted in the same column and the mean length for that cilium is represented by a black line. Differences in TZ measurements within a single cilium are likely due to the position of the cilium relative to the sectioning plane. Scale bars in A, B, and C are 100 nm.
Figure 4:
Figure 4:. Microtubule structures reconfigure differently within astrocyte and neuron cilia
A. The illustration represents the microtubule structural transitions observed within cilia. Near the basal body microtubules emerge as doublets configured with A- and B-tubules. Density within the A-tubule ends leaving translucent lumens in both tubules. Some of the microtubules transition to singlets. Both doublet and singlet microtubules have been observed to terminate. B - C. Cross-sections starting near the base of an excitatory neuron cilium (B) and an astrocyte cilium (C). The distance of individual planes from the base of the cilium is indicated below each image (the entire image series are presented in supplemental figures 3 and 4). The yellow arrowheads track the position of the same microtubule through the volume. The orange arrowhead points to densities between the deviant microtubule and adjacent doublets. D. The diameter along the central path length of a proximal portion of the cilium was measured for the cilia in the P54 dataset. The solid lines represent the average diameter of a binned pathlength, with the shading representing the 95% confidence interval of that bin. E. Cross-sections near the tips of different cilia display the diversity of microtubule configurations. F. Serial cross-sections from the distal region of an excitatory neuron cilium were located on the original grids and imaged at higher resolution. The images in the lower panel have been inverted and colored to highlight the electron densities (yellow) that bridge between the ciliary membrane and microtubules (cyan) or between individual microtubules. All scale bars are 100 nm.
Figure 5:
Figure 5:. The ciliary pocket reduces the number of processes adjacent to astrocyte cilia in the dense neuropil
A - B. Cilia on an excitatory neuron (A) or Astrocyte (B) in the P36 dataset are shown in blue. Every process in the neuropil that passes adjacent to any portion of the cilium was colored by processes type: dendrites are pink, axons are teal and astrocyte processes are orange. The apical dendrite of the excitatory neuron is blue (A), and the cytoplasm of the astrocyte is also orange (B). C-D. 3D renderings of the dendrites, axons, and astrocytic processes adjacent to each cilium from A and B. E. Every adjacent process was classified for 10 excitatory neurons and 10 astrocytes in the P36 dataset. The total processes of each type are graphed according to cell class.
Figure 6:
Figure 6:. Dense core vesicles are located in the vicinity of cilia
A. The features within 1 μm of an excitatory neuron cilium (center) include dense core vesicles (yellow arrowheads). B. A 3D representation of the dense core vesicles within 1 μm of the cilium shown in A. C. The number of dense core vesicles within 1 μm of individual cilia is plotted against cilium length.
Figure 7:
Figure 7:. Synapses
A. Synapses near an inhibitory neuron cilium are shown as pink disks. The EM images to two of these synapses are shown as insets. The upper inset is a cilium directly adjacent to the cilium and the lower inset is a synapse that is proximal to the cilium. B. Euclidean distance to the closest synapse for each cilium in the P54 dataset by was quantified by cell class. C. The number of synapses within 1 μm of each P54 cilium is graphed relative to cilium length. For astrocyte and OPC cilia we plotted the number of synapses relative to the external cilium length. The solid line shows a linear regression fit across the dataset (white line, β=4.08 R2=0.668). Also graphed is the linear regression fit of the mean number of synapses adjacent to each cilium randomly placed in 1000 positions and orientations in the EM volume (dashed line, β=3.59 R2=0.996, includes the external cilia pathlength). Shading is the 95% ci. The histograms on the top show the class distributions of cilia lengths. On the right of the graph, the class distributions of the number of synapses within 1 μm are shown both as observed near cilia in the data (measured) and for comparison, as calculated if the same cilia were randomly placed in the EM volume (random).
Figure 8:
Figure 8:. Cilium shape, placement, and orientation can be stereotyped within a cell class
A. For each cilium analyzed, the tortuosity is plotted relative to cilium length. B. The diameter along the length of each cilium in the P54 dataset are plotted on the left y-axis (solid line) and the local curvature of each cilium is plotted using the right y-axis (dotted line). For each the 95% confidence interval is indicated by the shading around the line. The value of the diameters within the first 5 μm are also presented in Figure 6. C. Two vectors were created to analyze cilium placement and orientation: the centrosome vector originates at the center of the nucleus and extends to the mother centriole while the cilium vector extends from the base of the cilium to the tip. The azimuth is represented by the angle φ and the elevation by the angle θ. The spherical coordinate system is defined by a zenith representing an axis from white matter to pia. D. Polar plots show the distribution of centrosome and cilia vectors for each cell in each class in the P54 dataset. The value of the circular mean is indicated and represented by a solid black line and the dotted lines represent the circular standard deviation around the mean. E. The centrosome and cilium vectors of Excitatory neurons in each layer are plotted.

References

    1. Akella J.S., Silva M., Morsci N.S., Nguyen K.C., Rice W.J., Hall D.H., and Barr M.M.. 2019. Cell type-specific structural plasticity of the ciliary transition zone in C. elegans. Biol Cell. 16:541. doi:10.1111/boc.201800042. - DOI - PMC - PubMed
    1. Allen R.A. 1965. Isolated cilia in inner retinal neurons and in retinal pigment epithelium. J Ultra Mol Struct R. 12:730–747. doi:10.1016/s0022-5320(65)80058-2. - DOI - PubMed
    1. Arellano J.I., Guadiana S.M., Breunig J.J., Rakic P., and Sarkisian M.R.. 2012. Development and distribution of neuronal cilia in mouse neocortex. J Comp Neurol. 520:848–873. doi:10.1002/cne.22793. - DOI - PMC - PubMed
    1. Aten S., Kiyoshi C.M., Arzola E.P., Patterson J.A., Taylor A.T., Du Y., Guiher A.M., Philip M., Camacho E.G., Mediratta D., Collins K., Boni K., Garcia S.A., Kumar R., Drake A.N., Hegazi A., Trank L., Benson E., Kidd G., Terman D., and Zhou M.. 2022. Ultrastructural view of astrocyte arborization, astrocyte-astrocyte and astrocyte-synapse contacts, intracellular vesicle-like structures, and mitochondrial network. Prog Neurobiol. 213:102264. doi:10.1016/j.pneurobio.2022.102264. - DOI - PMC - PubMed
    1. Banks G., Lassi G., Hoerder-Suabedissen A., Tinarelli F., Simon M.M., Wilcox A., Lau P., Lawson T.N., Johnson S., Rutman A., Sweeting M., Chesham J.E., Barnard A.R., Horner N., Westerberg H., Smith L.B., Molnár Z., Hastings M.H., Hirst R.A., Tucci V., and Nolan P.M.. 2017. A missense mutation in Katnal1 underlies behavioural, neurological and ciliary anomalies. Mol Psychiatr. 23:713–722. doi:10.1038/mp.2017.54. - DOI - PMC - PubMed

Publication types