[Preprint]. 2023 Oct 31:2023.10.26.564223.
doi: 10.1101/2023.10.26.564223.

Parabrachial Calca neurons drive nociplasticity

Affiliations

Parabrachial Calca neurons drive nociplasticity

Logan F Condon et al. bioRxiv. .

Update in

  • Parabrachial Calca neurons drive nociplasticity.
    Condon LF, Yu Y, Park S, Cao F, Pauli JL, Nelson TS, Palmiter RD. Condon LF, et al. Cell Rep. 2024 Apr 23;43(4):114057. doi: 10.1016/j.celrep.2024.114057. Epub 2024 Apr 6. Cell Rep. 2024. PMID: 38583149 Free PMC article.

Abstract

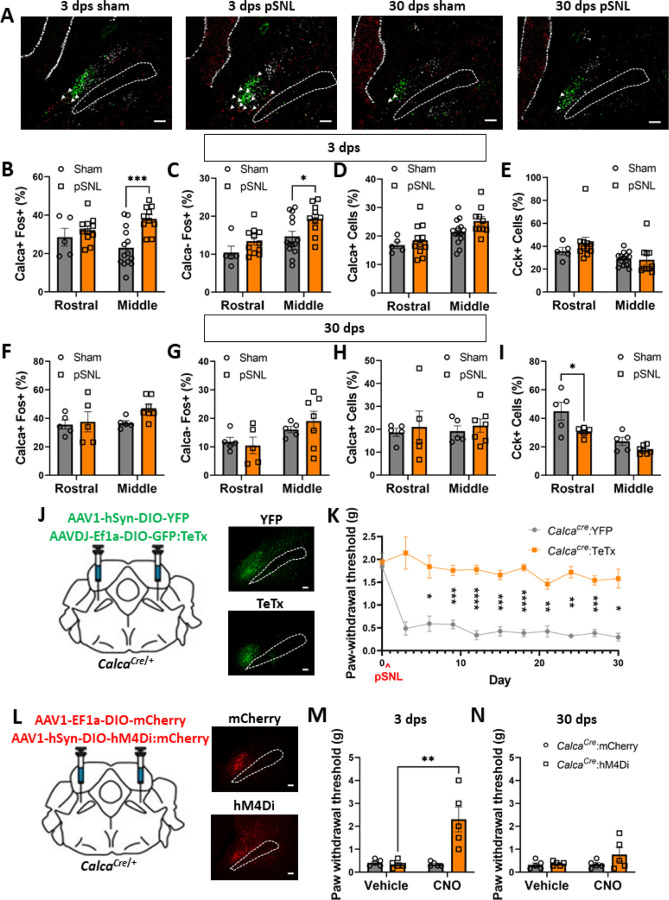
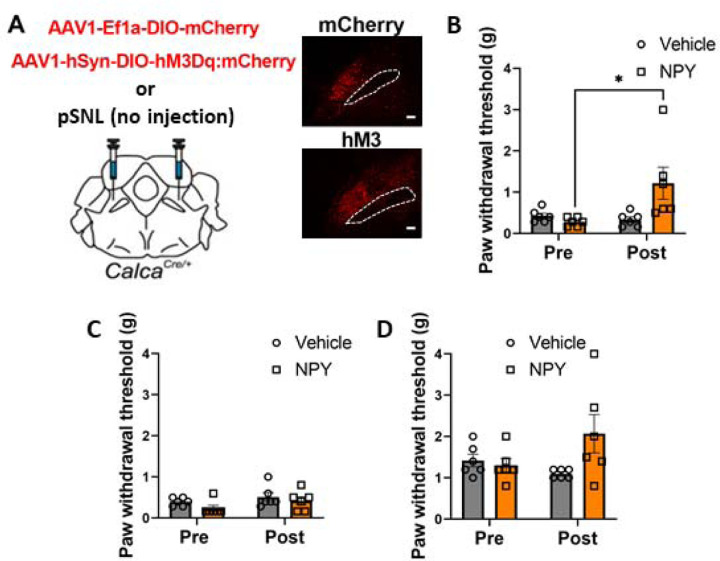
Pain that persists beyond the time required for tissue healing and pain that arises in the absence of tissue injury are poorly understood phenomena mediated by plasticity within the central nervous system. The parabrachial nucleus (PBN) is a hub that relays aversive sensory information and appears to play a role in nociplasticity. Here, by preventing PBN Calca neurons from releasing neurotransmitter or directly stimulating them we demonstrate that activation of Calca neurons is both necessary for the manifestation of chronic pain after nerve ligation and is sufficient to drive nociplasticity in wild-type mice. Aversive stimuli such as exposure to nitroglycerin, cisplatin, or LiCl can drive nociplasticity in a Calca-neuron-dependent manner. Calcium fluorescence imaging reveals that nitroglycerin activates PBN Calca neurons and potentiates their responses to mechanical stimulation. The activity and excitability of Calca neurons increased for several days after aversive events, but prolonged nociplasticity likely occurs in downstream circuitry.


Conflict of interest statement

DECLARARTION OF INTERSTS Authors declare no conflicting interests.

Figures

Figure 1.
Figure 1.. Parabrachial Calca neurons are necessary for the induction of neuropathic pain
(A) Representative images from RNAscope in situ hybridization on tissue slices collected 3 or 30 days post sham or pSNL surgery with probes targeting Calca (green), Fos (red), and Cck (white). Scale bar = 100 µm, dotted line marks the superior cerebellar peduncle (SCP), anterior-posterior Bregma level = −5.1. (B) pSNL increased Fos mRNA in Calca neurons in the middle, but not the rostral, PBN at 3 dps. (C) pSNL increased Fos mRNA in non-Calca neurons in the middle, but not the rostral, PBN at 3 dps. (D) pSNL did not change the number of Calca-positive neurons in the rostral or middle PBN at 3 dps. (E) pSNL did not change the number of Cck positive cells in the rostral or middle PBN at 3 dps. (B-E) Rostral sham n = 5, middle sham n = 14, rostral pSNL n = 11, and middle pSNL n = 10. (F) pSNL did not drive an increase in the expression of Fos mRNA in Calca neurons at 30 dps. (G) pSNL did not drive an increase in the expression of Fos mRNA in non-Calca neurons at 30 dps. (H) pSNL did not change the number of Calca positive neurons in the rostral or middle PBN at 30 dps. (I) pSNL decreased the number of Cck positive neurons in the rostral, but not the middle, PBN at 30 dps. (F-I) Rostral sham n = 5, middle sham n = 5, rostral pSNL n = 5, and middle pSNL n = 7. (J) Bilateral injections of AAV1-hSYN-DIO-YFP or AAVDJ-Ef1a-DIO-GFP:TeTx into the PBN of CalcaCre/+ mice. Representative images show expression of YFP and TeTx. Scale bar = 100 µm, dotted line marks the SCP, anterior-posterior Bregma level = −5.1. (K) TeTx expression in PBN Calca neurons prevents the development of pSNL driven allodynia measured by von Frey assay. CalcaCre/+:YFP n = 5 and CalcaCre/+:TeTx n = 5. (L) Bilateral injections of AAV1-SYN-DIO-mCherry or AAV1-CBA-DIO-hM4Di:mCherry into the PBN of CalcaCre/+ mice. Representative images show expression of mCherry and hM4Di:mCherry. Scale bar = 100 µm, dotted line marks the SCP, anterior-posterior Bregma level = −5.1. (M) hM4Di/CNO inhibition of PBN Calca neurons ameliorates pSNL driven allodynia at the 3 dps, measured by von Frey assay. CalcaCre/+:mCherry n = 5 and CalcaCre/+:hM4Di n = 5. (N) hM4Di/CNO inhibition of PBN Calca neurons ameliorates pSNL driven allodynia at the 30 dps, measured by von Frey assay. CalcaCre/+:mCherry n = 5 and CalcaCre/+:hM4Di n = 5.
Figure 2.
Figure 2.. Activation of parabrachial Calca neurons is sufficient to drive nociplasticity
(A) Bilateral injections of AAV1-Ef1a-DIO-mCherry or AAV1-hSyn-DIO-hM3Dq:mCherry into the PBN of Calcacre/+ mice. Representative images show expression of mCherry and hM3Dq. Scale bar = 100 µm, dotted line marks the SCP, anterior-posterior Bregma level = −5.1. (B) 3 days of CNO injection (1 mg/kg, i.p.) resulted persistent allodynia measured by von Frey assay. Calcacre/+:mCherry n = 5 and Calcacre/+:hM3Dq n = 7. (C) Behavior timeline for von Frey (VF), Hargreave’s (HG), and hot plate (HP) assays before and after 5 consecutive days of CNO injection. CalcaCre/+:mCherry n = 6 and Calcacre/+:hM3Dq n = 6. (D) 5 days of CNO injection decreased paw-withdrawal threshold, measured by von Frey assay, which persists after the last CNO injection. (E) 5 days of CNO injection decreased in paw-withdrawal latency, measured by Hargreave’s assay, which persists after the last CNO injection. (F) 5 days of CNO injection increases nocifensive behaviors, measured by hot plate assay, which persists after the last CNO injection. (G) 3 days of CNO injection (1 mg/kg, i.p.) resulted in persistent allodynia measured by von Frey assay. CalcaCre/Cre:mCherry n = 6 and CalcaCre/Cre:hM3Dq n = 6. (H) pSNL produced allodynia in Calca-null mice measured by von Frey assay.
Figure 3.
Figure 3.. Nociplastic effect scales with the duration of Calca neuron activation
(A) Bilateral injections of AAV1-Ef1a-DIO-mCherry or AAV1-hSyn-DIO-hM3Dq:mCherry into the PBN of Calcacre/+ mice. Representative images show expression of mCherry and hM3Dq. Scale bar = 100 µm, dotted line marks the SCP, anterior-posterior Bregma level = −5.1. (B) 1 day of CNO injection (1 mg/kg, i.p.) produced allodynia measured by von Frey assay. Calcacre/+:mCherry n = 4 and Calcacre/+:hM3Dq n = 7. (C) Bilateral injections of AAV1-Ef1a-DIO-mCherry or AAV1-Ef1a-DIO-ChR2:mCherry into the PBN of Calcacre/+ mice. Representative images show expression of mCherry and ChR2. Scale bar = 100 µm, dotted line marks the SCP, anterior-posterior Bregma level = −5.1.. (D) 20 min of 473-nm photostimulation (20 Hz, 2 s on 2 s off) resulted in allodynia measured by von Frey assay. Calcacre/+:mCherry n = 6 and Calcacre/+:ChR2 n = 7. (E) 5 min of 473-nm photostimulation (20 Hz, 2 s on 2 s off) resulted in allodynia measured by von Frey assay. Calcacre/+:mCherry n = 4 and Calcacre/+:ChR2 n = 5. (F) 5 days of 5-min, 473-nm photostimulation (20 Hz, 2 s on 2 s off) resulted in allodynia measured by von Frey assay. Calcacre/+:mCherry n = 4 and Calcacre/+:ChR2 n = 4.
Figure 4.
Figure 4.. Chronic exposure to all aversive stimuli tested drives nociplasticity regardless of sensory modality
(A) 5 days of NTG exposure (10 mg/kg, i.p.) produced allodynia measured by von Frey assay. Vehicle n = 4 and NTG n = 4. (B) 3 days of LiCl exposure (0.2 M, 15 mL/kg, i.p.) produced allodynia measured by von Frey assay. Vehicle n = 6 and LiCl n = 8. (C) 3 days of robobug chase (10 min) produced allodynia measured by von Frey assay. Vehicle n = 5 and robobug n = 5. (D) Bilateral injections of AAV1-hSYN-DIO-YFP or AAVDJ-Ef1a-DIO-GFP:TeTx into the PBN of CalcaCre/+ mice. Representative images show expression of YFP and TeTx. Scale bar = 100 µm, dotted line marks the SCP, anterior-posterior Bregma level = −5.1. (E) TeTx expression in PBN Calca neurons prevented the development of NTG-driven allodynia measured by von Frey assay. CalcaCre/+:YFP n = 6 and CalcaCre/+:TeTx n = 5. (F) TeTx expression in PBN Calca neurons prevented the development of cisplatin-driven allodynia measured by von Frey assay. CalcaCre/+:YFP n = 6 and CalcaCre/+:TeTx n = 6.
Figure 5.
Figure 5.. Chronic stimulation of PBN Calca neurons alters their intrinsic excitability
(A) Bilateral injections of AAV1-Ef1a-DIO-mCherry or AAV1-hSyn-DIO-hM3Dq:mCherry into the PBN of Calcacre/+ mice followed by 3 days of CNO or saline injection and 48 h of no stimulation prior to electrophysiology. (B) Representative images of PBN (10x; scale bar, 100 µm), patched cell (40x; scale bar, 10 µm), and hM3Dq expression (40x; scale bar, 10 µm) under patch microscope. (C) Representative trace of spikes elicited by CNO. (D) Representative traces showing regular firing Calca neurons. (E) 3 days of CNO injection (i.p.) prior to electrophysiology resulted in an increase in the number of spikes elicited by current injection in the regular-firing population. Saline-treated n = 3 animals, 14 neurons; CNO treated n = 3 animals, 11 neurons. (F) Representative traces showing late firing Calca neurons. (G) 3 days of CNO injection (i.p.) prior to electrophysiology resulted in an increase in the number of spikes elicited by current injection in the late-firing population. Saline-treated n = 3 animals, 5 neurons; CNO treated n = 3 animals, 11 neurons.
Figure 6.
Figure 6.. Calca neuron activity during the development of mechanical allodynia.
(A) Schematic depiction of Ca2+ imaging during NTG induced mechanical allodynia. (B) Multi-day tracking of Calca neuron fluorescent activity. Top; Field of view (FOV) of representative animal for 4 days. Bottom; representative neural activities throughout 4 days of 3 neurons marked by arrows in FOVs. (C) NTG injection increased unstimulated neuronal activity. Elevated neuronal activity persisted 24 and 48 h post injection. Individual neurons are aligned across days in heatmap. (D) Average calcium transient area under the curve increased following NTG injection. This increase in fluorescent activity remained elevated 24 and 48 h post injection. (E) NTG injection increased the number of times out of 8 applications that mice responded to a 0.4 g von Frey filament. Bar indicates mean ± S.E.M. (F) Representative traces of filament-evoked neural activities. (G) The number of Calca neurons responsive to application of a 0.4 g von Frey filament increased after NTG injection. The increase in responsive neurons persisted 24 and 48 h after NTG injection. (H) The percentage of Calca neurons responsive to application of a 0.4 g von Frey filament increased from 24% after vehicle injection to 49.5% after NTG injection. The percent of 0.4 g von Frey filament-responsive neurons remained elevated, at 40.5%, 24 and 48 h after NTG injection. (I) The majority of neurons unresponsive to 0.4 g von Frey filament application following vehicle injection (i.p.) became responsive to the 0.4 g filament following NTG injection (i.p.). (J) About half of neurons responsive to 0.4 g von Frey filament application following vehicle injection (i.p.) became unresponsive to the 0.4 g filament following NTG injection (i.p.). (A – J) n = 4 animals, 79 neurons.
Figure 7.
Figure 7.. Intrathecal NPY does not reverse hM3Dq/CNO-driven allodynia.
(A) pSNL or bilateral injections of AAV1-Ef1a-DIO-mCherry or AAV1-hSyn-DIO-hM3Dq:mCherry into the PBN of Calcacre/+ mice. Representative images show expression of mCherry and hM3Dq. Scale bar = 100 µm, dotted line marks the SCP, anterior-posterior Bregma level = −5.1. (B) Intrathecal (i.t.) injection of NPYLeu,Pro into pSNL animals reversed pSNL driven allodynia. (C) I.t. injection of NPYLeu,Pro into CalcaCre:hM3Dq animals treated with CNO for 3 days did not reverse allodynia. (C) I.t. injection of NPYLeu,Pro into control CalcaCre:mCherry animals treated with CNO for 3 days did not affect the paw withdrawal threshold.

References

    1. Abraham A.D., Leung E.J.Y., Wong B.A., Rivera Z.M.G., Kruse L.C., Clark J.J., Land B.B. (2020). Orally consumed cannabinoids provide long-lasting relief of allodynia in a mouse model of chronic neuropathic pain. Neuropsychopharmacology 45, 1105–1114. 10.1038/s41386-019-0585-3. - DOI - PMC - PubMed
    1. Alhadeff A.L., Su Z., Hernandez E., Klima M.L., Phillips S.Z., Holland R.A., Guo C., Hantman A.W., De Jonghe B.C., Betley J.N. (2018). A neural circuit for the suppression of pain by a competing need state. Cell 173, 140–152. 10.1016/j.cell.2018.02.057. - DOI - PMC - PubMed
    1. Allen H.N., Chaudhry S., Hong V.M., Lewter L.A., Sinha G.P., Carrasquillo Y., Taylor B.K., Kolber B.J. (2023). A parabrachial-to-amygdala circuit that determines hemispheric lateralization of somatosensory processing. Biol. Psychiatry. 93, 370–381. 10.1016/j.biopsych.2022.09.010. - DOI - PMC - PubMed
    1. Arguis M.J., Perez J., Martínez G., Ubre M., Gomar C. (2008). Contralateral neuropathic pain following a surgical model of unilateral nerve injury in rats. Reg. Anesth. Pain Med. 33, 211–216. 10.1016/j.rapm.2007.12.003. - DOI - PubMed
    1. Arthurs J.W., Bowen A.J., Palmiter R.D., Baertsch N.A. (2023). Parabrachial tachykinin1-expressing neurons involved in state-dependent breathing control. Nat Commun. 14, 963. 10.1038/s41467-023-36603-z. - DOI - PMC - PubMed

Publication types