[Preprint]. 2024 Nov 1:2023.10.28.564543.
doi: 10.1101/2023.10.28.564543.

Phenotypic complexities of rare heterozygous neurexin-1 deletions

Affiliations

Phenotypic complexities of rare heterozygous neurexin-1 deletions

Michael B Fernando et al. bioRxiv. .

Update in

  • Phenotypic complexities of rare heterozygous neurexin-1 deletions.
    Fernando MB, Fan Y, Zhang Y, Tokolyi A, Murphy AN, Kammourh S, Deans PJM, Ghorbani S, Onatzevitch R, Pero A, Padilla C, Williams SE, Flaherty EK, Prytkova IA, Cao L, Knowles DA, Fang G, Slesinger PA, Brennand KJ. Fernando MB, et al. Nature. 2025 Jun;642(8068):710-720. doi: 10.1038/s41586-025-08864-9. Epub 2025 Apr 9. Nature. 2025. PMID: 40205044

Abstract

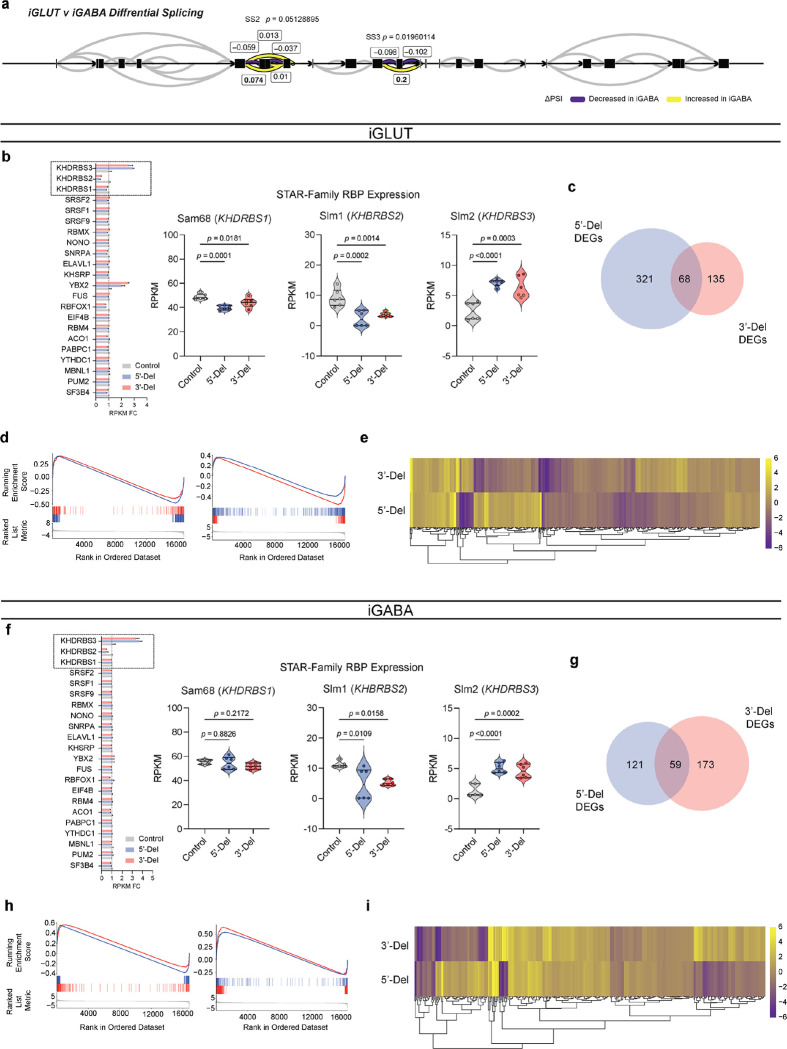
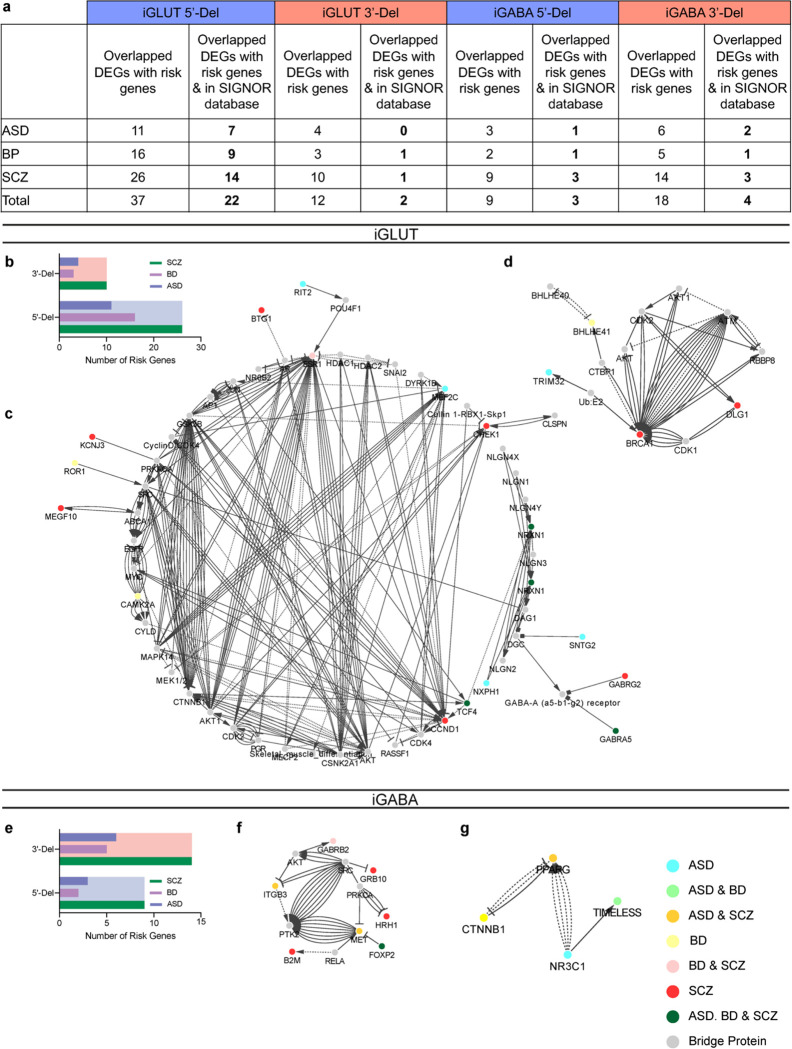
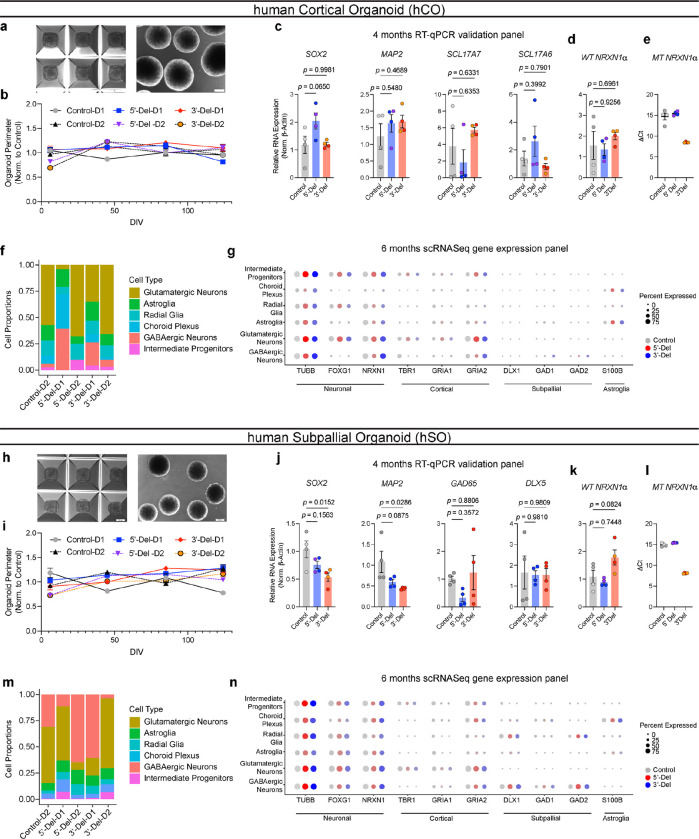
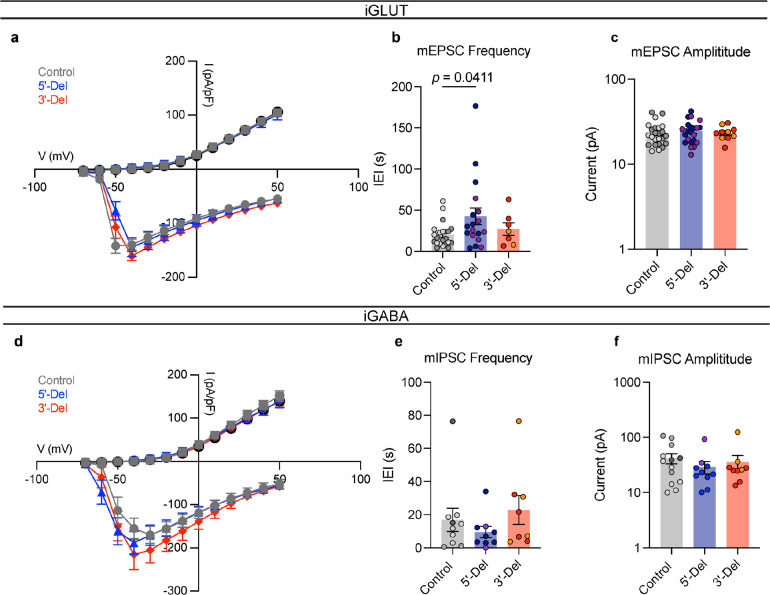
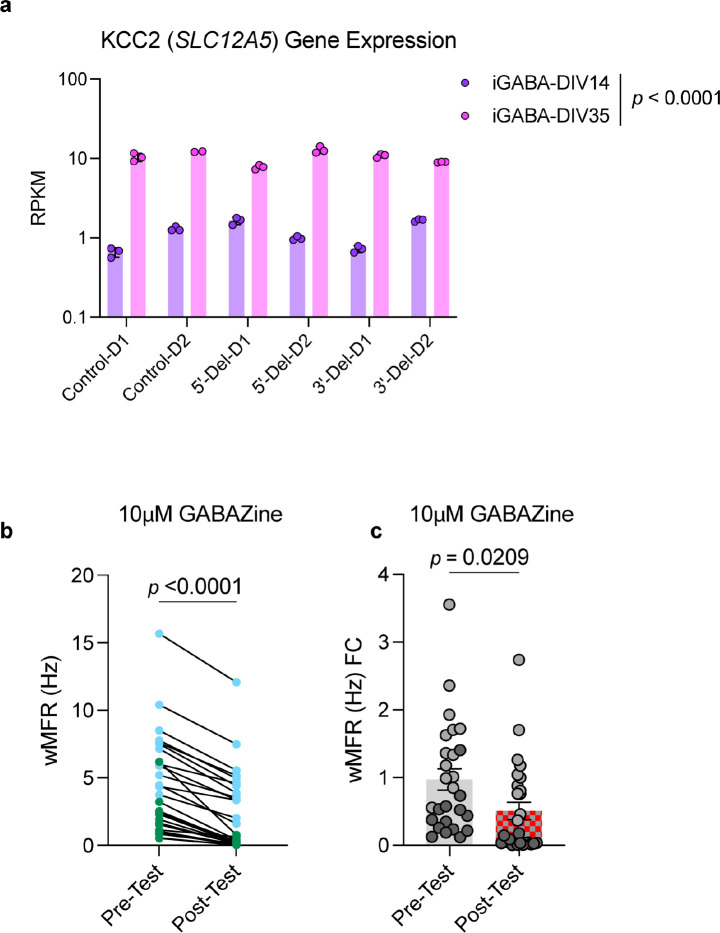
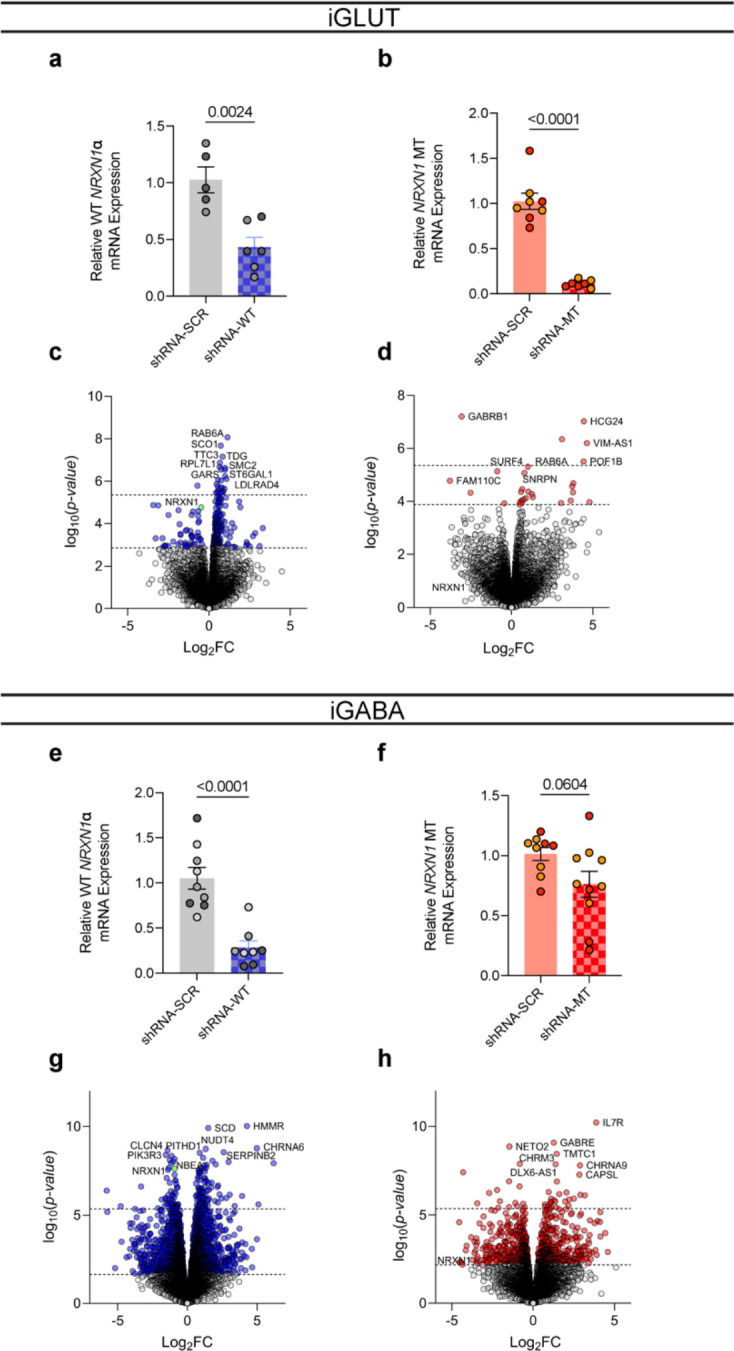
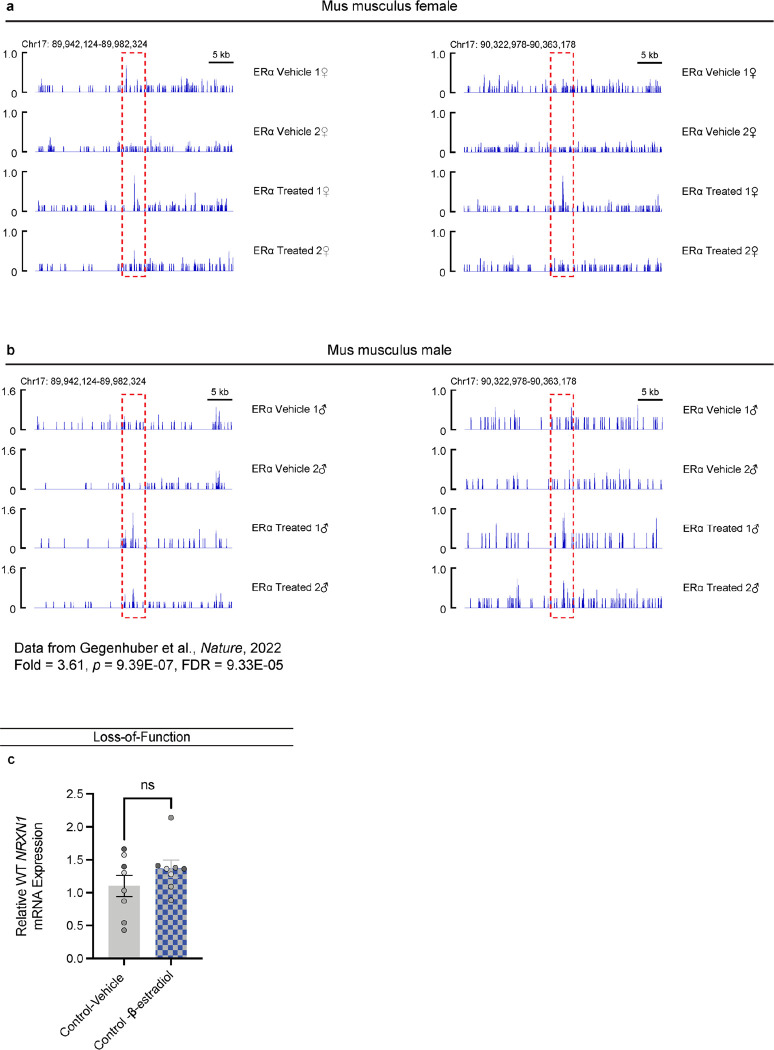
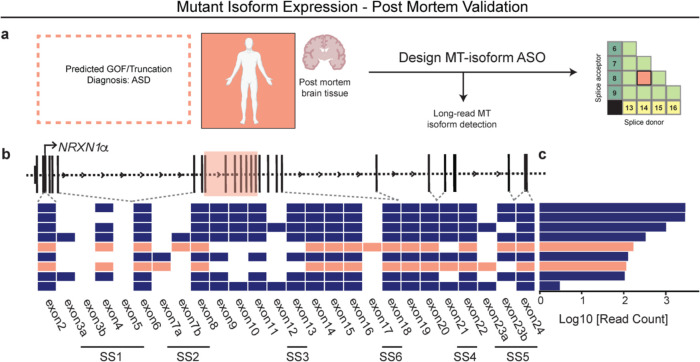
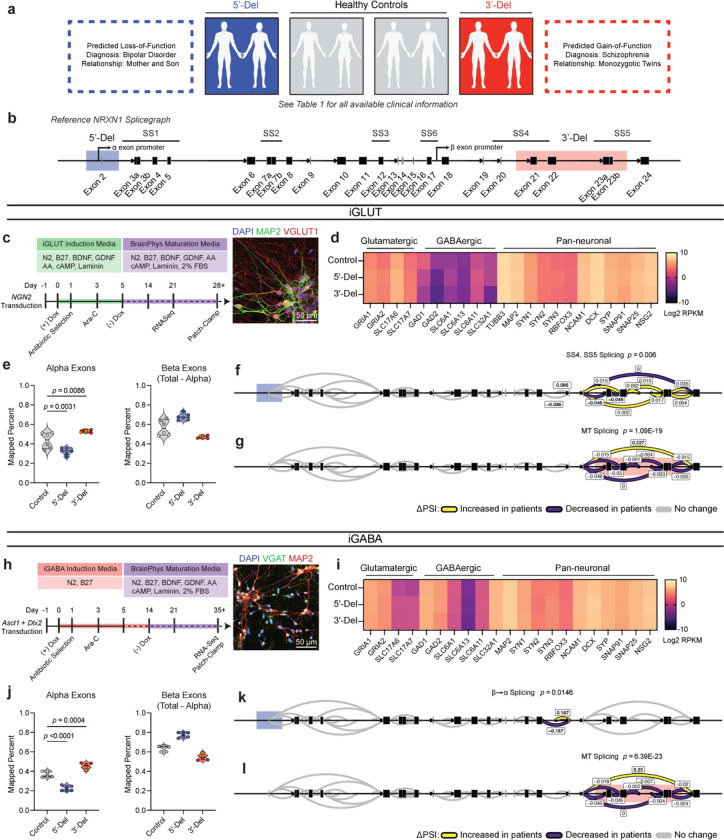
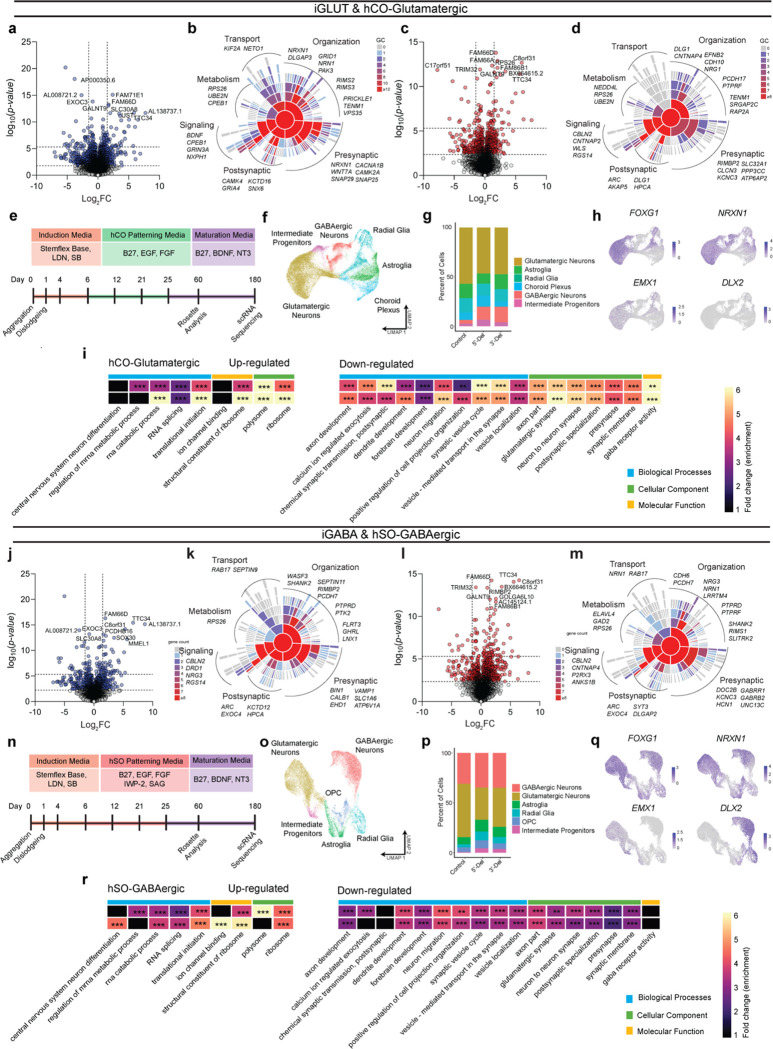
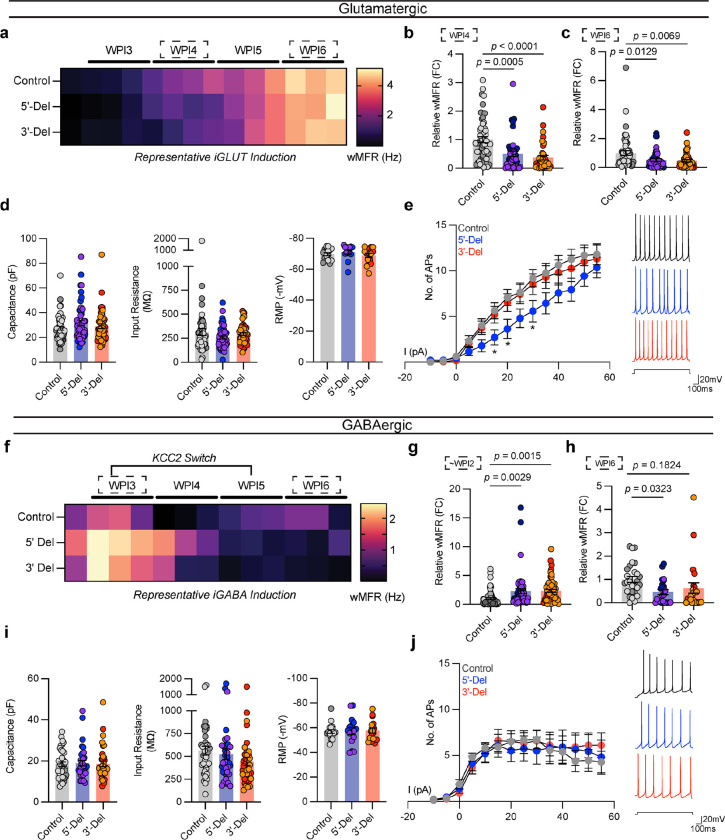
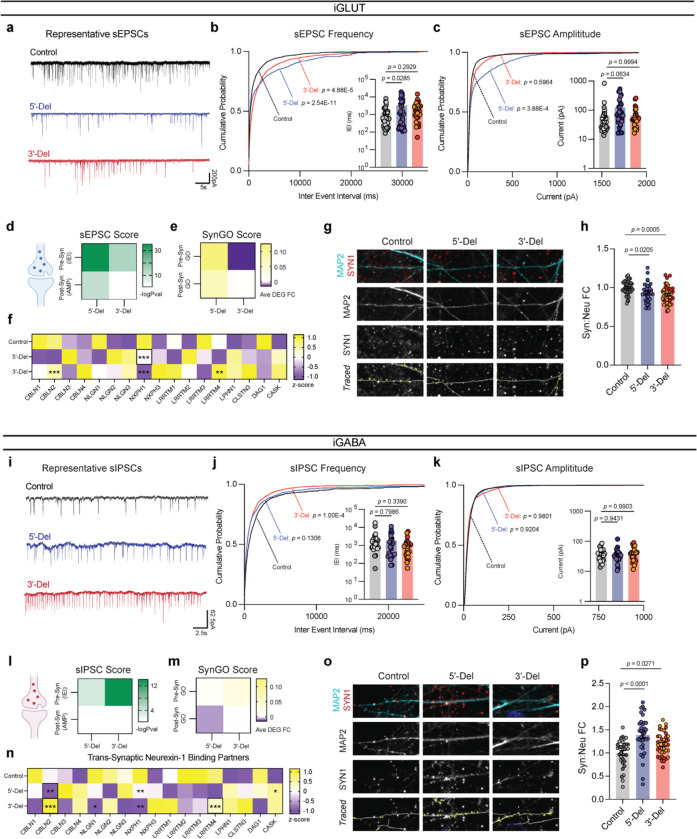
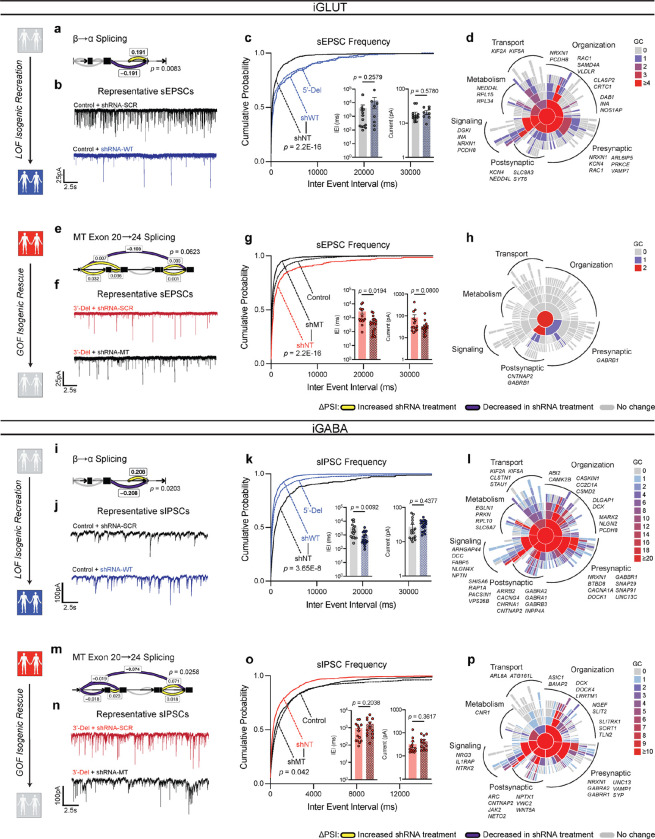
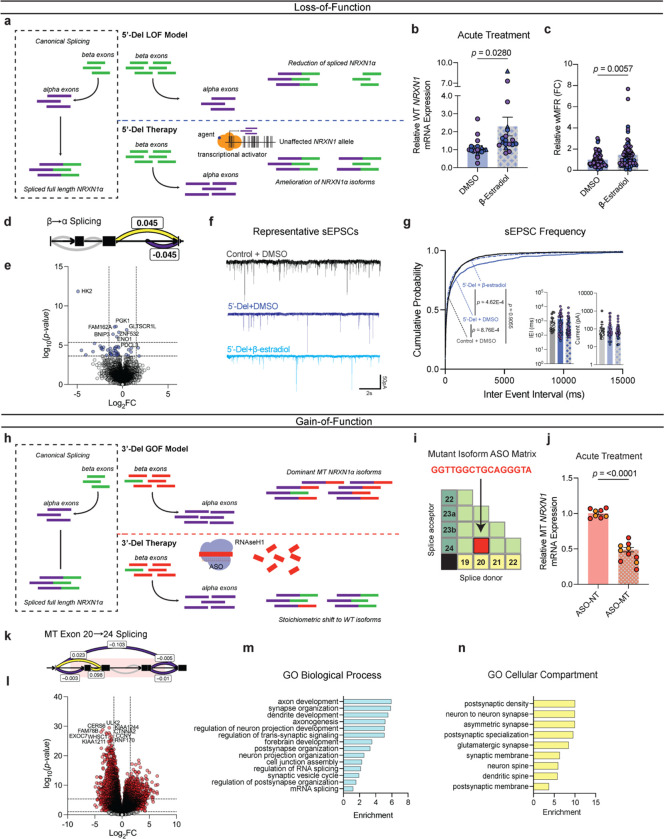
Given the large number of genes significantly associated with risk for neuropsychiatric disorders, a critical unanswered question is the extent to which diverse mutations --sometimes impacting the same gene-- will require tailored therapeutic strategies. Here we consider this in the context of rare neuropsychiatric disorder-associated copy number variants (2p16.3) resulting in heterozygous deletions in NRXN1, a pre-synaptic cell adhesion protein that serves as a critical synaptic organizer in the brain. Complex patterns of NRXN1 alternative splicing are fundamental to establishing diverse neurocircuitry, vary between the cell types of the brain, and are differentially impacted by unique (non-recurrent) deletions. We contrast the cell-type-specific impact of patient-specific mutations in NRXN1 using human induced pluripotent stem cells, finding that perturbations in NRXN1 splicing result in divergent cell-type-specific synaptic outcomes. Via distinct loss-of-function (LOF) and gain-of-function (GOF) mechanisms, NRXN1 +/- deletions cause decreased synaptic activity in glutamatergic neurons, yet increased synaptic activity in GABAergic neurons. Reciprocal isogenic manipulations causally demonstrate that aberrant splicing drives these changes in synaptic activity. For NRXN1 deletions, and perhaps more broadly, precision medicine will require stratifying patients based on whether their gene mutations act through LOF or GOF mechanisms, in order to achieve individualized restoration of NRXN1 isoform repertoires by increasing wildtype, or ablating mutant isoforms. Given the increasing number of mutations predicted to engender both LOF and GOF mechanisms in brain disorders, our findings add nuance to future considerations of precision medicine.

Keywords: GABAergic neurons; Human induced pluripotent stem cells; NRXN1; alternative splicing; disease modeling; genomics; glutamatergic neurons; neuropsychiatric disorder; precision medicine.


Conflict of interest statement

Ethics declarations / Competing interest statement. All authors have no competing interests to declare.

Figures

Extended Data Figure 1:
(a) Splicegraph displaying significant gene wide splicing clusters at NRXN1 SS3 (p = 0.0196), compared via Dirichlet-multinomial generalized linear model with Bonferroni corrections. (b, f) Gene expression fold-change of select NRXN1 predicted RNA-binding proteins (RBP) across patients and control iGLUT and iGABA neurons, with statistical comparisons for STAR-Family RBPs. (c, g) Overlap of DEGs and (d,h) gene set enrichment analysis (GSEA) between genotypes. (e,i) Distinct gene expression patterns by hierarchal clustering of all patient specific DEGs. Sample information correspond to Fig. 1
Extended Data Figure 2:
Extended Data Figure 2:. Extended transcriptomics analysis on disease risk associated genes.
(a) Summary table of overlapping DEGs with risk enrichments across publicly curated datasets for autism (ASD), bipolar disorder (BD) and schizophrenia. (b, e) Enrichment of genes across neuropsychiatric disorders for iGLUT and iGABA neurons. (c) Interaction maps of risk genes for 5’-Del iGLUT, (d) 3’-Del iGLUT, (f) 5’-Del iGABA and (g) 5’-iGABA. Sample information correspond to Fig. 1
Extended Data Figure 3:
Extended Data Figure 3:. Extended data on human organoid generation and characterization.
(a,h) Representative images of hiPSC aggregation and immature spheroids post dislodging. (b,i) Normalized organoid perimeters over time (compared to averaged control), hCO (n = 6 donors | 2 batches | 72–161 organoids) and hSO (n = 6 donors | 2 batches | 46–134 organoids). (c, j) RT-qPCR results from 4-month organoids of genes for pluripotency, neuronal, and cell-type specific markers. (d-e, k-l) RT-qPCR results of NRXN1 WT and MT expression hCO (n = 6 donors | 1 representative batch | 12 samples) and hSO (n = 6 donors | 1 representative batch | 12 samples). Statistical tests used were 1-way ANOVAs with Dunnett’s test. (f, m) relative proportions of cell clusters across individual donors, (hCO = 47,460 cells) and (hSO = 35,563 cells). (g, n) Comprehensive gene expression panel across sub-clusters of hCO and hSO samples across neuronal, cortical, subpallial and astroglia markers. Data corresponds to Fig 2.
Extended Data Figure 4:
Extended Data Figure 4:. Extended data on electrophysiological properties of 5’-Del and 3’-Del neurons.
(a) Voltage-gated potassium and channel kinetics across genotypes for iGLUT neurons (n = 6 donors | 2 inductions | 45 neurons). (b) Comparative mEPSC kinetics of IEI and (c) amplitude size from iGLUT neurons (n= 6 donors | 4 inductions | 47 neurons), compared via a 1-way ANOVA with Dunnett’s test. (d) Voltage-gated potassium and channel kinetics across genotypes for iGABA neurons (n = 6 donors | 2 inductions | 34 neurons). (e) Comparative mIPSC kinetics of (a) IEI and (f) amplitude size from iGABA neurons (n= 6 donors | 3 inductions | 27 neurons), compared via a 1-way ANOVA with Dunnett’s test. See Supplementary Table 5 for all summary statistics.
Extended Data Figure 5:
Extended Data Figure 5:. Extended KCC2 related data from immature GABA neurons.
(a) Transcriptomic comparison of SLC12A5 expression across DIV14 and DIV35 RNASeq timepoints. (b,c) MEA tests from pre- and post-treatment of 10uM GABAzine. (n = 2 donors | 1 representative induction | 28 MEA wells) Statistical tests are paired student’s t-test for time-linked comparison and unpaired student’s t-test for pre/post activity foldchange.
Extended Data Figure 6:
Extended Data Figure 6:. shRNA knockdown validation.
(a) Extent of shRNA knockdown on WT and (b) MT NRXN1 expression in iGLUT neurons (n = 2 donors | 1–3 inductions). (c) Extent of shRNA knockdown on WT and (d) MT NRXN1 expression in iGABA neurons, (n = 2–3 donors | 1–3 inductions) Statistical tests used were Student’s t-test.
Extended Data Figure 7:
Extended Data Figure 7:. ChIP-seq enrichment of ER1 binding at NRXN1 loci in rodent brain.
(a) Female and (b) male mus musculus ChIP tracts of NRXN1 locus, with red dashed areas highlighting binding enrichment across vehicle and estradiol treated mice. (c) Effect of beta-estradiol on control donors (n = 16/4 | Representative).
Extended Data Figure 8:
Extended Data Figure 8:. In-vivo validation of MT isoform expression from an unrelated autism NRXN1+/− patient.
(a) Schematic of novel NRXN1 autism patient, and GOF therapeutic targeting pipeline, with (b) schematic of the NRXN1α isoform structures, with each row representing a unique NRXN1α isoform and each column representing a NRXN1 exon. The colored isoforms (navy, wildtype; peach, patient-specific) are spliced into the transcript while the blank exons are spliced out. (c) The abundance of each NRXN1α isoform by sample.
Figure 1.
Figure 1.. Aberrant NRXN1 splicing across human iPSC derived glutamatergic (iGLUT) and GABAergic (iGABA) neurons.
(a) Brief description of clinical information of all hiPSC lines used in this study, and (b) schematic of NRXN1 gene structure as a splicegraph, denoting splice sites (SS1–6), with red and blue shades corresponding on 3’-Del and 5’-Del genotypes, respectively. Arrows indicate relative internal promoter positions. (c, h) Induction timeline and factors to generate iGLUT and iGABA neurons, with immunostaining validation of neuronal identity (MAP2), glutamate identity (vGLUT1), and GABA identity (vGAT). (d, i). Gene expression panel confirming abundance of neuronal markers and neurotransmitter identity in iGLUT (n: Control = 6/2; 5’-Del = 6/2; 3’-Del = 6/2 | 1 batch) and in iGABA neurons (n: Control = 5/2; 5’-Del = 6/2; 3’-Del = 6/2 | 1 batch). (e, j) Mapped percent of alpha NRXN1 exon reads in iGLUT, compared via a 1-way ANOVA, with Dunnett’s test (F2, 15 = 25.70; 5’-Del p = 0.0031, 3’-Del p = 0.0086), and iGABA neurons (F2, 14 = 92.92; 5’-Del p < 0.001, 3’-Del p = 0.0004), with beta NRXN1 exon reads, calculated by subtracting alpha-specific reads against total reads. (f, k) Splicegraphs displaying significant gene wide splicing clusters, compared via Dirichlet-multinomial generalized linear model with Bonferroni corrections, for 5’-Del iGLUT (SS4 and SS5 cluster p = 0.006) and iGABA neurons (β→α cluster p = 0.0146), and for (g, l) 3’-Del iGLUT (SS4 and SS5 cluster p = 1.09E-19) and iGABA neurons (SS4 and SS5 cluster p = 6.39E-23). n reported as samples/donors | independent batches.
Figure 2:
Figure 2:. Transcriptomic impact of NRXN1+/− in induced (iGLUT/iGABA) and organoid-derived hCO-glutamatergic and hSO-GABAergic neurons.
(a, c) Volcano plots of differential gene expression (DE) analysis across both genotypes in iGLUT and (j, l) iGABA neurons. Vertical dashed lines represent DE genes ±1.5 Log2FC. Horizontal dashed lines represent FDR = 0.1 cutoff (lower) and Bonferroni corrected cutoff (upper). (b, d) Sunburst plots of all FDR corrected DEGs with SynGO annotated synapse function for iGLUT and (k, m) iGABA neurons. (e, n) Timeline of neural organogenesis for hCO and hSOs (f, o), UMAPs of hCO and hSO organoid samples sequenced at 6 months, annotated by cell clusters, and (g, p) relative proportions of cell clusters across genotypes, (hCO = 47,460 cells) and (hSO = 35,563 cells). (h, q) validation of regionalization across forebrain (FOXG1), dorsal (EMX1) and ventral (DLX2) regions, with NRXN1 expression across all cells. (i, r) Gene ontological analysis results using DEGs from scRNASeq. *P < 0.05, **P < 0.01, ***P <0.001, Wilcoxon’s rank sum test, FDR = 0.05. Data represented as mean ± sem. n reported as samples/donors | independent batches.
Figure 3.
Figure 3.. Spontaneous, passive, and excitable properties are minimally changed from NRXN1+/− induced neurons.
(a, f) Timelapse of multi-electrode array recordings every 2–3 days apart starting near ~DIV12 for a single representative induction. Tiles represent averaged wMFR values across genotypes during a single recording session. (b) MEA quantification of iGLUT neuronal activity, compared via a 1-way ANOVA, with Dunnett’s test (n: Control = 52/2; 5’-Del = 42/2; 3’-Del = 38/2 | 3 batches) at WPI4 (F2, 129 = 12.77; 5’-Del p = 0.0005, 3’-Del p < 0.0001), and (c) WPI6 (F2, 129 = 5.737; 5’-Del p = 0.0129, 3’-Del p = 0.0069). (d) intrinsic properties of iGLUT neurons (n: Control = 51/2; 5’-Del = 51/2; 3’-Del = 48/2 | 8 batches): compared via 1-way ANOVA, with Dunnett’s test, Capacitance (F2, 147 = 1.505; 5’-Del p = 0.1565, 3’-Del p = 0.7633), Input resistance (F2, 147 = 1.311; 5’-Del p = 0.1949, 3’-Del p = 0.7906), and RMP (n: Control = 16/2; 5’-Del = 14/2; 3’-Del = 16/2 | 2 batches) compared via 1-way ANOVA, with Dunnett’s test (F2, 43 = 0.8234; 5’-Del p = 0.6378, 3’-Del p = 0.8468). (e) Input-output curves of excitable properties (n: Control = 16/2; 5’-Del = 14/2; 3’-Del = 16/2 | 2 batches), with representative traces (right), compared via Step × Genotype 2-way ANOVA; Dunnett’s Test (F26, 559 = 1.690, 5’-Del p < 0.01 at Step 6, 7 and 9, 3’-Del p = n.s. on all steps). (g) MEA quantification of iGABA neuronal activity, compared via a 1-way ANOVA, with Dunnett’s test (n: Control = 71/2; 5’-Del = 48/2; 3’-Del = 55/2 | 5 batches) at WPI2 (F2, 171 = 7.805; 5’-Del p = 0.0029, 3’-Del p = 0.0015), and (h) WPI5 (n: Control = 27/4; 5’-Del = 23/2; 3’-Del = 23/2 | 2 batches) compared via 1-way ANOVA, with Dunnett’s test (F2, 70 = 3.158; 5’-Del p = 0.0323, 3’-Del p = 0.1824). (i) intrinsic properties of iGABA neurons (n: Control = 39/2; 5’-Del = 34/2; 3’-Del = 37/2 | 6 batches): compared via 1-way ANOVA, with Dunnett’s test, Capacitance (F2, 107 = 0.04256; 5’-Del p = 0.9425, 3’-Del p = 0.9941), Input resistance (n: Control = 39/2; 5’-Del = 34/2; 3’-Del = 36/2 | 6 batches, F2, 106 = 1.451; 5’-Del p = 0.8162, 3’-Del p = 0.1703) and RMP (n: Control = 18/2; 5’-Del = 16/2; 3’-Del = 16/2 | 2 batches) compared via 1-way ANOVA, with Dunnett’s test (F2, 47 = 0.02842; 5’-Del p = 0.9893, 3’-Del p = 0.9601). (j) Input-output curves of excitable properties (n: Control = 16/2; 5’-Del = 14/2; 3’-Del = 16/2 | 2 batches), with representative traces (right), compared via Step × Genotype 2-way ANOVA; Dunnett’s Test (F26, 572 = 0.5137, 5’-Del and 3’-Del p = n.s. on all steps). Data represented as mean ± sem. n reported as samples/donors | independent batches.
Figure 4:
Figure 4:. Divergent impact on neurotransmission from NRXN1+/− induced neurons.
(a) Representative traces of iGLUT sEPSCs. (b) Cumulative probabilities and log-scaled cell averages of inter-event-internals (IEIs) across genotypes (n: Control = 39/4; 5’-Del = 33/3; 3’-Del = 29/2 | 6), compared by Levene’s Test with Bonferroni correction for averaged distributions (5’-Del F = 46.635, df = 1, p = 2.54E-11; 3’-Del F = 17.928, df = 1, p = 4.88E-5), and 1-way ANOVA, with Dunnett’s test for inset (F2, 98 = 3.117; 5’-Del p = 0.0285, 3’-Del p = 0.2929). (c) Cumulative probabilities and log-scaled cell averages of amplitude size across genotypes, compared by Levene’s Test with Bonferroni correction for averaged distributions (5’-Del F = 14.15, df = 1, p = 3.88E-4; 3’-Del F = 1.0851, df = 1, p = 0.5964), and 1-way ANOVA, with Dunnett’s test for inset (F2, 98 = 2.839; 5’-Del p = 0.0634, 3’-Del p = 0.9994). (d) Transformed p-values of Levene’s Test and (e) SynGO gene-set averaged log2FC values across pre- or post-synaptic genes. (f) Gene expression panel (z-scores), of canonical NRXN1 binding partners in iGLUT neurons, boxes indicate reaching genome wide significance. (g) Representative images of iGLUT synaptic puncta traced (SYN1) onto dendrites (MAP2), and (h) normalized fold change of SYN1 puncta to length of MAP2 ratio (Syn:Neu), (n: Control = 40/2; 5’-Del: 39/2; 3’-Del: 40/2), compared via 1-way ANOVA, with Dunnett’s test (F2, 116 = 7.538, 5’-Del p = 0.0205, 3’-Del p = 0.0005). (i) Representative traces of iGABA sIPSCs. (j) Cumulative probabilities and log-scaled cell averages of inter-event-internals (IEIs) across genotypes (n: Control = 26/2; 5’-Del = 25/3; 3’-Del = 22/2 | 4), compared by Levene’s Test with Bonferroni correction for averaged distributions (5’-Del F = 3.4002, df = 1, p = 0.1306; 3’-Del F = 16.501, df = 1, p = 1.00E-04), and 1-way ANOVA, with Dunnett’s test for inset (F2, 70 = 0.8296; 5’-Del p = 0.7986, 3’-Del p = 0.339). (k) Cumulative probabilities and log-scaled cell averages of amplitude size across genotypes, compared by Levene’s Test for averaged distributions (5’-Del F = 0.1, df = 1, p = 0.9204; 3’-Del F = 0.0006, df = 1, p = 0.9801), and 1-way ANOVA, with Dunnett’s test for inset (F2, 70 = 0.08143; 5’-Del p = 0.9431, 3’-Del p = 0.9904). (l) Transformed p-values of Levene’s Test and (m) SynGO gene-set averaged log2FC values across pre- or post-synaptic genes. (n) Gene expression panel (z-scores), of canonical NRXN1 binding partners in iGABA neurons, boxes indicate reaching genome wide significance. (o) Representative images of iGABA synaptic puncta traced (SYN1) onto dendrites (MAP2), and (p) normalized fold change of SYN1 puncta to length of MAP2 ratio (Syn:Neu), (n: Control = 33/2; 5’-Del: 36/2; 3’-Del: 40/2), compared via 1-way ANOVA, with Dunnett’s test (F2, 101 = 12.59, 5’-Del p < 0.0001, 3’-Del p = 0.0271). *p < 0.05, **p < 0.01, ***p <0.001, Wilcoxon’s rank sum test, FDR = 0.05. Data represented as mean ± sem. n reported as samples/donors | independent batches.
Figure 5:
Figure 5:. Isogenic recapitulation and rescue of neurotransmission phenotypes.
(a) Differential splicing of β→α cluster in shWT, compared via Dirichlet-multinomial generalized linear model (p = 0.0083) in iGLUT neurons. (b) Representative traces of iGLUT WT knockdown effects, with (c) cumulative probabilities of sEPSC IEI distributions, with insets of cell-averaged IEI and amplitude measures (n: shNT = 12/1; shWT = 7/1 | 2 batches). Curves were compared via a Levene’s test (F = 70.78, df =1, p < 2.2E-16), and insets were compared via a Student’s t-test (IEI t=1.166, df=19, p = 0.2579; AMP t=0.5661, df=19, p = 0.578). (d) SynGO (biological process) sunburst plots showing enrichment of DEGs associated with synaptic function for iGLUT WT-KD compared to a brain expressed background via Fisher’s exact test (1.274161-fold, p = 0.1049). (e) Splicing of MT exon 20→24 cluster in shMT, compared via Dirichlet-multinomial generalized linear model (p = 0.0623). (f) Representative traces of iGLUT MT knockdown effects, with (g) cumulative probabilities of sEPSC IEI distributions, with insets of cell-averaged IEI and amplitude measures (n:shNT = 14/1; shMT = 18/1 | 2 batches). Curves were compared via a Levene’s test (F = 230.6; df = 1, p < 2.2E-16), and insets were compared via a Student’s t-test (IEI t=2.471, df=30, p = 0.0194; AMP t=1.812, df=30, p = 0.08). (h) SynGO (biological process) sunburst plots showing enrichment of DEGs associated with synaptic function for iGLUT MT-KD compared to a brain expressed background via Fisher’s exact test (1.214533-fold, p = 0.4541). (i) Differential splicing of β→α cluster in shWT, compared via Dirichlet-multinomial generalized linear model (p = 0.0203) in iGABA neurons. (j) Representative traces of iGABA WT knockdown effects, with (k) cumulative probabilities of sIPSC IEI distributions, with insets of cell-averaged, IEI and amplitude measures (shNT = 16/3; shWT = 19/3 | 2 batches). Curves were compared via a Levene’s test (F = 30.879, df =1, p < 3.66E-08), and insets were compared via a Student’s t-test (IEI t=2.768, df=33, p = 0.0092; AMP t=0.7856, df=33, p = 0.4377). (l) SynGO (biological process) sunburst plots for iGABA WT-KD compared to a brain expressed background via Fisher’s exact test (1.234861-fold, p = 1.307E-6). (m) Splicing of MT exon 20→24 cluster in shMT, compared via Dirichlet-multinomial generalized linear model (p = 0.0258) in iGABA neurons. (n) Representative traces of iGABA MT knockdown effects, with (o) cumulative probabilities of sIPSC IEI distributions, with insets of cell-averaged, IEI and amplitude measures (shNT = 16/1; shMT = 19/1 | 2 batches). Curves were compared via a Levene’s test (F = 4.1324; df = 1, p < 0.04226), and insets were compared via a Student’s t-test (IEI t=1.305, df=25, p = 0.2038; AMP t=0.9292, df=25, p = 0.3617). (p) SynGO (biological process) sunburst plots for iGABA WT-KD compared to a brain expressed background via Fisher’s exact test (1.347225-fold, p = 2.694E-4). Data represented as mean ± sem. n reported as samples/donors | independent batches.
Figure 6:
Figure 6:. Precise therapeutic targeting of stratified GOF- and LOF-NRXN1+/− in iGLUT neurons.
(a) Model and proposed mechanism of rescue for LOF patients ameliorating loss of wildtype isoforms. (b) RT-qPCR of WT NRXN1 gene expression in 5-Del patients, post-acute treatment (3–5 days) (n: DMSO = 19/2; β-estradiol = 18/2 | 3 batches) compared via Student’s t-test t=2.293, df=35, p = 0.028. (c) Quantification of iGLUT neuronal activity at WPI3 across vehicle and treatment (n: DMSO = 72/3; β-estradiol = 74/3 | 3 batches) compared via Student’s t-test (t=2.804, df=144, p = 0.0057). (d) Splicing of β→α cluster and (e) volcano plot of DEGs in β-estradiol treated 5’-Del iGLUT neurons, compared to vehicle treated 5’-Del iGLUT neurons. (f) Representative patch-clamp traces and (h) cumulative probabilities of sEPSC IEI distributions, with insets of cell-averaged, IEI and amplitude measures (n: Control + DMSO = 18/1; 5’-Del + DMSO = 33/2 5’-Del + β-estradiol = 35/2). Curves were compared via Levene’s test with Bonferroni corrections (Control + DMSO v. 5’-Del + DMSO F = 13.151; df = 1, p = 8.763E-4; 5’Del + DMSO v 5’-Del + β-estradiol F = 14.359; df = 1, p = 4.62E-04; Control + DMSO v 5’-Del + β-estradiol, F = 0.0141; df = 1, p = 0.955). Insets were compared via Student’s t-test (IEI t=1.161, df=66, p = 0.2499). (h) Model and proposed mechanism of rescue for GOF patients expressing mutant isoforms. (i) Schematic of a NRXN1 ASO matrix, with the selective sequence targeting 20/24 splice junction. (j) RT-qPCR of MT NRXN1 gene expression in 3’-Del patients’ post-acute treatment for 72hrs (ASO-NT = 8/2; ASO-MT = 10/2 | batches), compared via Student’s t-test t=12.91, df=16 p < 0.0001. (k) Splicing of MT Exon 20→24 cluster and (l) volcano plot of DEGs in ASO-MT treated 3’-Del iGLUT neurons, compared to ASO-NT treated 3’-Del iGLUT neurons.(m) Biological process and (n) cellular compartment GO terms demonstrating enrichment (−log10[adj p value]) of selected synapse related pathways. Data represented as mean ± sem. n reported as samples/donors | independent batches.

Similar articles

References

    1. Sudhof T. C. Synaptic Neurexin Complexes: A Molecular Code for the Logic of Neural Circuits. Cell 171, 745–769 (2017). - PMC - PubMed
    1. De Wit J. & Ghosh A. Specification of synaptic connectivity by cell surface interactions. Nat. Rev. Neurosci. 17, 4–4 (2016). - PubMed
    1. Gomez A. M., Traunmüller L. & Scheiffele P. Neurexins: molecular codes for shaping neuronal synapses. Nat. Rev. Neurosci. 22, 137–151 (2021). - PMC - PubMed
    1. Schreiner D. et al. Targeted Combinatorial Alternative Splicing Generates Brain Region-Specific Repertoires of Neurexins. Neuron 84, 386–398 (2014). - PubMed
    1. Fuccillo M. V. et al. Single-Cell mRNA Profiling Reveals Cell-Type-Specific Expression of Neurexin Isoforms. Neuron 87, 326–340 (2015). - PMC - PubMed

Publication types