[Preprint]. 2023 Nov 2:rs.3.rs-3446960.
doi: 10.21203/rs.3.rs-3446960/v1.

Hepatic lipid-associated macrophages mediate the beneficial effects of bariatric surgery against MASH

Affiliations

Hepatic lipid-associated macrophages mediate the beneficial effects of bariatric surgery against MASH

Xavier Revelo et al. Res Sq. .

Update in

  • TREM2 macrophages mediate the beneficial effects of bariatric surgery against MASH.
    Fredrickson G, Florczak K, Barrow F, Mahmud S, Dietsche K, Wang H, Parthiban P, Hakeem A, Almutlaq R, Adeyi O, Herman A, Bartolomucci A, Staley C, Dong X, Jahansouz C, Williams JW, Mashek DG, Ikramuddin S, Revelo XS. Fredrickson G, et al. Hepatology. 2025 Jun 1;81(6):1776-1791. doi: 10.1097/HEP.0000000000001098. Epub 2024 Sep 18. Hepatology. 2025. PMID: 39292863 Free PMC article.

Abstract

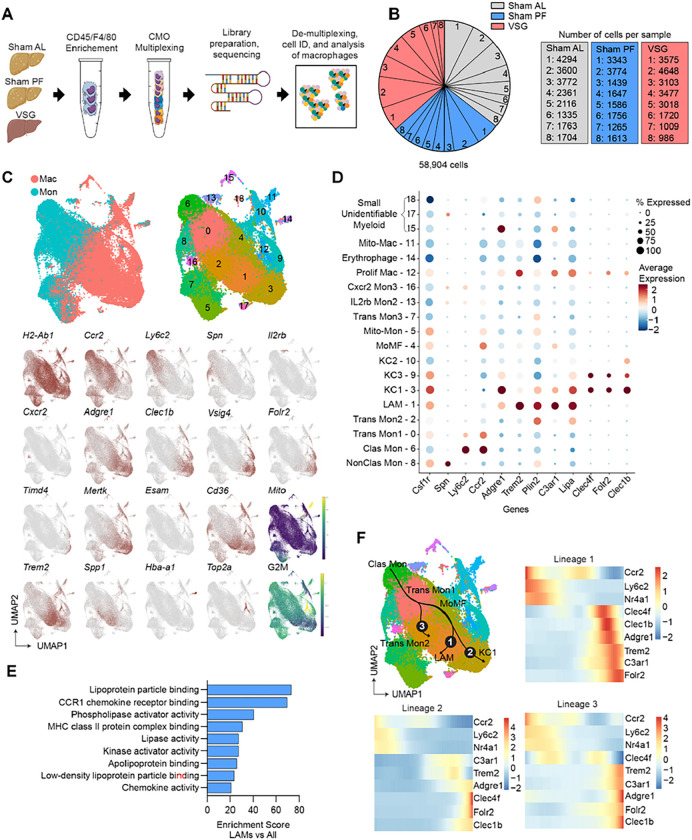
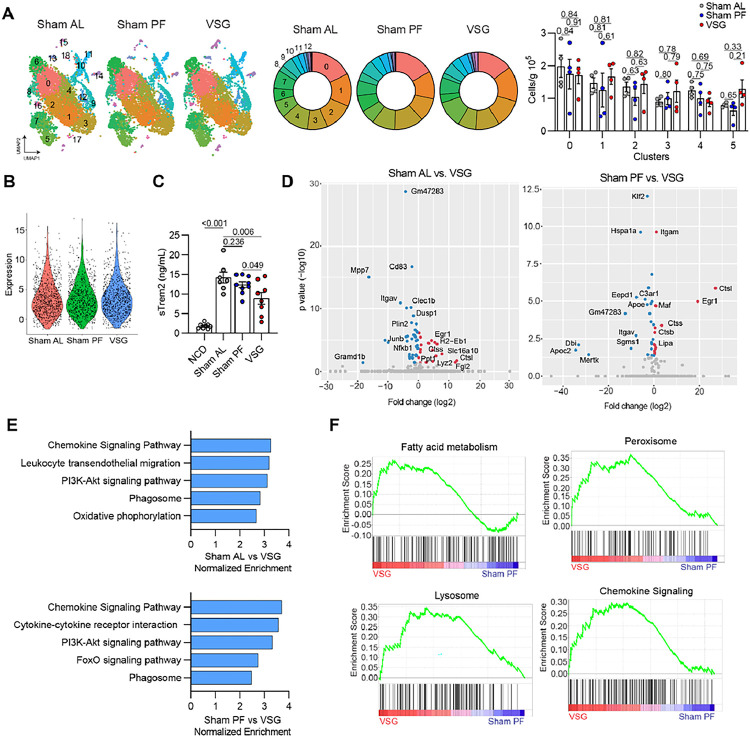
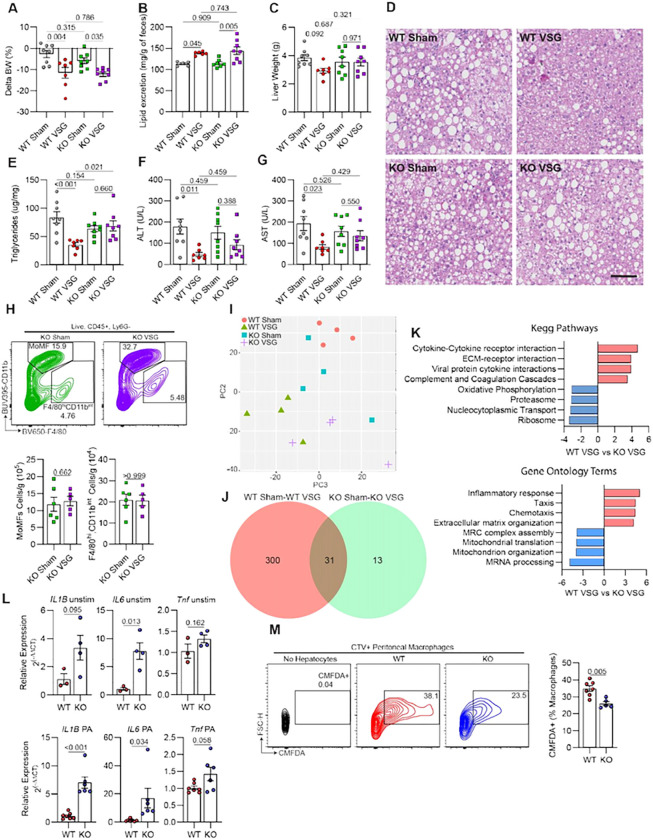
For patients with obesity and metabolic syndrome, bariatric procedures such as vertical sleeve gastrectomy (VSG) have a clear benefit in ameliorating metabolic dysfunction-associated steatohepatitis (MASH). While the effects of bariatric surgeries have been mainly attributed to nutrient restriction and malabsorption, whether immuno-modulatory mechanisms are involved remains unclear. Here we report that VSG ameliorates MASH progression in a weight loss-independent manner. Single-cell RNA sequencing revealed that hepatic lipid-associated macrophages (LAMs) expressing the triggering receptor expressed on myeloid cells 2 (TREM2) increase their lysosomal activity and repress inflammation in response to VSG. Remarkably, TREM2 deficiency in mice ablates the reparative effects of VSG, suggesting that TREM2 is required for MASH resolution. Mechanistically, TREM2 prevents the inflammatory activation of macrophages and is required for their efferocytotic function. Overall, our findings indicate that bariatric surgery improves MASH through a reparative process driven by hepatic LAMs, providing insights into the mechanisms of disease reversal that may result in new therapies and improved surgical interventions.


Conflict of interest statement

Additional Declarations: There is NO Competing Interest.

Figures

Figure 1
Figure 1. Vertical sleeve gastrectomy (VSG) ameliorates MASH progression independent of weight loss.
(A) Experimental design, (B) Mean daily food intake post-surgery, (C) Weekly body weights post-surgery, (D) Liver weight, (E) Hepatic triglyceride content, (F) Representative H&E-stained liver sections, (G) Serum ALT (Left) and AST (Right), (H) Collagen area in Picro Sirius Red-stained liver sections, (I) Fecal lipid content, (J) Relative abundance of Lactobacillus, (K) Relative abundance of microbiota species, (L) Relative abundance of Clostridium XVIII, (M) Total portal vein bile acids, (N) Concentration of portal vein taurocholic acid (TCA), deoxycholic acid (DCA), and taurodeoxycholic acid (TDCA), and (O) Total portal vein short-chain fatty acids (SCFA) in C57BL6/J (WT) mice fed an HFHC diet for 12 weeks before assignment to Sham ad libitum (Sham AL; n = 6–17), Sham pair-fed (Sham PF; n = 6–17), or VSG (n = 6–25) surgeries. Mice were maintained on the HFHC diet for 5 weeks post-surgery. A cohort of mice without any intervention were fed a normal chow diet (NCD; n = 5–25) throughout the study. Data are biological experimental units presented as mean ± standard error of the mean (SEM). Except for the microbiota data, which were analyzed by a non-parametric Kruskal-Wallis test, data were analyzed by one-way ANOVA with Holm-Šídák multiple comparison test.
Figure 2
Figure 2. ScRNA-seq reveals profound effects of VSG on hepatic LAMs.
(A) Experimental design, (B) Proportion (left) and number (right) of sequenced cells per sample, (C) Integrated uniform manifold approximation and projection (UMAP) analysis of all monocytes and macrophages and expression of marker genes, (D) Heat and dot plot of the expression and coverage of marker genes in all subsets, (E) Pathway analysis of upregulated differentially expressed genes (DEG) in LAMs, compared with all other subsets (Gene ontology terms, p-value < 0.1), and (F) Slingshot trajectory analysis (top left) and gene expression over pseudotime for trajectories 1 (top right), 2 (bottom left), and 3 (bottom right) from single-cell RNA sequencing (scRNA-seq) of hepatic macrophages and monocytes from Sham AL (n = 8), Sham PF (n = 8), and VSG (n = 8) mice 5–10 weeks post-surgeries. Differential expression testing was performed by a Wilcoxon rank-sum test.
Figure 3
Figure 3. VSG enhances lipid metabolism and lysosomal gene programs in hepatic LAMs.
(A) UMAPs (left), relative cluster proportion (middle), and number of cells per cluster (right) and (B) Expression of Trem2 in cluster 1 (LAMs) from the scRNA-seq analysis of monocytes and macrophages from Sham AL, Sham PF, or VSG groups. (C) Concentration of soluble TREM2 (sTREM2) in the serum of NCD (n = 8), Sham AL (n = 7), Sham PF (n = 9), and VSG (n = 8) mice 5 weeks post-surgeries. (D) Volcano plots showing differentially expressed genes (DEGs) between Sham AL and VSG (left), and Sham PF and VSG (right) LAMs, (E) Pathway analysis of DEGs in LAMs from Sham AL vs. VSG (top) and Sham PF vs. VSG (bottom) comparisons, and (F) Gene seat enrichment analysis (GSEA) of the DEGs between Sham PF and VSG LAMs in the scRNA-seq data. The cell number and sTREM2 concentration data were analyzed by one-way ANOVA with Holm-Šídák multiple comparison test. Differential expression testing was performed by a Wilcoxon rank-sum test. Pathway analysis was performed by Generally Applicable Gene-set Enrichment Analysis (GAGE, p-value < 0.1). Data are biological experimental units presented as mean ± SEM.
Figure 4
Figure 4. Hepatic TREM2+ LAMs mediate the reparative effects of VSG against MASH.
(A) Body weight change post-surgery, (B) Fecal lipid content, (C) Liver weight, (D) Representative H&E-stained liver sections, (E) Hepatic triglyceride content, (F) Serum ALT and (G) AST, (H) Representative flow plot (top) and quantification of monocyte-derived (MoMFs) and F4/80hi CD11bint macrophages, (I) Unsupervised PCA of bulk RNA-seq gene expression data from F4/80+ sorted macrophages. (J) Venn diagram with the number of differentially expressed genes (DEGs) between Sham and VSG in WT and TREM2 KO macrophages, and (K) Pathway analysis (KEGG and Gene ontology) of DEGs between WT and TREM2 KO macrophages from sham or VSG mice. C57BL6/J (WT) and TREM2 KO (KO) mice were fed an HFHC diet for 12 weeks, assigned to either sham or VSG surgeries, and analyzed 5 weeks post-surgery (WT Sham, n = 5–8; WT VSG, n = 6–7; KO Sham, n = 5–8; and KO VSG, n = 5–8). (L) Gene expression of inflammatory cytokines in bone marrow-derived macrophages from WT (n = 3–7) or TREM2 KO (n = 4–6) mice left unstimulated (unstim, top) or stimulated with palmitate (PA, bottom). (M) Representative flow plots (left) and quantification (right) of CellTracker Green (CMFDA)-positive macrophages following coculture of peritoneal macrophages from WT (n = 7) and TREM2 KO (n = 5) mice with CMFDA-labeled apoptotic AML12 hepatocytes. Data from four experimental groups were analyzed by one-way ANOVA with Holm-Šídák multiple comparison test. Pathway analysis was performed by GAGE (p-value < 0.05). Data from two experimental groups were analyzed by Mann Whitney tests. Data are biological experimental units presented as mean ± SEM.
Figure 5
Figure 5. VSG increases the content of inflammatory lipid species in hepatic macrophages.
(A) Composition of detectable metabolites in macrophages, (B) Unsupervised PCA of metabolite data, (C) Concentration of triacylglycerols (TG), (D) Chain length enrichment analysis of lipid species. The box represents the interquartile range, the middle line is the median, and the top and bottom lines indicate quartile 3 and quartile 1, respectively. Dots indicate outliers and red boxes indicate chain lengths with statistical significance between Sham AL and VSG, (E) Concentration of major lipid species including phosphatidylcholines (PC), cholesterol esters (CE), fatty acids (FA), glycosylceramides (HexCer), ceramides (Cer), sphingolipids (SM), and diacylglycerols (DG), (F) PC subspecies such as PCs (aa), PCs (ae), monounsaturated fatty acid (MUFA) PCs, polyunsaturated fatty acid (PUFA) PCs, and saturated fatty acid (SFA) PCs, (G) SM subspecies including long chain fatty acid (LCFA) SMs, very long chain fatty acid (VLCFA) SMs, and SMs with or without hydroxyl (-OH) groups, (H) Cer subspecies including VLCFA-Cer and LCFA-Cer, (I) FA subspecies including MUFAs, PUFAs, and omega-3 (w-3) FAs, and (J) CE subspecies determined by mass spectrometry and liquid chromatography of hepatic macrophages isolated from the livers of HFHC-fed mice assigned to Sham AL (n = 4) or VSG (n = 4) 5 weeks post-surgery. Data were analyzed by Welch’s two-sided t tests. Data are biological experimental units presented as mean ± SEM.
Figure 6
Figure 6. Spatial transcriptomic of MASH livers following bariatric surgery reveals an improved metabolic status in the macrophage microenvironment.
(A) Representative immunofluorescence images showing an entire section (left) and a magnified field (right) with CD68 (orange) and CD68+ regions of interest (ROIs, green) in liver specimens analyzed by spatial transcriptomics (Geomx). (B) Steps in data processing (top) and number of genes after processing (bottom), (C) Unsupervised PCA of gene expression data from CD68+ and CD68 ROIs, Volcano plots showing differentially expressed genes between (D) NCD and Sham AL, (E) Sham AL and VSG, (F) Sham PF and VSG CD68 ROIs. Pathway analysis between (G) NCD and Sham AL, (H) Sham AL and VSG (I) Sham PF and VSG CD68 ROIs. Liver specimens were collected from C57BL6/J (WT) fed either a NCD or an HFHC diet for 12 weeks, assigned to Sham AL, Sham PF, or VSG surgeries, and analyzed 5 weeks post-surgery (n = 4). Data were analyzed utilizing a Mann-Whitney test and corrected with a Benjamini-Hochberg procedure. Pathway analysis was performed by GSEA (p-value < 0.05).

References

    1. Younossi Z. et al. Global burden of NAFLD and NASH: trends, predictions, risk factors and prevention. Nature reviews. Gastroenterology & hepatology 15,11–20 (2018). - PubMed
    1. Marengo A., Jouness R.I. & Bugianesi E. Progression and Natural History of Nonalcoholic Fatty Liver Disease in Adults. Clinics in liver disease 20,313–324 (2016). - PubMed
    1. Tilg H. & Moschen A.R. Evolution of inflammation in nonalcoholic fatty liver disease: the multiple parallel hits hypothesis. Hepatology (Baltimore, Md.) 52,1836–1846 (2010). - PubMed
    1. Schuster S., Cabrera D., Arrese M. & Feldstein A.E. Triggering and resolution of inflammation in NASH. Nat Rev Gastroenterol Hepatol 15,349–364 (2018). - PubMed
    1. Yanovski S.Z. & Yanovski J.A. Obesity. The New England journal of medicine 346,591–602 (2002). - PubMed

Publication types

LinkOut - more resources