[Preprint]. 2023 Oct 23:2023.10.22.563476.
doi: 10.1101/2023.10.22.563476.

The biological role of local and global fMRI BOLD signal variability in human brain organization

Affiliations

The biological role of local and global fMRI BOLD signal variability in human brain organization

Giulia Baracchini et al. bioRxiv. .

Abstract

Variability drives the organization and behavior of complex systems, including the human brain. Understanding the variability of brain signals is thus necessary to broaden our window into brain function and behavior. Few empirical investigations of macroscale brain signal variability have yet been undertaken, given the difficulty in separating biological sources of variance from artefactual noise. Here, we characterize the temporal variability of the most predominant macroscale brain signal, the fMRI BOLD signal, and systematically investigate its statistical, topographical and neurobiological properties. We contrast fMRI acquisition protocols, and integrate across histology, microstructure, transcriptomics, neurotransmitter receptor and metabolic data, fMRI static connectivity, and empirical and simulated magnetoencephalography data. We show that BOLD signal variability represents a spatially heterogeneous, central property of multi-scale multi-modal brain organization, distinct from noise. Our work establishes the biological relevance of BOLD signal variability and provides a lens on brain stochasticity across spatial and temporal scales.


Figures

Figure 1.
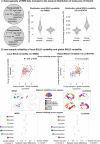
Figure 1.. Local and global BOLD signal variability
| (A) Local BOLD variability was quantified via the root Mean Squared Successive Difference (rMSSD) on each normalized regional timeseries. | (B) Global BOLD variability was quantified as dynamic functional connectivity obtained on windowed regional timeseries via covSTATIS. | (C) On the left, we tested covSTATIS test-retest reliability on a sample of 145 healthy young adults who underwent two successive 10-min runs of multi-echo resting-state fMRI. On the right, we used Partial Least Squares to test whether covSTATIS-derived global variability was reduced as a function of age, in two healthy adult lifespan samples. Decreased global BOLD variability is reported in the aging literature using traditional methods. Note: all analyses and visualizations in this paper reduce the number of functional networks from 17 to 7, despite data being parcellated with the Schaefer 200–17 solution. To maintain spatial granularity while easing interpretation, we merged together regions from different subnetworks into their principal network (e.g., Visual Central and Visual Peripheral into Visual).
Figure 2.
Figure 2.. Distribution of local and global BOLD signal variability and their reliability across two different fMRI data types.
| (A) On the left: description of the two fMRI samples used in this study. On the right: regional distribution of group-level local and global BOLD variability (arbitrary units). | (B) Top: Inter-sample reliability of local (left) and global (right) BOLD variability across brain regions, estimated on group-level measures. Middle: Regional reliability of local (left) and global (right) BOLD variability across samples. Independent t-tests were computed for each brain region (200 tests per metric) to assess mean regional differences in local (left) and global BOLD variability (right) across fMRI data types. Colored regions show reliable effects (p>.05). Bottom: Network reliability of local (left) and global (right) BOLD variability across samples. Networks crossing 0 show reliable effects (p>.05).
Figure 3.
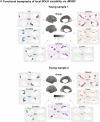
Figure 3.. Topographical characterization of local and global BOLD signal variability per fMRI data type.
| (A) Regional topography of local BOLD variability. Group-level spatial maps were obtained averaging BOLD variability maps across individuals within each fMRI sample. Central, grey-scale maps are the group averages. To ease interpretation, we show around the central maps, the 7 canonical network-level group maps. To appreciate between-network differences in BOLD variability, we let scaling values differ between networks. Note that rMSSD values were z-scored, for easier comparison across datasets as units are arbitrary. | (B) Regional topography of global BOLD variability. Similarly to local BOLD variability, we show group-level spatial maps of dynamic functional connectivity both for the whole brain and the canonical 7 networks (z-scored values). | (C) Multiscale gradients of local and global BOLD variability. We correlated our group local global BOLD variability maps with open-source ex_vivo cytoarchitectural, in_vivo microstructural, transcriptional and static functional connectivity maps, for each fMRI sample separately. Significance was assessed via permuting 10,000 times the regional labels of our local and global variability spatial maps (Hungarian spins). The table shows resulting correlation values split by metric and sample. Colored boxes indicate significant correlations (p10k spin<0.05).
Figure 4.
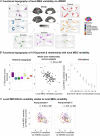
Figure 4.. Multiscale neurobiological correlates of local and global BOLD signal variability.
| (A) Top left: Euler diagram representing our hypothesis of the central role of local and global BOLD variability in multiscale brain organization. Each circle represents a spatial scale and includes all variables used in our analyses. Middle left: Correlation matrices for each fMRI sample (upper triangle: Young Sample 1; lower triangle: Young Sample 2). Asterisks indicate correlations that survived significance testing (10,000 Hungarian spins of Schaefer’s regional labels). Right: Spring embedding plots represent correlations with an absolute value above 0.3, for each fMRI sample. Note that link length reflects correlation magnitude. Bottom: Rank order correlations between the multiscale correlates of local and global BOLD variability across fMRI samples. Multiscale correlates were first Fisher-z transformed before being related across fMRI samples. | (B) Dominance analysis results per metric and fMRI sample. Results indicate the unique contribution of each neurobiological variable in predicting local and global BOLD variability, and recapitulate our correlational results.
Figure 5.
Figure 5.. Contextualizing local brain variability across neuroimaging modalities.
| Local electrophysiological variability was estimated as MEG signal variability via rMSSD, and as the 1/f exponent in the MEG power spectrum. (A) Functional topography of local rMSSD-derived MEG variability. Central, grey-scale map represents the group average map. Around it are the 7 canonical network-level group maps. Note that rMSSD values were z-scored, as units are arbitrary. | (B) Left: Functional topography of the 1/f exponent per network, across individuals. Middle: whole-brain relationship between local rMSSD-derived MEG variability and 1/f exponent across individuals. Right: We simulated naturalistic electrophysiological timeseries and varied the steepness of their 1/f exponent at various parameters from −1.5 to −0.7, shown as positive values in the graph, in steps of −0.1. 10 simulations were run per parameter. We calculated local rMSSD-derived MEG variability on each simulated timeseries, and related exponent values with rMSSD scores. | (C) Cross-modal relationships between local fMRI and MEG brain variability, per fMRI sample.

References

    1. Lewontin R. C. The Units of Selection. Ann Rev Ecol Syst, 1(1), 1–18 (1970).
    1. Barsugli J. J. & Battisti D. S. The Basic Effects of Atmosphere–Ocean Thermal Coupling on Midlatitude Variability*. J. Atmos. Sci. 55, 477–493 (1998).
    1. Schwarzwald K. & Lenssen N. The importance of internal climate variability in climate impact projections. Proc. Natl. Acad. Sci. U.S.A. 119, e2208095119 (2022). - PMC - PubMed
    1. Rajendra Acharya U., Paul Joseph K., Kannathal N., Lim C. M. & Suri J. S. Heart rate variability: a review. Med Bio Eng Comput 44, 1031–1051 (2006). - PubMed
    1. Meena C. et al. Emergent stability in complex network dynamics. Nat. Phys. (2023) doi:10.1038/s41567-023-02020-8. - DOI

Publication types