[Preprint]. 2024 Jun 17:2023.10.31.560822.
doi: 10.1101/2023.10.31.560822.

Critical role of CD206+ macrophages in promoting a cDC1-NK-CD8 T cell anti-tumor immune axis

Affiliations

Critical role of CD206+ macrophages in promoting a cDC1-NK-CD8 T cell anti-tumor immune axis

Arja Ray et al. bioRxiv. .

Update in

Abstract

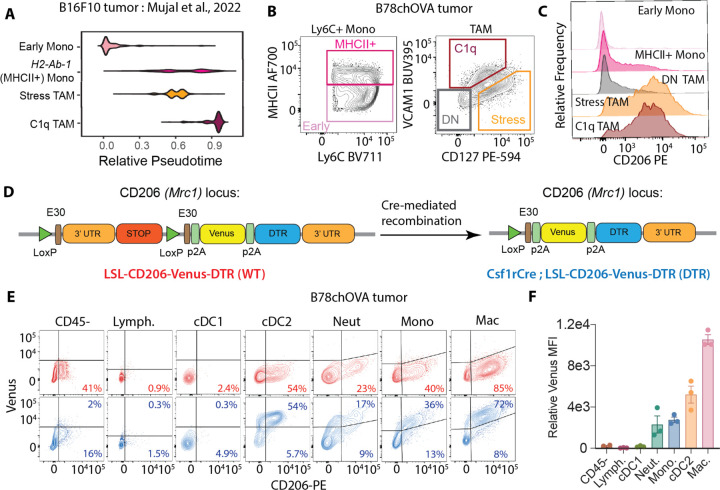
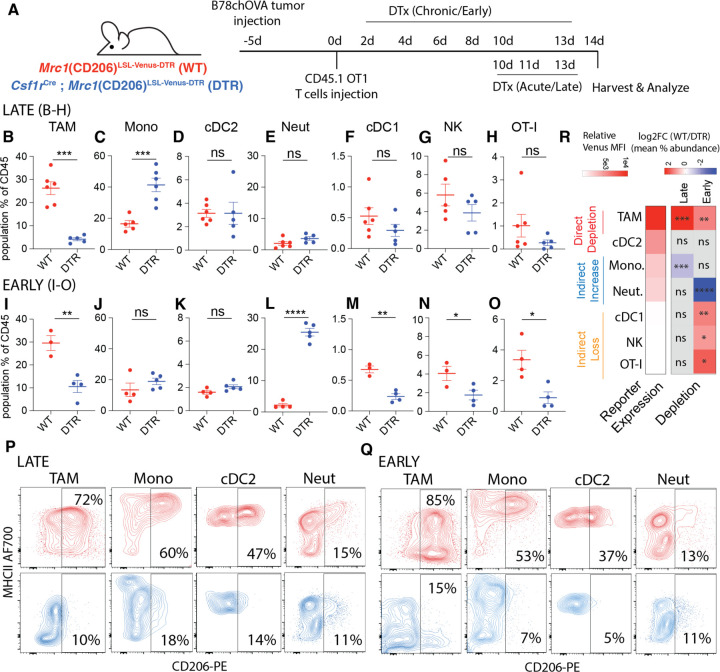
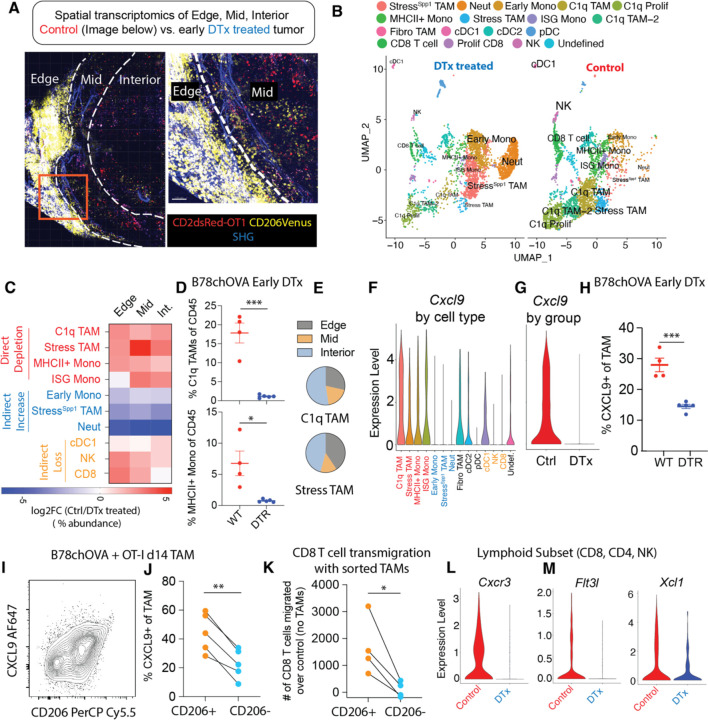
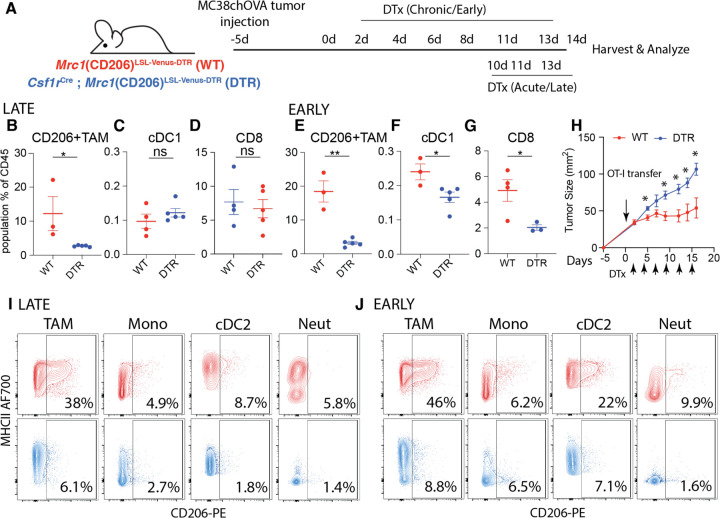
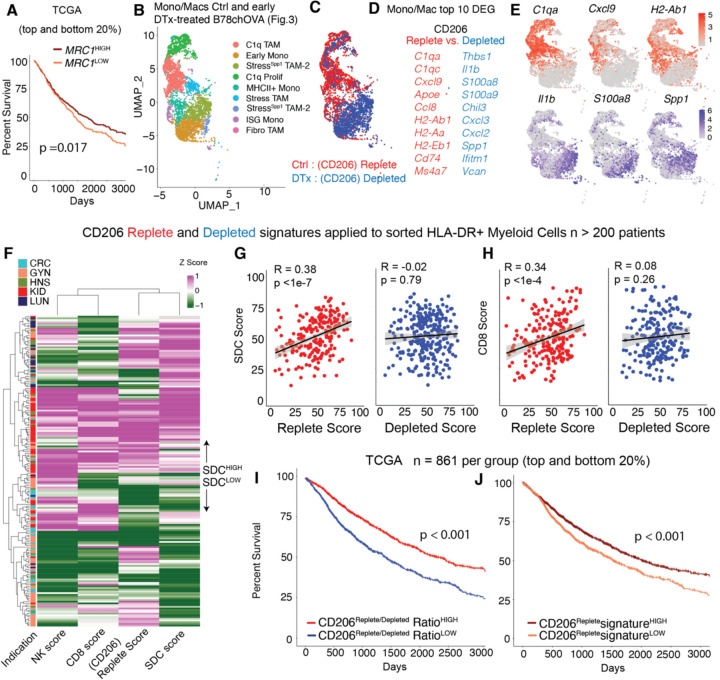
Tumor-associated macrophages (TAMs) are frequently categorized as being 'M1' or 'M2' polarized, even as substantial data challenges this binary modeling of macrophage cell state. One molecule consistently referenced as a delineator of a putative immunosuppressive 'M2' state is the surface protein CD206. We thus made a novel conditional CD206 (Mrc1) knock-in mouse to specifically visualize and/or deplete CD206+ 'M2-like' TAMs and assess their correspondence with pro-tumoral immunity. Early, but not late depletion of CD206+ macrophages and monocytes (here, 'Mono/Macs') led to an indirect loss of a key anti-tumor network of NK cells, conventional type I dendritic cells (cDC1) and CD8 T cells. Among myeloid cells, we found that the CD206+ TAMs are the primary producers of CXCL9, and able to differentially attract activated CD8 T cells. In contrast, a population of stress-responsive TAMs ("Hypoxic" or Spp1+) and immature monocytes, which lack CD206 expression and become prominent following early depletion, expressed markedly diminished levels of CXCL9. Those NK and CD8 T cells which enter CD206-depleted tumors express vastly reduced levels of the corresponding receptor Cxcr3, the cDC1-attracting chemokine Xcl1 and cDC1 growth factor Flt3l transcripts. Consistent with the loss of this critical network, early CD206+ TAM depletion decreased tumor control by antigen specific CD8 T cells in mice. Likewise, in humans, the CD206Replete, but not the CD206Depleted Mono/Mac gene signature correlated robustly with CD8 T cell, NK cell and stimulatory cDC1 gene signatures and transcriptomic signatures skewed towards CD206Replete Mono/Macs associated with better survival. Together, these findings negate the unqualified classification of CD206+ 'M2-like' macrophages as immunosuppressive by illuminating contexts for their role in organizing a critical tumor-reactive archetype of immunity.


Conflict of interest statement

Declaration of Interests: The authors declare no competing interests

Figures

Fig. 1:
Fig. 1:. Genetic Myeloid-specific Labeling of CD206+ Macrophages in Tumors:
(A) Pseudotime plots of select Mono/Mac subsets in B16F10 tumors from Mujal et al(3); (B) Gating on the equivalent subsets in B78chOVA tumors by flow cytometry and (C) CD206 expression in each of these subsets; (D) Schematic representation of the Mrc1LSL-Venus-DTR knock-in construct before (WT) and after (DTR) Cre-mediated recombination by crossing to the Csf1rCre allele; (E) Flow cytometry plots showing reporter (Venus) and CD206 expression in different immune cells in d18 B78chOVA tumors in WT (red) and DTR (blue) mice with (F) quantification of relative reporter expression (DTR – WT) in the different subsets. data are mean +/− SEM, from 3 biological replicates, WT levels averaged from 2 biological replicates.
Fig. 2:
Fig. 2:. Early CD206+ TAM depletion leads to a coordinated and indirect loss of NK, cDC1 and CD8 T cells in the TME:
(A) Schematic representation of the experimental setup for early and late CD206+ TAM depletion in B78chOVA tumors using Mrc1(CD206)LSL-Venus-DTR (WT) and Csf1rCre; CD206LSL-Venus-DTR (DTR) mice; Relative abundance of different immune populations as a percentage of CD45+ cells with (B-H) late and (I-O) early depletion regimens; Representative flow cytometry plots showing CD206 vs. MHCII expression in different myeloid subsets in WT (red) and DTR (blue) mice in the (P) late and (Q) early depletion regimens. (R) heatmap representation of the log fold change of the ratio of mean abundances in WT and DTR mice (data from B-O), alongside the extent of reporter expression (mean relative Venus MFI from Fig. 1F) to indicate direct depletion and indirect loss or enrichment. (statistical significance is indicated on the respective squares; ***p <0.001, **p<0.01, *p <0.05, ns = no significance by Student’s t-tests).
Fig. 3:
Fig. 3:. Loss of CXCL9-positive TAMs and CXCR3-expressing, cDC1 supportive lymphocytes with CD206+ TAM depletion
(A) Two-photon imaging of representative (control) B78chOVA tumors d12 post adoptive transfer of CD2dsRed; OT-I CD8 T cells showing three zones of Venus-expressing macrophage and associated CD8 T cell localization – edge, mid and interior (Int.) mapped by spatial transcriptomic barcoding ZipSeq; Boxed region is magnified (right) to show corresponding edge-mid interface SHG: Second Harmonic Generation; (B) UMAP representation of major immune cell populations obtained from Control and early DTx treated B78chOVA tumors d12 post OT-I injection aggregated across all three regions; (C) Summary heatmap showing relative log fold change of the abundance (calculated as the % of the total number of cells recovered within that region) of each major cluster in Ctrl/DTx treated conditions, split by region of tumor; Cxcl9 expression; (D) Flow cytometry data showing abundance of C1q TAMs and MHCII+ Monocytes in Ctrl and DTx treated conditions; (E) Distribution of C1q and Stress-responsive TAMs in the three spatial regions in control B78chOVA tumors; Cxcl9 expression (F) aggregated across treatment conditions by cluster and (G) aggregated across clusters by condition; (I) Representative flow cytometry plot showing intracellular CXCL9 vs. surface CD206 expression in TAMs in B78chOVA tumors at d14 post OT-I adoptive transfer and (J) the same CXCL9 expression split by CD206 positivity; (K) in vitro activated CD8 T cell migration at 3h through a 5μm transwell insert in the presence of sorted CD206+ vs. CD206- TAMs from B78chOVA tumors, normalized to migration with no TAMs; (L) Cxcr3, (M) Flt3l and Xcl1 expression in the lymphocyte subset (CD8 T cell, NK cell and CD4 T cell) by treatment group. ***p <0.001, **p<0.01, *p <0.05, ns = no significance by Mann-Whitney test (D), unpaired t-test (H) and ratio paired t-test (J, K).
Fig. 4:
Fig. 4:. CD206+ TAM depletion disrupts the cDC1:CD8 module and attenuates T cell-mediated tumor control in an immune-responsive tumor model:
(A) Schematic representation of the experimental setup for early and late CD206+ TAM depletion in MC38chOVA tumors using Csf1rCre; Mrc1LSL-Venus-DTR mice; Relative abundance of (B, E) CD206+ TAMs, (C, F) cDC1s and (D, G) CD8 T cells as a percentage of CD45+ cells with late and early depletion regimens respectively; (H) tumor growth kinetics of MC38chOVA tumors in WT and DTR mice with DTx treatment beginning 2d post OT-I adoptive transfer at Day 0; Representative flow cytometry plots showing CD206 vs. MHCII expression in different myeloid subsets in WT (red) and DTR (blue) mice in the (I) late and (J) early depletion regimens; **p<0.01, *p <0.05, ns = no significance by Mann-Whitney U test t-tests.
Fig. 5:
Fig. 5:. CD206Replete Mono/Mac signature associates with anti-tumor immunity in human cancers:
(A) Kaplan-Meier survival curves of patients in TCGA grouped by the expression of MRC1 gene; (B) UMAP representation of the Mono/Mac subsets and (C) overlay of the CD206 Replete (Ctrl) and Depleted (DTx) groups on the UMAP from spatial scSeq described in Fig. 3; (D) Top 10 genes from Differential Gene Expression (DGE) of Mono/Macs in the Ctrl vs. DTx treated conditions, which were used to generate CD206 Replete and CD206 Depleted Mono/Mac signature scores (F) Heatmap of z-scored CD206Replete, CD8, NK and Stimulatory dendritic cell (SDC) score, calculated from sorted immune compartments, as previously described (23); Scatter plots of the Myeloid-specific CD206 Replete and Depleted score per patient with the (G) stimulatory dendritic cell (SDC) score and (H) CD8 T cell score (Pearson R and p value for the null hypothesis that there is not a correlation are noted); Kaplan-Meier survival curves of patients grouped by the value of the (I) CD206Replete: CD206Depleted signature ratio and (J) CD206Replete signature in TCGA, p values for the log-rank test are noted in (A, I, J).

References

    1. Binnewies M. et al., Understanding the tumor immune microenvironment (TIME) for effective therapy. Nat Med 24, 541–550 (2018). - PMC - PubMed
    1. Goswami S., Anandhan S., Raychaudhuri D., Sharma P., Myeloid cell-targeted therapies for solid tumours. Nat Rev Immunol 23, 106–120 (2023). - PubMed
    1. Mujal A. M. et al., Holistic Characterization of Tumor Monocyte-to-Macrophage Differentiation Integrates Distinct Immune Phenotypes in Kidney Cancer. Cancer immunology research 10, 403–419 (2022). - PMC - PubMed
    1. Cheng S. et al., A pan-cancer single-cell transcriptional atlas of tumor infiltrating myeloid cells. Cell 184, 792–809 e723 (2021). - PubMed
    1. Azizi E. et al., Single-Cell Map of Diverse Immune Phenotypes in the Breast Tumor Microenvironment. Cell 174, 1293–1308 e1236 (2018). - PMC - PubMed

Publication types