[Preprint]. 2024 Aug 15:2023.11.02.565358.
doi: 10.1101/2023.11.02.565358.

Rapid nongenomic estrogen signaling controls alcohol drinking behavior

Affiliations

Rapid nongenomic estrogen signaling controls alcohol drinking behavior

Lia J Zallar et al. bioRxiv. .

Update in

  • Rapid nongenomic estrogen signaling controls alcohol drinking behavior in mice.
    Zallar LJ, Rivera-Irizarry JK, Hamor PU, Pigulevskiy I, Rico Rozo AS, Mehanna H, Liu D, Welday JP, Bender R, Asfouri JJ, Levine OB, Skelly MJ, Hadley CK, Fecteau KM, Nelson S, Miller J, Ghazal P, Bellotti P, Singh A, Hollmer LV, Erikson DW, Geri J, Pleil KE. Zallar LJ, et al. Nat Commun. 2024 Dec 30;15(1):10725. doi: 10.1038/s41467-024-54737-6. Nat Commun. 2024. PMID: 39737915 Free PMC article.

Abstract

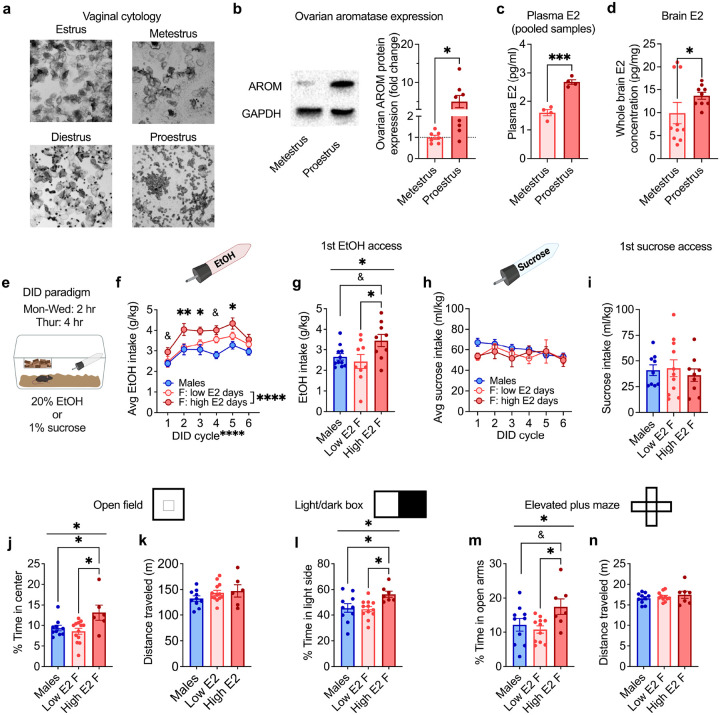
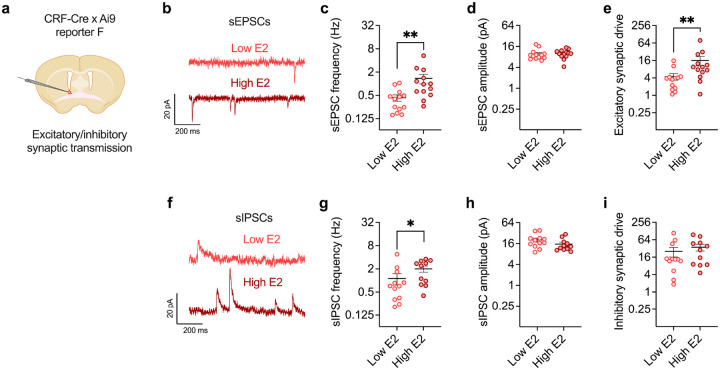
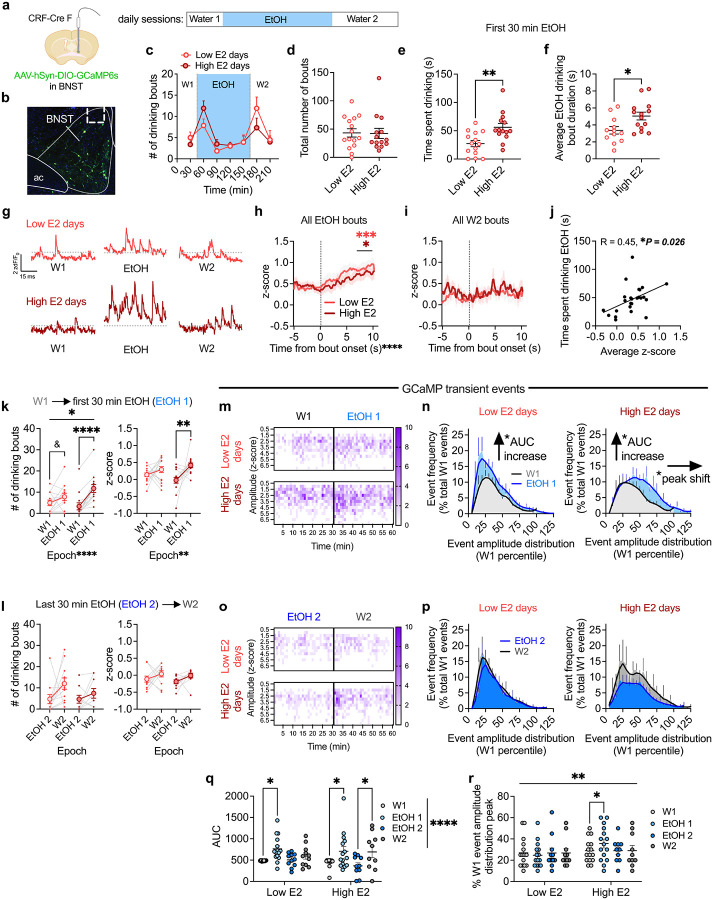
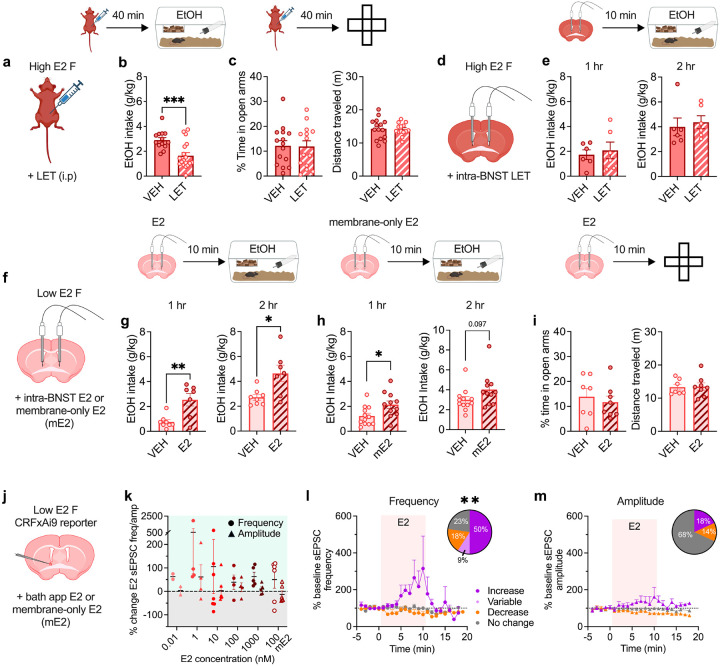
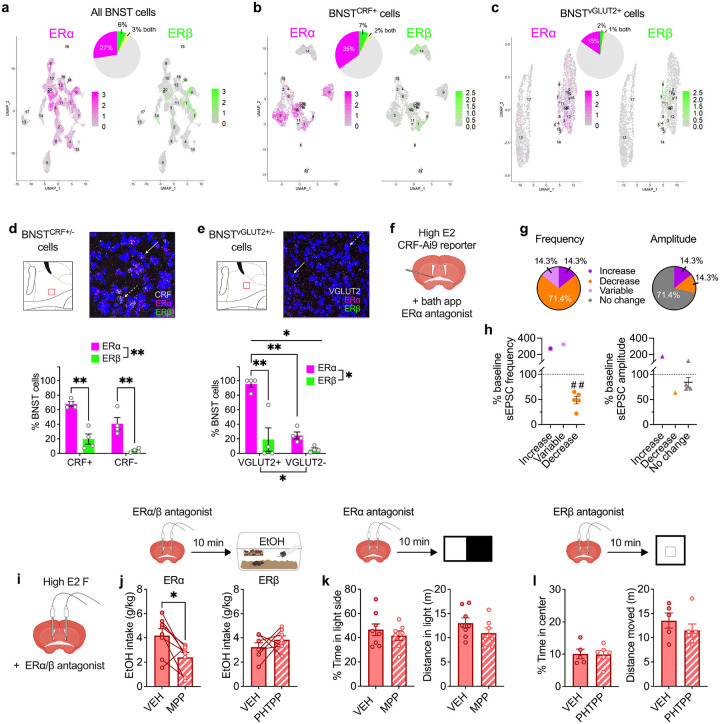
Ovarian-derived estrogen is a key modulator of numerous physiological processes via genomic and nongenomic mechanisms, including signaling non-canonically at membrane-associated estrogen receptors in the brain to rapidly regulate neuronal function. However, the mechanisms mediating estrogen regulation of behaviors such as alcohol consumption remain unclear. Early alcohol drinking confers greater risk for alcohol use disorder in women than men, and binge alcohol drinking is correlated with high circulating estrogen levels, but a causal role for estrogen signaling in driving alcohol drinking in gonadally-intact animals has not been established. We found that female mice displayed greater binge alcohol drinking and reduced avoidance behavior when circulating estrogen was high during the proestrus phase of the estrous cycle than when it was low, contributing to sex differences in these behaviors. The pro-drinking, but not anxiolytic, effect of high endogenous estrogen state occurred via rapid estrogen signaling at membrane-associated estrogen receptor alpha in the bed nucleus of the stria terminalis, which promoted synaptic excitation of corticotropin-releasing factor neurons and facilitated their activity during alcohol drinking behavior. This study is the first to demonstrate a rapid, nongenomic signaling mechanism for ovarian-derived estrogen signaling in the brain controlling behavior in gonadally intact females, and it establishes a causal role for estrogen in an intact hormonal context for driving alcohol consumption that contributes to known sex differences in this behavior.


Conflict of interest statement

Competing interests Authors declare that they have no competing interests.

Figures

Figure 1:
Figure 1:. Binge alcohol drinking and avoidance behavior fluctuate with E2 status across the estrous cycle in gonadally-intact female mice.
a-c) Minimally-invasive method for monitoring E2 status across the estrous cycle in gonadally-intact C57BL/6J mice. a) Representative images of vaginal epithelial cells in each estrous cycle phase in the female mouse. b) Aromatase (AROM) protein expression normalized to glyceraldehyde 3-phosphate dehydrogenase (GAPDH) was higher in the ovaries of female mice categorized by vaginal cytology as being in proestrus compared to mice categorized as being in metestrus. c) Plasma E2 concentrations were higher in proestrus compared to metestrus female mice, where each data point represents a pooled sample from five mice. d) Whole-brain E2 concentrations were higher in proestrus compared to metestrus mice. e) Schematic of the Drinking in the Dark (DID) binge consumption paradigm used in intact mice. f) High E2 status promoted average 2-hour consumption of 20% EtOH across cycles of EtOH DID. Within each DID cycle, individual females’ average consumption on day(s) in proestrus when ovarian E2 was high vs. their days in other estrous cycle phases when ovarian E2 was low is included for each cycle in which mice had proestrus drinking day(s). g) Females given access to EtOH for the first time in a high E2 state (proestrus) displayed greater binge drinking than those given first access in a low E2 state and males. h) Estrous cycle did not modulate average 2-hour consumption of 1% sucrose across DID cycles (represented as in e). i) Females given access to sucrose for the first time in a high E2 state displayed similar consumption as those given first access in a low E2 state and males. j-n) Females in a higher ovarian E2 state displayed reduced avoidance behavior compared to those in a low E2 state and males. j) % Time spent in the center of the open field test (OF) was higher in females in proestrus (high E2) than those in other estrous cycle stages (low E2) and males. k) There was no difference in distance traveled in the OF between high or low E2 status females or males. l) High E2 status female mice spent a greater % time on the light side of the light:dark box (LDB) than low E2 status females and males. m) High E2 status female mice spent a greater % time spent in open arms of the elevated plus maze (EPM) compared to low E2 status females and males. n) There was no difference in distance traveled in the EPM between high or low E2 status females or males. *P < 0.05, **P < 0.01, ***P < 0.001, ****P < 0.0001, &P < 0.10 for unpaired t-tests, mixed effects analysis main effects, one way ANOVA main effects of group, and post hoc t-tests paired t-tests with H-S corrections between high and low E2 days in f and post hoc unpaired t-tests with H-S corrections for other panels, as indicated. Detailed statistics are provided in Supplemental Table 1. Illustrations were created with biorender.com.
Fig. 2:
Fig. 2:. BNSTCRF neurons are sensitive to ovarian estrogen status.
a-i) Spontaneous synaptic transmission in BNSTCRF neurons as measured in slice electrophysiology recordings from intact CRF-CrexAi9 reporter females in low vs. high ovarian E2 states, with schematic in a. b) Representative traces of spontaneous excitatory postsynaptic currents (sEPSCs). c) The frequency of sEPSCs was higher in BNSTCRF neurons from high ovarian E2 females than those from low E2 females. d) sEPSC amplitude was unaffected by ovarian E2 status. e) The excitatory synaptic drive onto BNSTCRF neurons (frequency x amplitude) was greater in high vs. low ovarian E2 females. f) Representative traces of spontaneous inhibitory postsynaptic currents (sIPSCs). g-i) sIPSC frequency in BNSTCRF neurons was greater in high vs. low ovarian E2 status females (g), but amplitude (h) and synaptic drive (i) did not differ. *P < 0.05, **P < 0.01; unpaired t-tests between treatment groups and low E2 vs. high E2 groups. Detailed statistics are provided in Supplemental Table 1. Illustrations were created with biorender.com.
Fig. 3:
Fig. 3:. Ovarian E2 state modulates the activity of BNSTCRF neurons during motivated alcohol drinking.
Fiber photometry recordings of GCamP6s in BNSTCRF neurons during behavior, with schematic of unilateral viral injection and optical fiber cannula placement in a and representative image of GCaMP expression and fiber placement in b. c) Top: fiber photometry daily modified EtOH DID session timeline in which water access was given before (W1) and after (W2) the 2-hour EtOH access period. Bottom: time course showing drinking bouts across the water and EtOH epochs. d) The total number of drinking bouts across the entire session did not differ between high and low ovarian E2 status drinking days. e-f) Total time spent displaying motivated EtOH drinking (time in bout; e) and average EtOH drinking bout duration (f) were greater during the first 30 minutes of EtOH access on high E2 status drinking days than on low E2 status drinking days. g) Representative traces of GCaMP fiber photometry signal from one mouse on a low E2 drinking day (top) and high E2 drinking day (bottom), with signal z-scored to the entire drinking session for each day. h-i) GCaMP signal increased during both high and low E2 status drinking days across 10 s following bout onset for EtOH (h) but not water (i). j) There was a positive correlation between GCaMP signal and the time spent in motivated drinking during the first 30 minutes of EtOH access. k) The number of drinking bouts (left) and average GCaMP signal (right) increased during the first 30 minutes of EtOH access (EtOH 1) compared to W1 particularly during high E2 status drinking days. l) There was no change in bout number (left) or normalized GCaMP signal (right) in the first 30 minutes of W2 compared to the last 30 minutes of EtOH consumption (EtOH 2) on high E2 or low E2 status drinking days. m) Representative heat map of the frequency of GCaMP transient events across amplitude bins for a single mouse across W1 and EtOH 1 epochs on low (top) vs. high (bottom) E2 days. n) Frequency distribution of transient event amplitudes normalized to the amplitude distribution for W1 within each day during W1 and EtOH 1 epochs, showing that event number increased with the same amplitude distribution for low E2 drinking days (left) and with an increased amplitude distribution for high E2 drinking days (right). o) Representative heat map of the frequency of GCaMP transient events across amplitude bins across EtOH 2 and W2 epochs for the same mouse as in l. p) Frequency distribution of transient event amplitudes normalized to the amplitude distribution for W1 (left: low E2 days, right: high E2 days) during EtOH 2 and W2 epochs. q) Area under the curve (AUC) of GCaMP event distributions shown in n and p increased across W1→EtOH 1 epochs on both low E2 and high E2 drinking days and across EtOH 2→W2 epochs on high E2 drinking days. r) The peak of the event amplitude distributions shown in n and p was shifted rightward specifically during the EtOH 1 epoch on high E2 drinking days. *P < 0.05, **P < 0.01, ***P < 0.001, ****P < 0.0001, &P < 0.10 for unpaired t-tests, 2xANOVA main effects and interactions and their post hoc paired t-tests with H-S corrections, and Pearson’s correlation as indicated. Detailed statistics are provided in Supplemental Table 1. Illustrations were created with biorender.com.
Figure 4:
Figure 4:. Rapid E2 signaling in the BNST recapitulates the pro-drinking but not anxiolytic effects of ovarian E2 and modulates BNSTCRF neurons.
a-c) Effects of acute systemic E2 synthesis inhibition on behavior in high ovarian E2 status mice using systemic administration of the aromatase activity inhibitor letrozole (LET, 10 mg/kg, i.p.), as depicted in a. b) Acute LET administration 40 minutes prior to EtOH access suppressed binge EtOH consumption in high E2 status females. c) Acute LET administration in high E2 status females 40 minutes prior to the elevated plus maze (EPM) did not alter the % time spent in the open arms (left) or distance traveled (right). d-e) Effects of acute intra-BNST infusion of LET (1 μg in 200 nl/side) or saline vehicle controls (VEH) in high E2 status females on behavior, as depicted in d. e) Intra-BNST LET delivered 10 minutes prior to EtOH access did not alter binge EtOH consumption in high E2 status females at the 1-hour and 2-hour time points. f-i) Effects of acute intra-BNST infusion of E2 (20 pg in 200 nl/side) or BSA-conjugated, membrane-impermeable E2 (mE2, 55 pg in 200 nl/side) or saline vehicle controls (VEH) in low E2 status females on behavior, as depicted in f. g) Intra-BNST E2 delivered 10 minutes prior to EtOH access promoted binge EtOH consumption in low E2 status females at the 1-hour and 2-hour time points. h) Intra-BNST mE2, which cannot cross the cell membrane, delivered 10 minutes prior to EtOH access increased binge EtOH drinking in low E2 status females at the 1-hour timepoint with a trend at the 2-hour timepoint. i) Intra-BNST E2 delivered 10 minutes prior to testing on the EPM had no effect on % time spent in the open arms (left) or distance traveled (right). j-m) Effects of acute bath application of E2 and mE2 on excitatory synaptic transmission in BNSTCRF neurons during whole-cell slice electrophysiology recordings in low ovarian E2 status female CRF-CrexAi9 reporter mice, as depicted in j. k) Spontaneous excitatory postsynaptic currents (sEPSCs) maximum delta from % baseline during E2 (0.01–1000 nM) and mE2 (100 nM) wash on. l) Time course of BNSTCRF neurons that displayed an increase, decrease, or no change in sEPSC frequency % change from baseline during the 10-minute application period and proportion of responding BNSTCRF neuron categories during E2 wash on (pie chart), showing a majority of low E2 status BNSTCRF neurons (50%) displayed increased frequency during E2 wash on. m) Time course of BNSTCRF neurons that displayed an increase, decrease, or no change in sEPSC amplitude % change from baseline during the 10-minute application period and responding BNSTCRF neuron categories during E2 wash on (pie chart), showing that the amplitude was unchanged in a majority of BNSTCRF neurons (68%). *P < 0.05, **P < 0.01, ***P < 0.001, unpaired t-tests between VEH vs. LET treatment and VEH vs E2/mE2 treatment; Fisher’s exact test frequency vs amplitude; post hoc t-tests with H-S corrections as indicated. &P < 0.10 for t-tests. Detailed statistics are provided in Supplemental Table 1. Illustrations were created with biorender.com.
Figure 5:
Figure 5:. ERα is robustly expressed in the BNST and mediates rapid E2 modulation of binge drinking but not avoidance behavior.
a-c) Analysis of single nucleus RNA sequencing (snRNA-seq) of female mouse BNST nuclei (total cells: 38,806; GEO: GSE126836). a) BNST cells expressing estrogen receptor α (ERα; Esr1, 27%) and estrogen receptor β (ERβ; Esr2; 6%) and both (3%). b) Crh-expressing BNST cells (BNSTCRF) expressing ERα (35%), ERβ (7%), and both (2%). c) Slc17a6-expressing BNST cells (BNSTVGLUT2) expressing ERα (15%), ERβ (2%), and both (1%). d-e) RNAscope fluorescence in situ hybridization (FISH) probing for ERα (Esr1), ERβ (Esr2), CRF (Crh), and VGLUT2 (Slc17a6) in the BNST in females, with red boxes within schematics (top left) indicating the location of confocal z-stack images taken and representative images pseudocolored for visibility (top right). d) ERα was expressed in more CRF+ cells than ERβ, with overall higher ERα expression in BNST CRF+ compared to CRF- cells. Solid arrow: cell expressing CRF/ERα/ERβ; dashed arrow: cell expressing CRF/ERα. e) ERα was expressed in more VGLUT2+ cells than ERβ, with overall higher ERα expression in BNST VGLUT2+ compared to CRF- cells, showing a similar pattern to snRNA-seq expression. Solid arrow: cell expressing VGLUT2/ERα/ERβ; dashed arrow: cell expressing VGLUT2/ERα. f-h) Effects of acute bath application of the ERα antagonist methyl-piperidino-pyrazole (MPP) on excitatory synaptic transmission in BNSTCRF neurons during whole-cell slice electrophysiology recordings in high ovarian E2 female CRF-CrexAi9 reporter mice, as depicted in f. Bath application of MPP (3 μM) reduced spontaneous excitatory postsynaptic current (sEPSC) frequency in a majority of cells during the 5 minute wash on period (g), while it had no effect on sEPSC amplitude (h). i-l) Effects of acute intra-BNST ERα or ERβ antagonism on behavior in high ovarian E2 status females. i) Depiction of strategy to site-deliver MPP (10 μM/200 nl/side), the ERβ antagonist 4-[2-phenyl-5,7-bis(trifluoromethyl)pyrazolo[1,5-a]pyrimidin-3-yl]phenol (PHTPP; 10 μM/200 nl/side), or saline vehicle (VEH) to the BNST in high E2 females via bilateral indwelling cannulae 10 minutes prior to behavioral testing. j) ERα antagonism via intra-BNST MPP reduced binge EtOH drinking in high ovarian E2 status females (left), with no effect of ERβ antagonism with PHTPP (right). k) ERα antagonism via intra-BNST MPP had no effect on avoidance behavior in the light:dark box (LDB). l) ERβ antagonism via intra-BNST PHTPP had no effect on avoidance behavior in the open field (OF). *P < 0.05, **P < 0.01, ***P < 0.001; 2xANOVA main effects and interactions between receptors; paired t-tests between VEH vs. ER antagonist treatment prior to DID; unpaired t-tests between VEH vs. ER antagonist treatment prior to avoidance assays; post hoc t-tests with H-S corrections as indicated. ## < 0.01; one sample t-test. Detailed statistics are provided in Supplemental Table 1. Illustrations were created with biorender.com.

References

    1. Galea L. A. M., Frick K. M., Hampson E., Sohrabji F. & Choleris E. Why estrogens matter for behavior and brain health. Neurosci Biobehav Rev 76, 363–379 (2017). 10.1016/j.neubiorev.2016.03.024 - DOI - PMC - PubMed
    1. Simpson E. R. Sources of estrogen and their importance. J Steroid Biochem Mol Biol 86, 225–230 (2003). 10.1016/s0960-0760(03)00360-1 - DOI - PubMed
    1. Findlay J. K., Liew S. H., Simpson E. R. & Korach K. S. Estrogen signaling in the regulation of female reproductive functions. Handb Exp Pharmacol, 29–35 (2010). 10.1007/978-3-642-02062-9_2 - DOI - PMC - PubMed
    1. Taxier L. R., Gross K. S. & Frick K. M. Oestradiol as a neuromodulator of learning and memory. Nat Rev Neurosci 21, 535–550 (2020). 10.1038/s41583-020-0362-7 - DOI - PMC - PubMed
    1. Frick K. M. & Kim J. Mechanisms underlying the rapid effects of estradiol and progesterone on hippocampal memory consolidation in female rodents. Horm Behav 104, 100–110 (2018). 10.1016/j.yhbeh.2018.04.013 - DOI - PMC - PubMed

Publication types