[Preprint]. 2024 May 28:2023.10.25.563899.
doi: 10.1101/2023.10.25.563899.

Spindle architecture constrains karyotype in budding yeast

Affiliations

Spindle architecture constrains karyotype in budding yeast

Jana Helsen et al. bioRxiv. .

Update in

Abstract

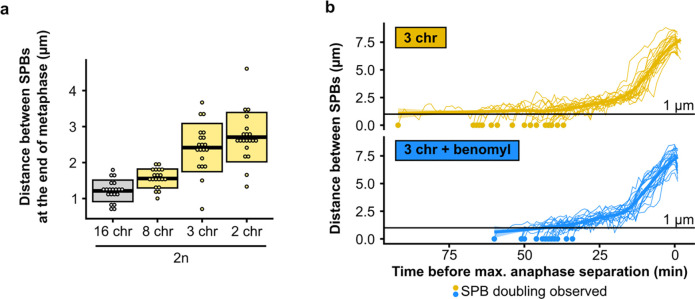
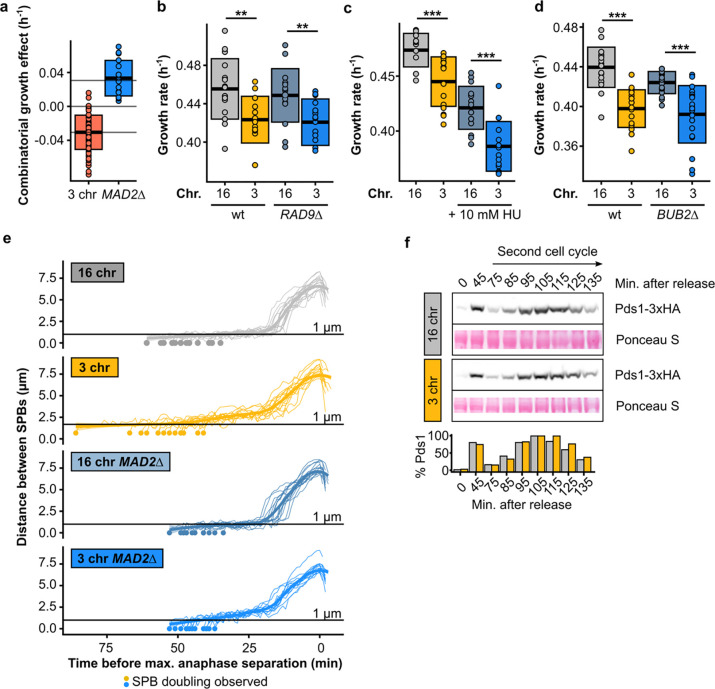
The eukaryotic cell division machinery must rapidly and reproducibly duplicate and partition the cell's chromosomes in a carefully coordinated process. However, chromosome number varies dramatically between genomes, even on short evolutionary timescales. We sought to understand how the mitotic machinery senses and responds to karyotypic changes by using a series of budding yeast strains in which the native chromosomes have been successively fused. Using a combination of cell biological profiling, genetic engineering, and experimental evolution, we show that chromosome fusions are well tolerated up until a critical point. Cells with fewer than five centromeres lack the necessary number of kinetochore-microtubule attachments needed to counter outward forces in the metaphase spindle, triggering the spindle assembly checkpoint and prolonging metaphase. Our findings demonstrate that spindle architecture is a constraining factor for karyotype evolution.


Conflict of interest statement

Competing interests Authors declare that they have no competing interests.

Figures

Extended Data Fig. 1 |
Extended Data Fig. 1 |. Growth and mitotic defects in fused-chromosome strains.
(a) Maximum growth rates of fused-chromosome strains on synthetic complete medium with 2% dextrose (SCD). Boxes show the means and standard deviation. Means were compared using a Student’s t-test; * p < 0.05 (b) Distance between SPBs over time for different fusion strains. For normalization, the time point with maximal SPB separation during anaphase was set to zero. (c) Expanded cells with spindle defects. Cells were labeled with pan protein label NHS ester and for tubulin. Scale bar = 10 μm, expansion factor = 4.18. (d) Montage of spindle dynamics over time (CloverGFP-tub1). Scale bar = 5 μm, intervals are 1 min. Closed arrows point to an example of increased spindle curvature, open arrows to an example of the whole spindle moving into the daughter cell. (e) Spindle curvature (%), calculated as the total spindle length relative to the distance between spindle pole bodies (SPBs). n = 50 for each genotype. Distributions were compared using Kolmogorov-Smirnov tests; ** p < 0.01, *** p < 0.001. (f) Montage of nuclear envelope (Hmg1-mCherry) dynamics over time. Scale bar = 5 μm, intervals are 1 min.
Extended Data Fig. 2 |
Extended Data Fig. 2 |. PFGE of evolved strains shows no chromosome fission.
PFGE gels showing the karyotype of the evolved 3-chromosome populations. Red stars indicate populations with cross-contamination of a wild-type strain. Chromosome numbers of clones isolated from these populations were double-checked before ploidy determination and sequencing.
Extended Data Fig. 3 |
Extended Data Fig. 3 |. Distance between SPBs over time in diploids.
For normalization, the time point with maximal SPB separation during anaphase was set to zero.
Extended Data Fig. 4 |
(a) Distance between SPBs at the end of anaphase for different diploid fusion strains. (b) Distance between SPBs over time in benomyl-treated cells. For normalization, the time point with maximal SPB separation during anaphase was set to zero.
Extended Data Fig. 5 |
(a) Epistatic effect of MAD2 deletion. Boxes represent means and standard deviation. (b) Maximum growth rates of fused-chromosome strains with and without RAD9 deletion. Boxes represent means and standard deviations. Means were compared using a Student’s t-test; ** p < 0.01. (c) Maximum growth rates of fused-chromosome strains with and without 10 mM hydroxyurea. Boxes represent means and standard deviations. Means were compared using a Student’s t-test; *** p < 0.001. (d) Maximum growth rates of fused-chromosome strains with and without BUB2 deletion. Boxes represent means and standard deviations. Means were compared using a Student’s t-test; *** p < 0.001. (e) Distance between SPBs over time in MAD2Δ cells. For normalization, the time point with maximal SPB separation during anaphase was set to zero. (f) Western blot analysis of Pds1 levels after G1 release for 16- and 3-chromosome strains, focused on the second cell cycle after release. Cells were collected at the indicated time points. Ponceau S staining was used as a loading control. Pds1-normalised values are shown in the bar plot at the bottom.
Fig. 1 |
Fig. 1 |. Chromosome fusions induce spindle defects from 1n = 4.
(a) Chromosome lengths of wild-type (16 chr.) and 3 chr. Saccharomyces cerevisiae. Vertical lines indicate positions of centromeres. (b) Maximum growth rates of fused-chromosome strains on synthetic complete medium with 2% dextrose (SCD). Boxes show the means and standard deviation. Means were compared to wild type of the same mating type using a Student’s t-test; *** p < 0.001. (c) Montage of SPB (Spc42-mCherry) dynamics during mitosis for 16- and 3-chromosome strains. Scale bar = 2 μm, intervals are 3 minutes. The time point with maximal SPB separation during anaphase was set to zero. Open arrows indicate SPB doubling. (d) Distance between SPBs over time. For normalization, the time point with maximal SPB separation during anaphase was set to zero. The vertical line represents the inflection point (~ start of anaphase). (e) The time from SPB doubling to max. anaphase separation. Boxes represent the mean and standard deviation. Means were compared using a Student’s t-test; * p < 0.05, *** p < 0.001.
Fig. 2 |
Fig. 2 |. Defects are overcome by diploidization during experimental evolution.
(a) Schematic overview of the evolution experiments. Replicate populations of strains with either 16, 8, or 3 chromosomes were inoculated in 96-well plates filled with 100 μL SCD, and 1:100 of each culture was transferred daily for a total of ~150 generations. (b) Maximum growth rate on SCD over the course of evolution separated by genotype. Curves are smoothed and represent the average trend of 8 replicate evolving populations. Ribbons represent 95% confidence intervals. (c) Mutations observed in selected evolved strains. The number of mutations per sequenced strain is shown on the left, the proportions of homozygous and heterozygous mutations are shown in green, and the pink charts show the proportion of nonsense mutations and frameshifts (STOP), nonsynonymous mutations (Nonsyn.), synonymous mutations (Syn.), and intergenic mutations (Intergenic). (d) Representative PFGE gel showing the karyotype of the 3 ancestral genotypes and 11 evolved 3-chromosome strains. (e) The proportion of ploidies observed in evolved strains separated by genotype. For evolved 16- and 8-chromosome strains, clones from 16 populations were checked for ploidy. For evolved 3-chromosome strains, all 56 populations were checked for ploidy. (f) To make diploids, the mating type was switched using a plasmid with inducible HO endonuclease, and cells were allowed to mate to form diploids (left), maximum growth rates of haploid and diploid fused-chromosome strains (middle), and epistasis between chromosome number and ploidy (right). Boxes represent the means and standard deviation. Means were compared using a Student’s t-test; * p < 0.05.
Fig. 3 |
Fig. 3 |. Five centromeres are sufficient to overcome the mitotic defect.
(a) Maximum growth rates of fused-chromosome strains with and without additional centromere (red circle), supplied on either a plasmid or a small artificial chromosome. Boxes represent means and standard deviation. Means were compared using a Student’s t-test. (b) Maximum growth rates of haploid and diploid fused-chromosome strains. Boxes represent means and standard deviation. Means were compared using a Student’s t-test; * p < 0.05, *** p < 0.001. (c) Distance between SPBs over time for the 4-chromosome strain with and without centromeric plasmid. For normalization, the time point with maximal SPB separation during anaphase was set to zero. (d) The time from SPB doubling to max. anaphase separation for the 4-chromosome strain with and without centromeric plasmid. Boxes represent the means and standard deviation. Means were compared using a Student’s t-test; * p < 0.05. (e) The time from SPB doubling to max. anaphase separation for diploid strains. Boxes represent the means and standard deviation. Means were compared using a Student’s t-test; * p < 0.05.
Fig. 4 |
Fig. 4 |. Decreasing the net outward force in the mitotic spindle alleviates the defect.
(a) Simplified schematic of inward (green arrows) and outward (pink arrows) forces in a metaphase spindle. (b) Distance between SPBs at the end of anaphase for different fusion strains. (c) Maximum growth rates of fused-chromosome strains with and without benomyl. Boxes represent means and standard deviation. Means were compared using a Student’s t-test; *** p < 0.001. (d) The time from SPB doubling to max. anaphase separation. Boxes represent means and standard deviation. Means were compared using a Student’s t-test; ** p < 0.01, *** p < 0.001. (e) Maximum growth rates of fused-chromosome strains with and without KIP1 deletion. Boxes represent means and standard deviation. Means were compared using a Student’s t-test; ** p < 0.01. (f) Summary of epistatic effects of different perturbations. Diploidization, adding a centromeric plasmid, or adding an artificial chromosome increase the inward force, and adding benomyl or deleting KIP1 decrease the outward force. Boxes represent means and standard deviation. (g) Distance between SPBs at the end of anaphase for different fusion strains and the effects of increasing inward force (+pCEN) or decreasing outward force (+benomyl). Means were compared using a Student’s t-test; * p < 0.05, *** p < 0.001.
Fig. 5 |
Fig. 5 |. The force imbalance causes kinetochore declustering and triggers the SAC.
(a) Maximum growth rates of fused-chromosome strains with and without MAD2 deletion. Boxes represent means and standard deviations. Means were compared using a Student’s t-test; *** p < 0.001. (b) The time from SPB doubling to max. anaphase separation. Boxes represent the means and standard deviations. Means were compared using a Student’s t-test; ** p < 0.01. (c) Maximum growth rates of fused-chromosome strains with and without MAD2 deletion + benomyl treatment (55 μM). Boxes represent means and standard deviations. Means were compared using a Student’s t-test; *** p < 0.001. (d) Western blot analysis of Pds1 levels after G1 release for 16- and 3-chromosome strains. Cells were collected at the indicated time points and alpha factor was added again 45 minutes after release to prevent the cells from entering a second cell cycle. Actin levels were used as a loading control. Pds1-normalised values are shown in the bar plot at the bottom. (e) Proportion of cells with a bilobed kinetochore signal (i.e. bimodal Ndc80 signal along the spindle pole to spindle pole axis) in both metaphase and anaphase. Proportions were compared using a two-proportions Z-test; * p < 0.05. (f) Montage of kinetochore (Ndc80-mNG) and SPB (Spc42-mCherry) dynamics during metaphase for 16- and 3-chromosome strains. Scale bar = 2 μm, intervals are 30 seconds. (g) Montage of kinetochore (Ndc80-mNG) and SPB (Spc42-mCherry) dynamics during metaphase in 3-chromosome strains with benomyl (55 μM). Scale bar = 2 μm, intervals are 1 minute.

References

    1. Mudd A. B., Bredeson J. V., Baum R., Hockemeyer D. & Rokhsar D. S. Analysis of muntjac deer genome and chromatin architecture reveals rapid karyotype evolution. Commun. Biol. 3, 480 (2020). - PMC - PubMed
    1. Lukhtanov V. The blue butterfly Polyommatus (Plebicula) atlanticus (Lepidoptera, Lycaenidae) holds the record of the highest number of chromosomes in the non-polyploid eukaryotic organisms. Comp. Cytogenet. 9, 683–690 (2015). - PMC - PubMed
    1. Marcet-Houben M. & Gabaldón T. Beyond the Whole-Genome Duplication: Phylogenetic Evidence for an Ancient Interspecies Hybridization in the Baker’s Yeast Lineage. PLOS Biol. 13, e1002220 (2015). - PMC - PubMed
    1. Oromendia A. B., Dodgson S. E. & Amon A. Aneuploidy causes proteotoxic stress in yeast. Genes Dev. 26, 2696–2708 (2012). - PMC - PubMed
    1. Nagaoka S. I., Hassold T. J. & Hunt P. A. Human aneuploidy: mechanisms and new insights into an age-old problem. Nat. Rev. Genet. 13, 493–504 (2012). - PMC - PubMed

Publication types