

This is a preprint.
Amide Proton Transfer (APT) imaging in tumor with a machine learning approach using partially synthetic data
- PMID: 37961738
- PMCID: PMC10635304
Amide Proton Transfer (APT) imaging in tumor with a machine learning approach using partially synthetic data
Update in
-
Machine learning-based amide proton transfer imaging using partially synthetic training data.Magn Reson Med. 2024 May;91(5):1908-1922. doi: 10.1002/mrm.29970. Epub 2023 Dec 14. Magn Reson Med. 2024. PMID: 38098340 Free PMC article.
Abstract
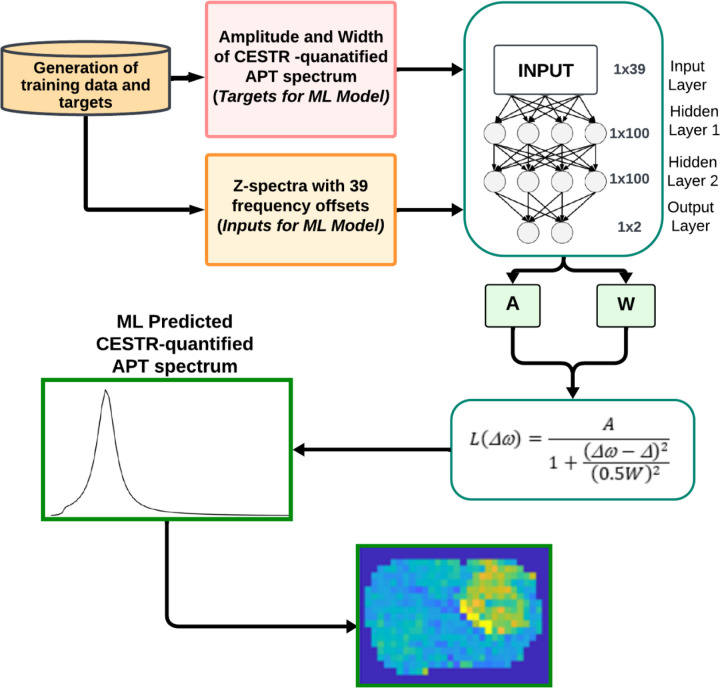
Purpose: Machine learning (ML) has been increasingly used to quantify chemical exchange saturation transfer (CEST) effect. ML models are typically trained using either measured data or fully simulated data. However, training with measured data often lacks sufficient training data, while training with fully simulated data may introduce bias due to limited simulations pools. This study introduces a new platform that combines simulated and measured components to generate partially synthetic CEST data, and to evaluate its feasibility for training ML models to predict amide proton transfer (APT) effect.
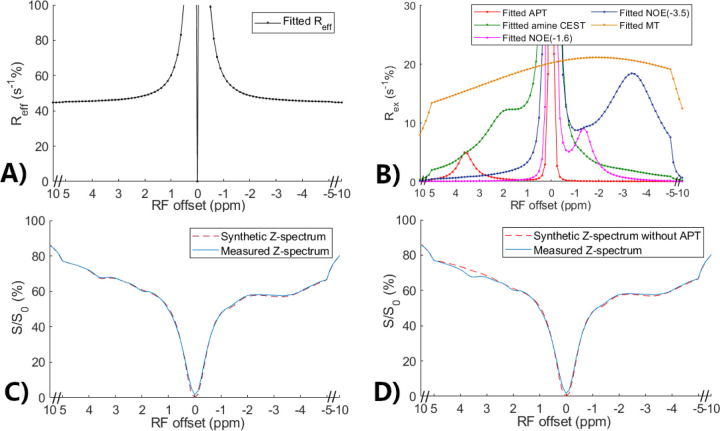
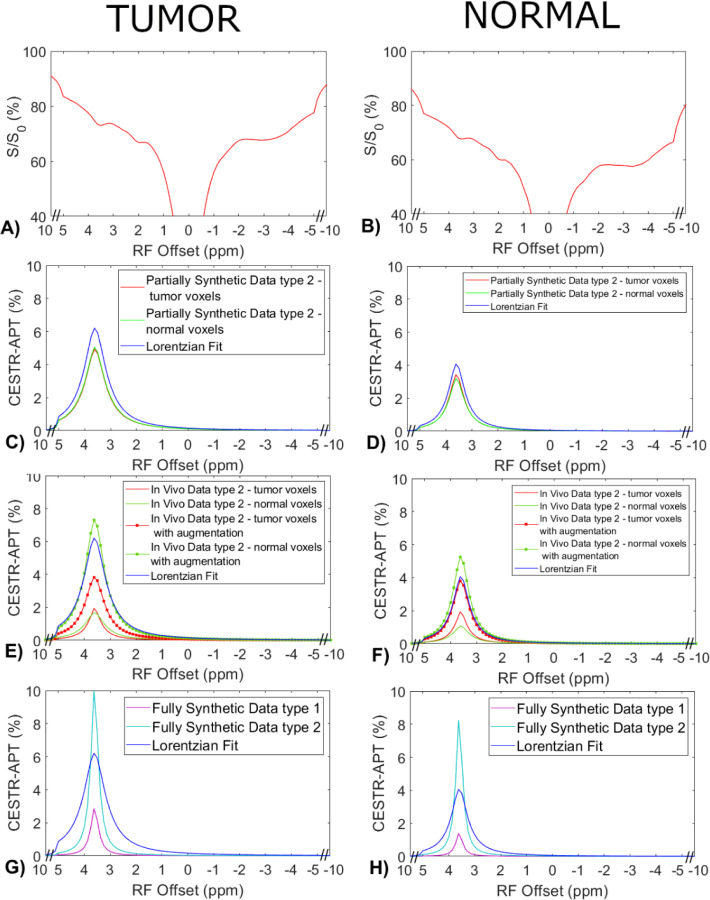
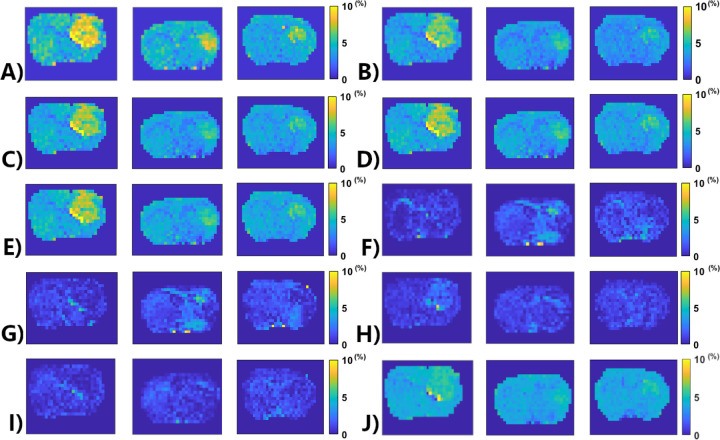
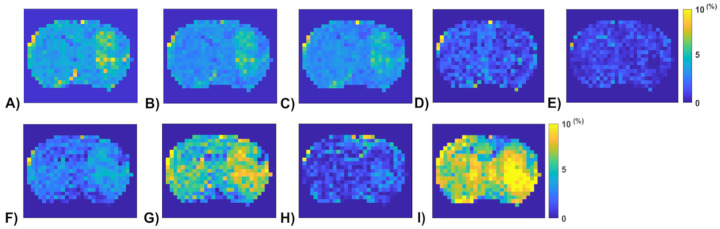
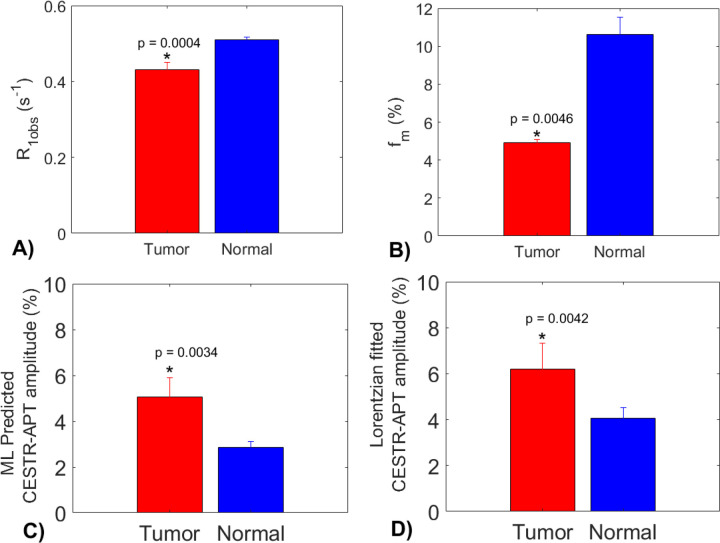
Methods: Partially synthetic CEST signals were created using an inverse summation of APT effects from simulations and the other components from measurements. Training data were generated by varying APT simulation parameters and applying scaling factors to adjust the measured components, achieving a balance between simulation flexibility and fidelity. First, tissue-mimicking CEST signals along with ground truth information were created using multiple-pool model simulations to validate this method. Second, an ML model was trained individually on partially synthetic data, in vivo data, and fully simulated data, to predict APT effect in rat brains bearing 9L tumors.
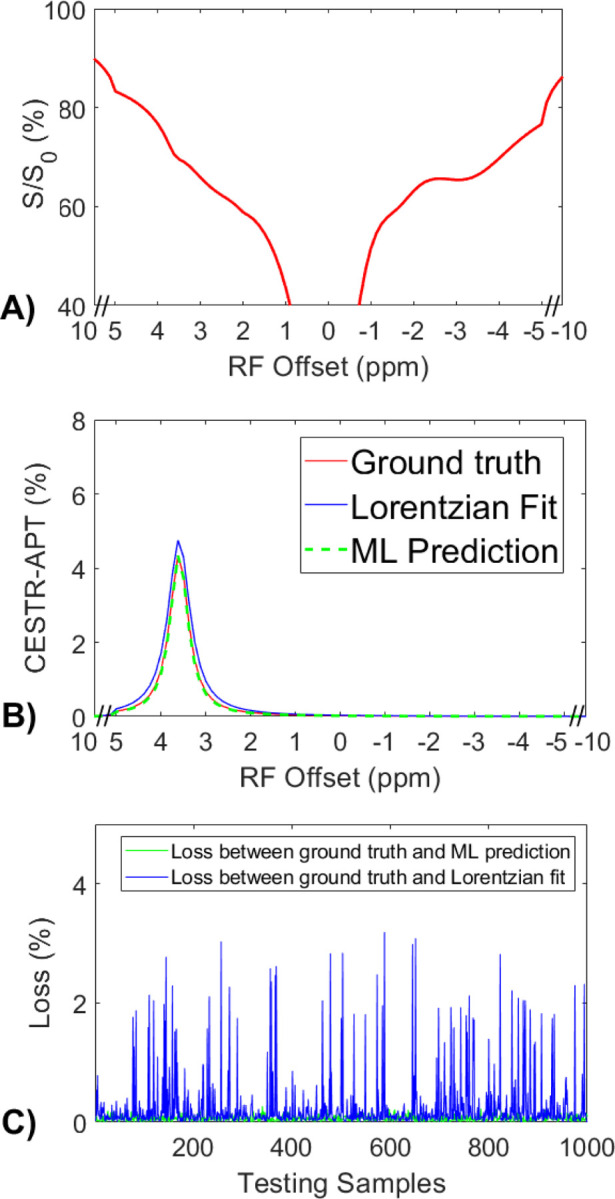
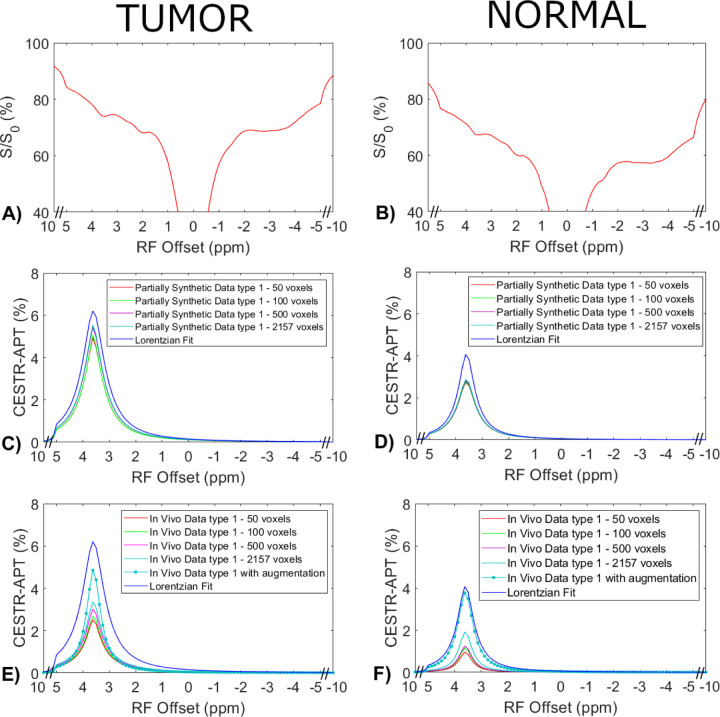
Results: Experiments on tissue-mimicking data suggest that the ML method using the partially synthetic data is accurate in predicting APT. In vivo experiments suggest that our method provides more accurate and robust prediction than the training using in vivo data and fully synthetic data.
Conclusion: Partially synthetic CEST data can address the challenges in conventional ML methods.
Keywords: Chemical exchange saturation transfer (CEST); amide proton transfer (APT); machine learning; tumor.
Figures
Similar articles
-
Machine learning-based amide proton transfer imaging using partially synthetic training data.Magn Reson Med. 2024 May;91(5):1908-1922. doi: 10.1002/mrm.29970. Epub 2023 Dec 14. Magn Reson Med. 2024. PMID: 38098340 Free PMC article.
-
Enhancing amide proton transfer imaging in ischemic stroke using a machine learning approach with partially synthetic data.NMR Biomed. 2025 Jan;38(1):e5277. doi: 10.1002/nbm.5277. Epub 2024 Oct 21. NMR Biomed. 2025. PMID: 39434444 Free PMC article.
-
Imaging amide proton transfer and nuclear overhauser enhancement using chemical exchange rotation transfer (CERT).Magn Reson Med. 2014 Aug;72(2):471-6. doi: 10.1002/mrm.24953. Epub 2013 Dec 2. Magn Reson Med. 2014. PMID: 24302497 Free PMC article.
-
Amide Proton Transfer-Chemical Exchange Saturation Transfer Imaging of Intracranial Brain Tumors and Tumor-like Lesions: Our Experience and a Review.Diagnostics (Basel). 2023 Feb 28;13(5):914. doi: 10.3390/diagnostics13050914. Diagnostics (Basel). 2023. PMID: 36900058 Free PMC article. Review.
-
Chemical exchange saturation transfer magnetic resonance imaging and its main and potential applications in pre-clinical and clinical studies.Quant Imaging Med Surg. 2019 Oct;9(10):1747-1766. doi: 10.21037/qims.2019.10.03. Quant Imaging Med Surg. 2019. PMID: 31728316 Free PMC article. Review.
References
-
- Zhou JY, van Zijl PCM. Chemical exchange saturation transfer imaging and spectroscopy. Prog Nucl Mag Res Sp 2006;48(2–3):109–136.
Publication types
Grants and funding
LinkOut - more resources
Full Text Sources