. 2024 Jan 16;149(3):227-250.
doi: 10.1161/CIRCULATIONAHA.123.066542. Epub 2023 Nov 14.

Novel Pan-ERR Agonists Ameliorate Heart Failure Through Enhancing Cardiac Fatty Acid Metabolism and Mitochondrial Function

Affiliations

Novel Pan-ERR Agonists Ameliorate Heart Failure Through Enhancing Cardiac Fatty Acid Metabolism and Mitochondrial Function

Weiyi Xu et al. Circulation. .

Abstract

Background: Cardiac metabolic dysfunction is a hallmark of heart failure (HF). Estrogen-related receptors ERRα and ERRγ are essential regulators of cardiac metabolism. Therefore, activation of ERR could be a potential therapeutic intervention for HF. However, in vivo studies demonstrating the potential usefulness of ERR agonist for HF treatment are lacking, because compounds with pharmacokinetics appropriate for in vivo use have not been available.

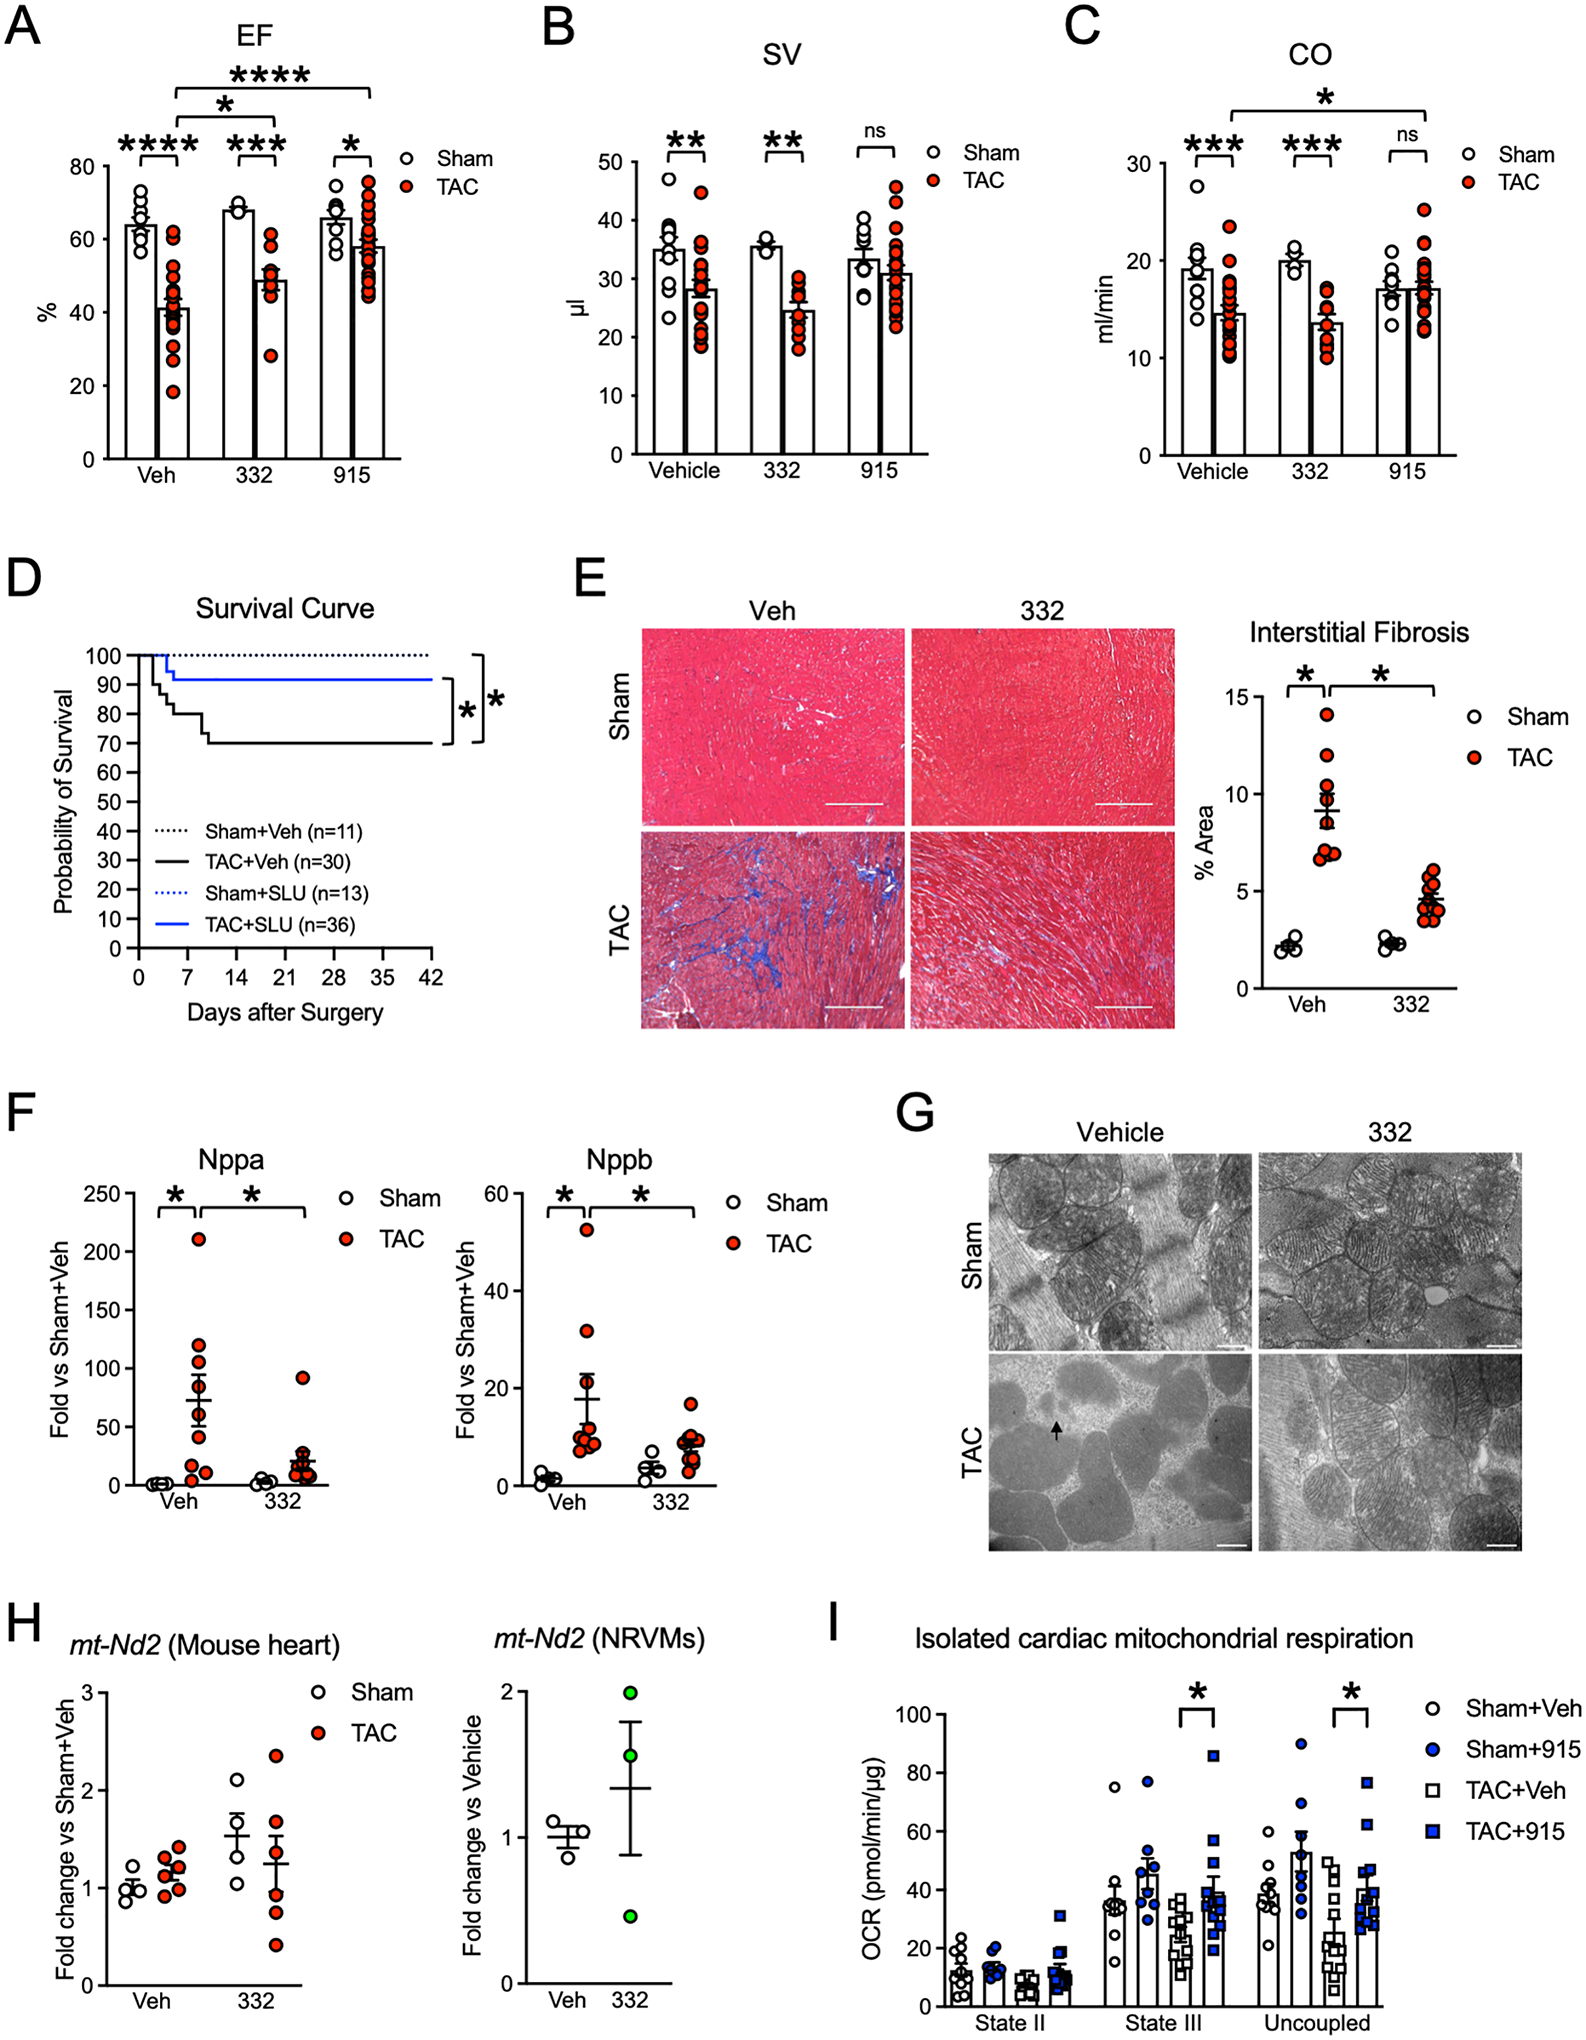
Methods: Using a structure-based design approach, we designed and synthesized 2 structurally distinct pan-ERR agonists, SLU-PP-332 and SLU-PP-915. We investigated the effect of ERR agonist on cardiac function in a pressure overload-induced HF model in vivo. We conducted comprehensive functional, multi-omics (RNA sequencing and metabolomics studies), and genetic dependency studies both in vivo and in vitro to dissect the molecular mechanism, ERR isoform dependency, and target specificity.

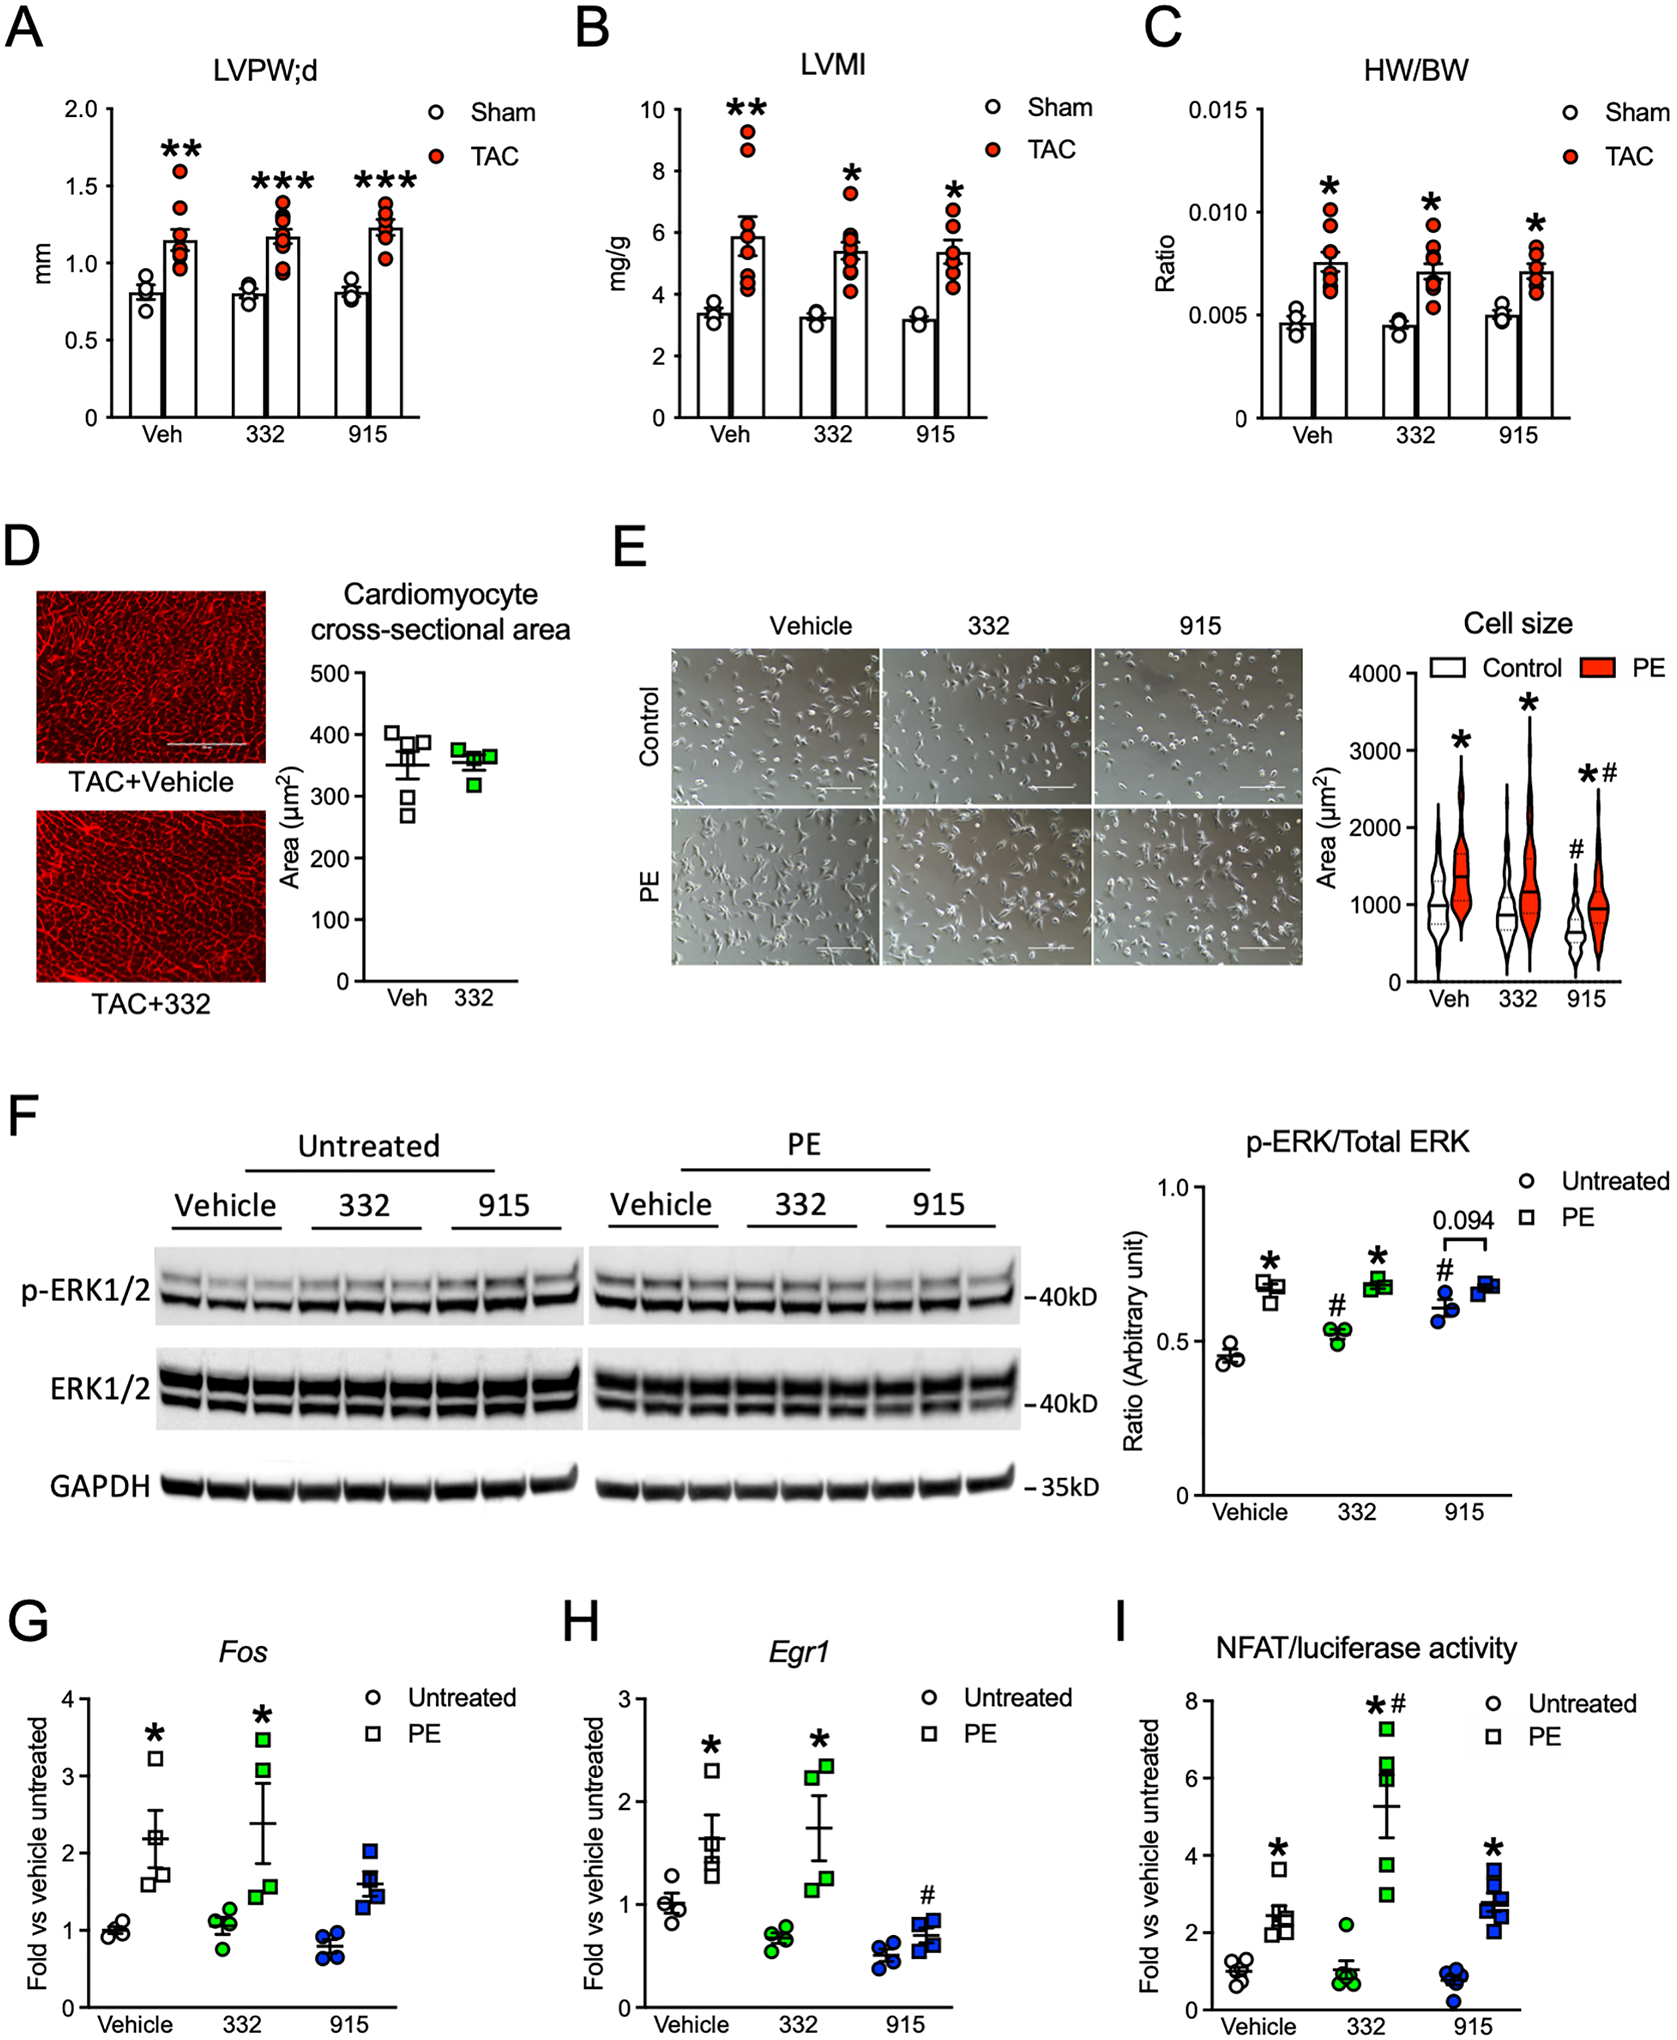
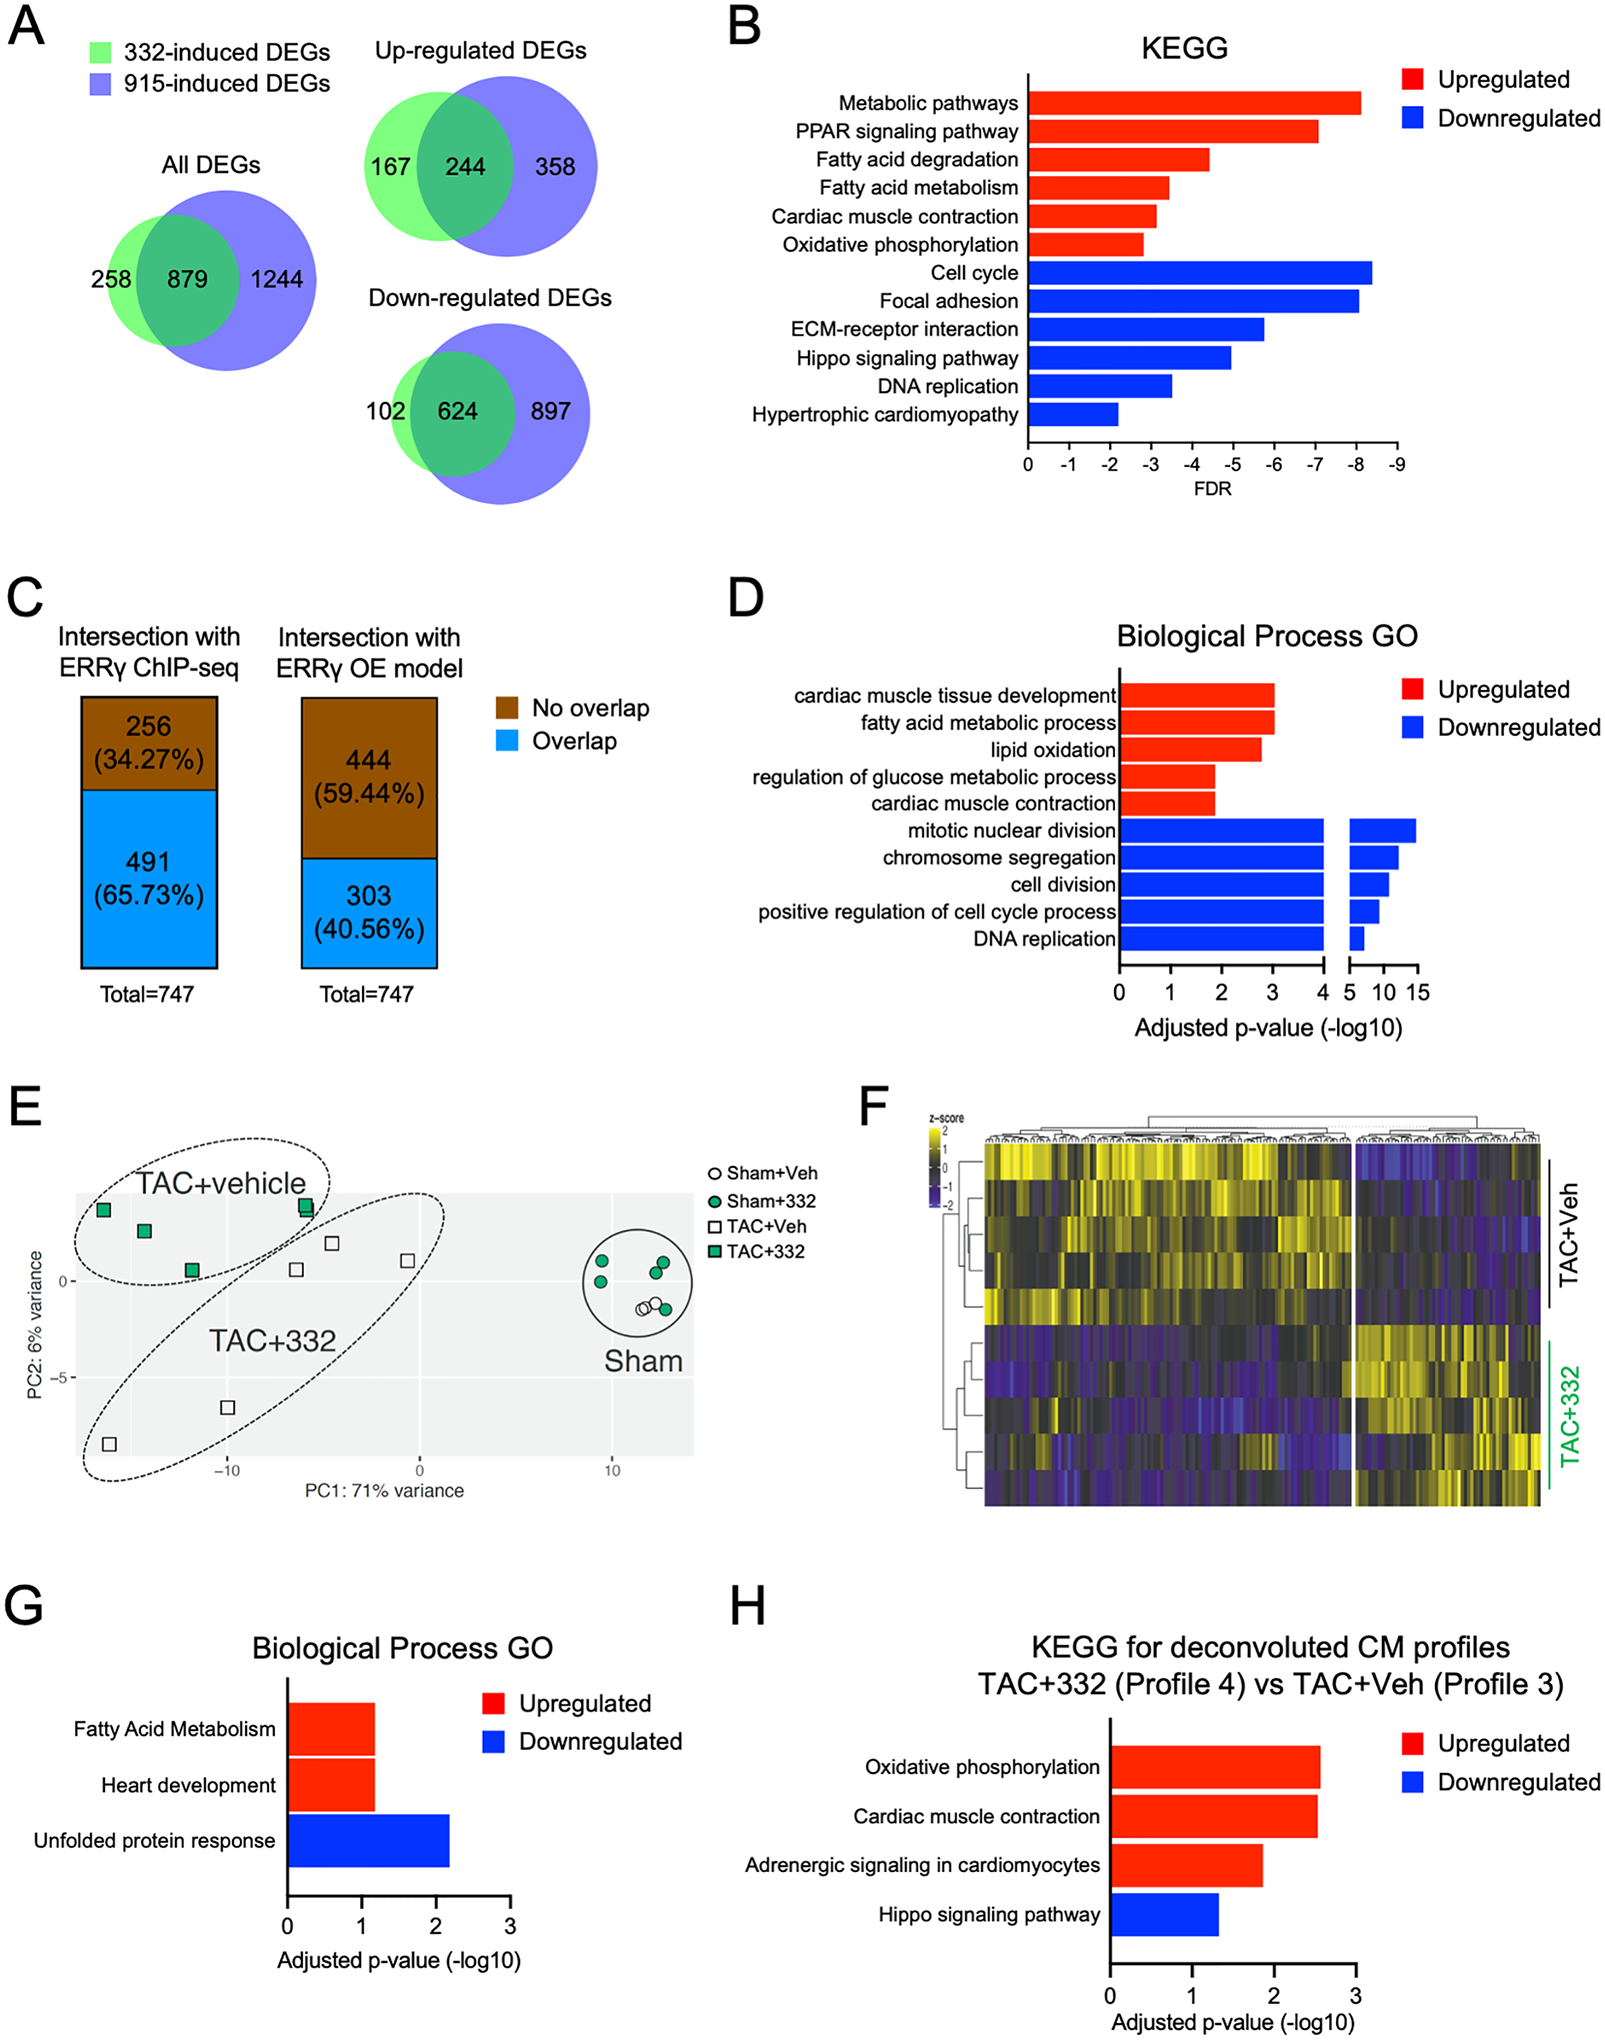
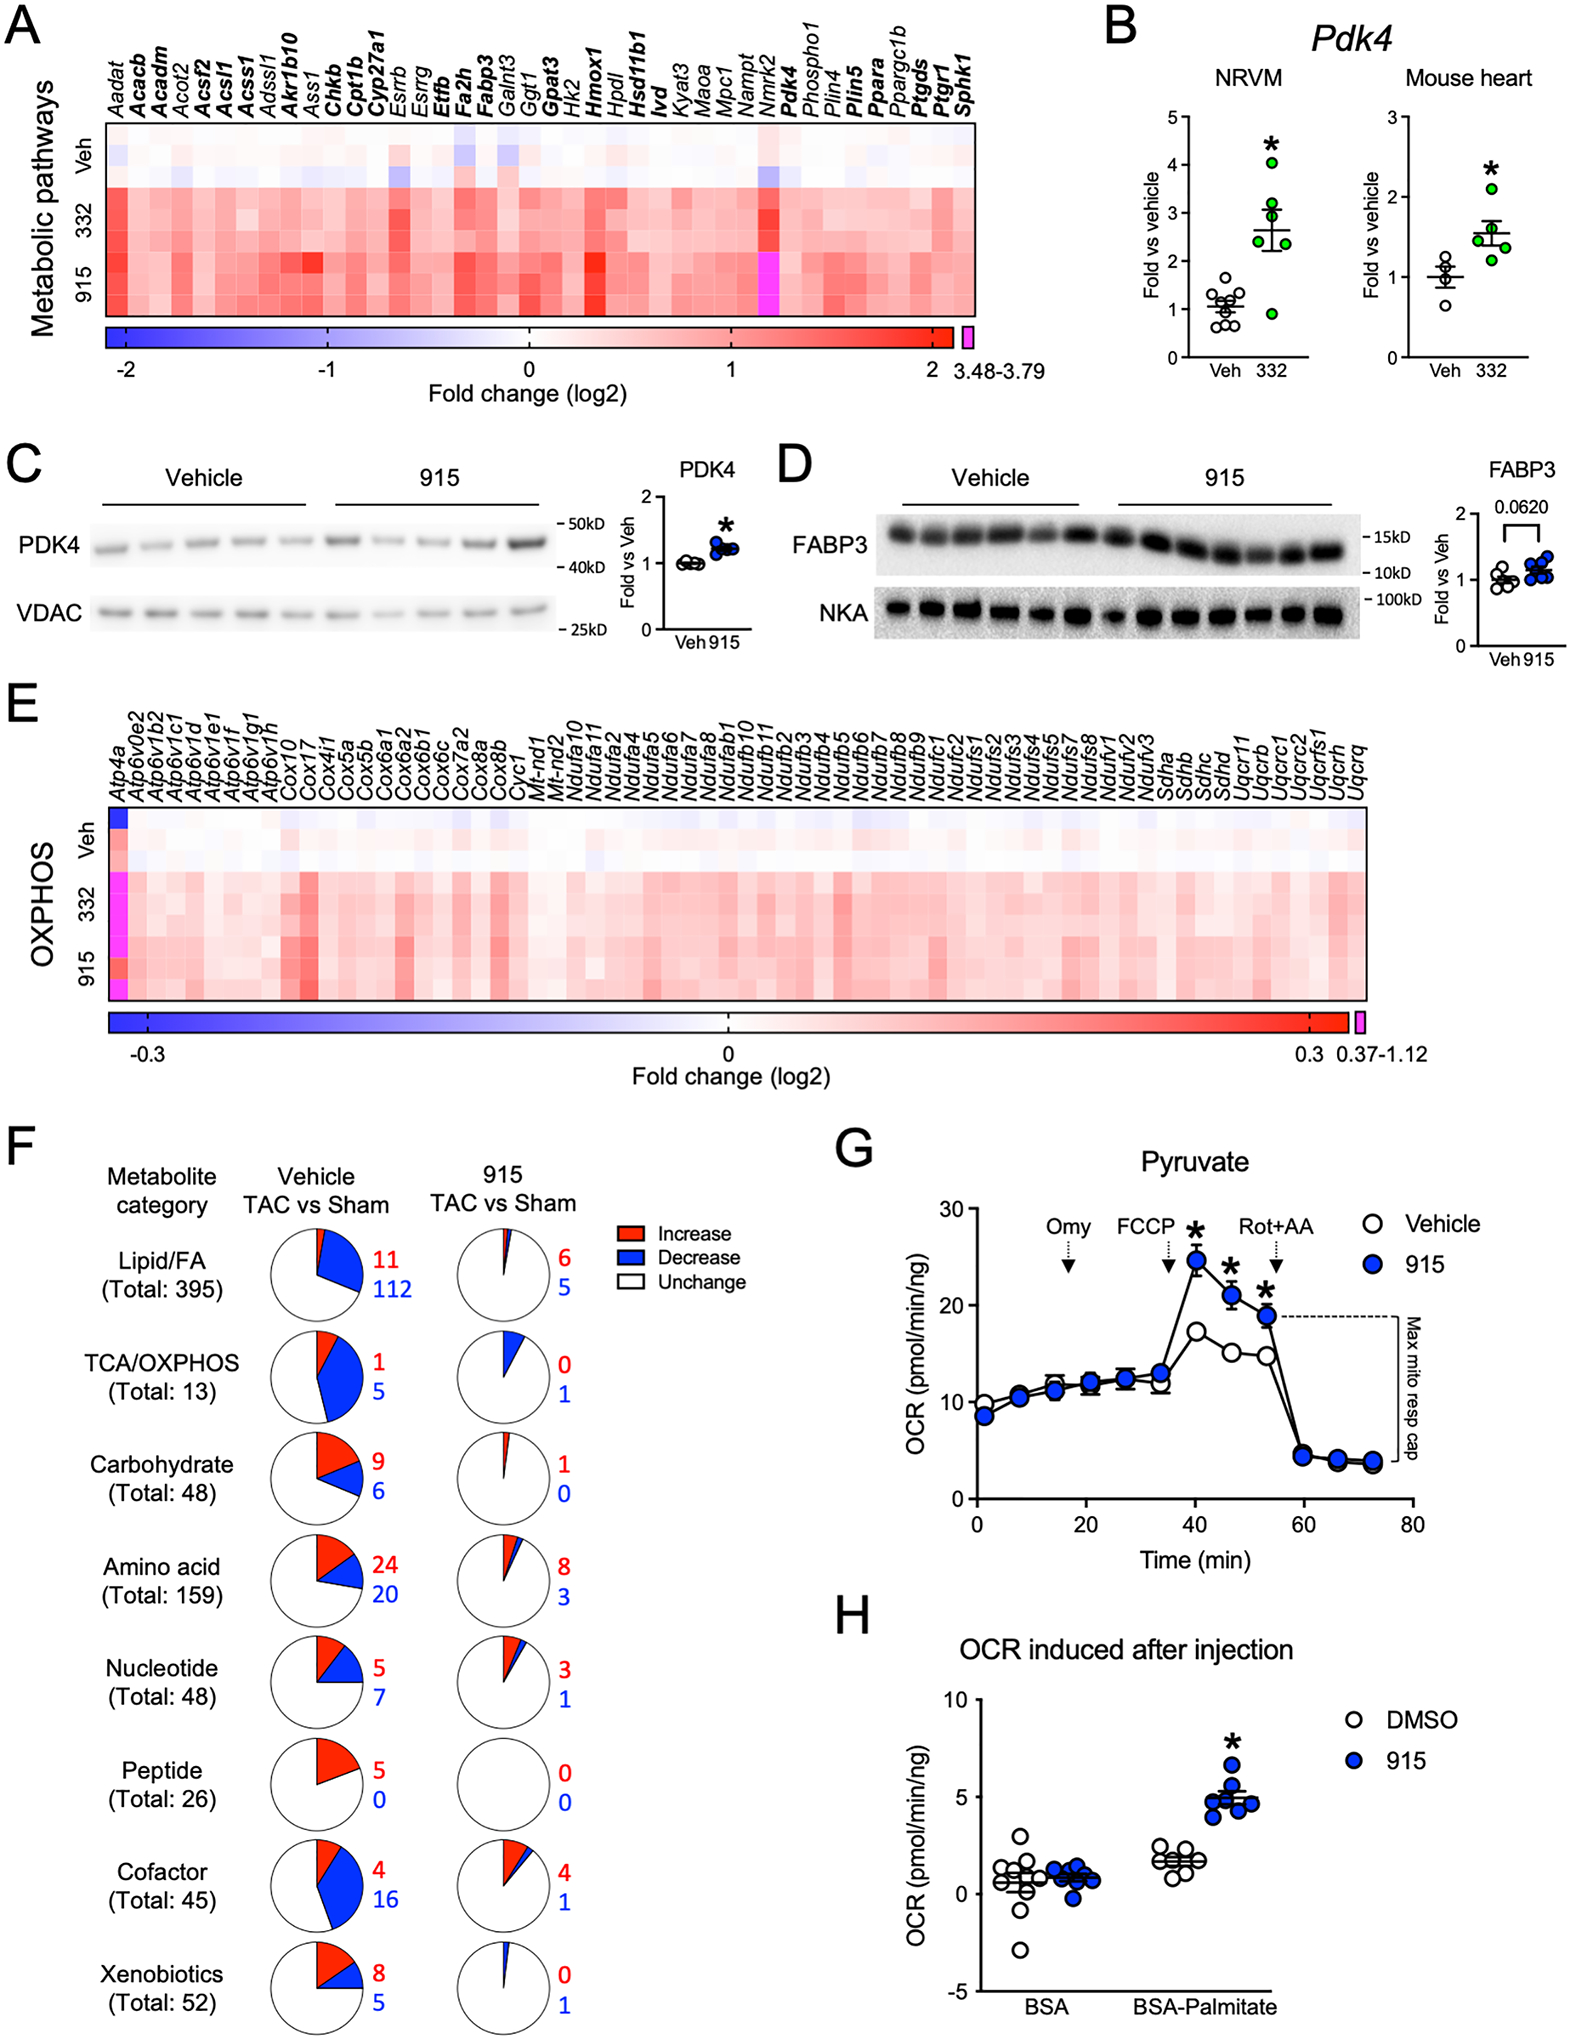
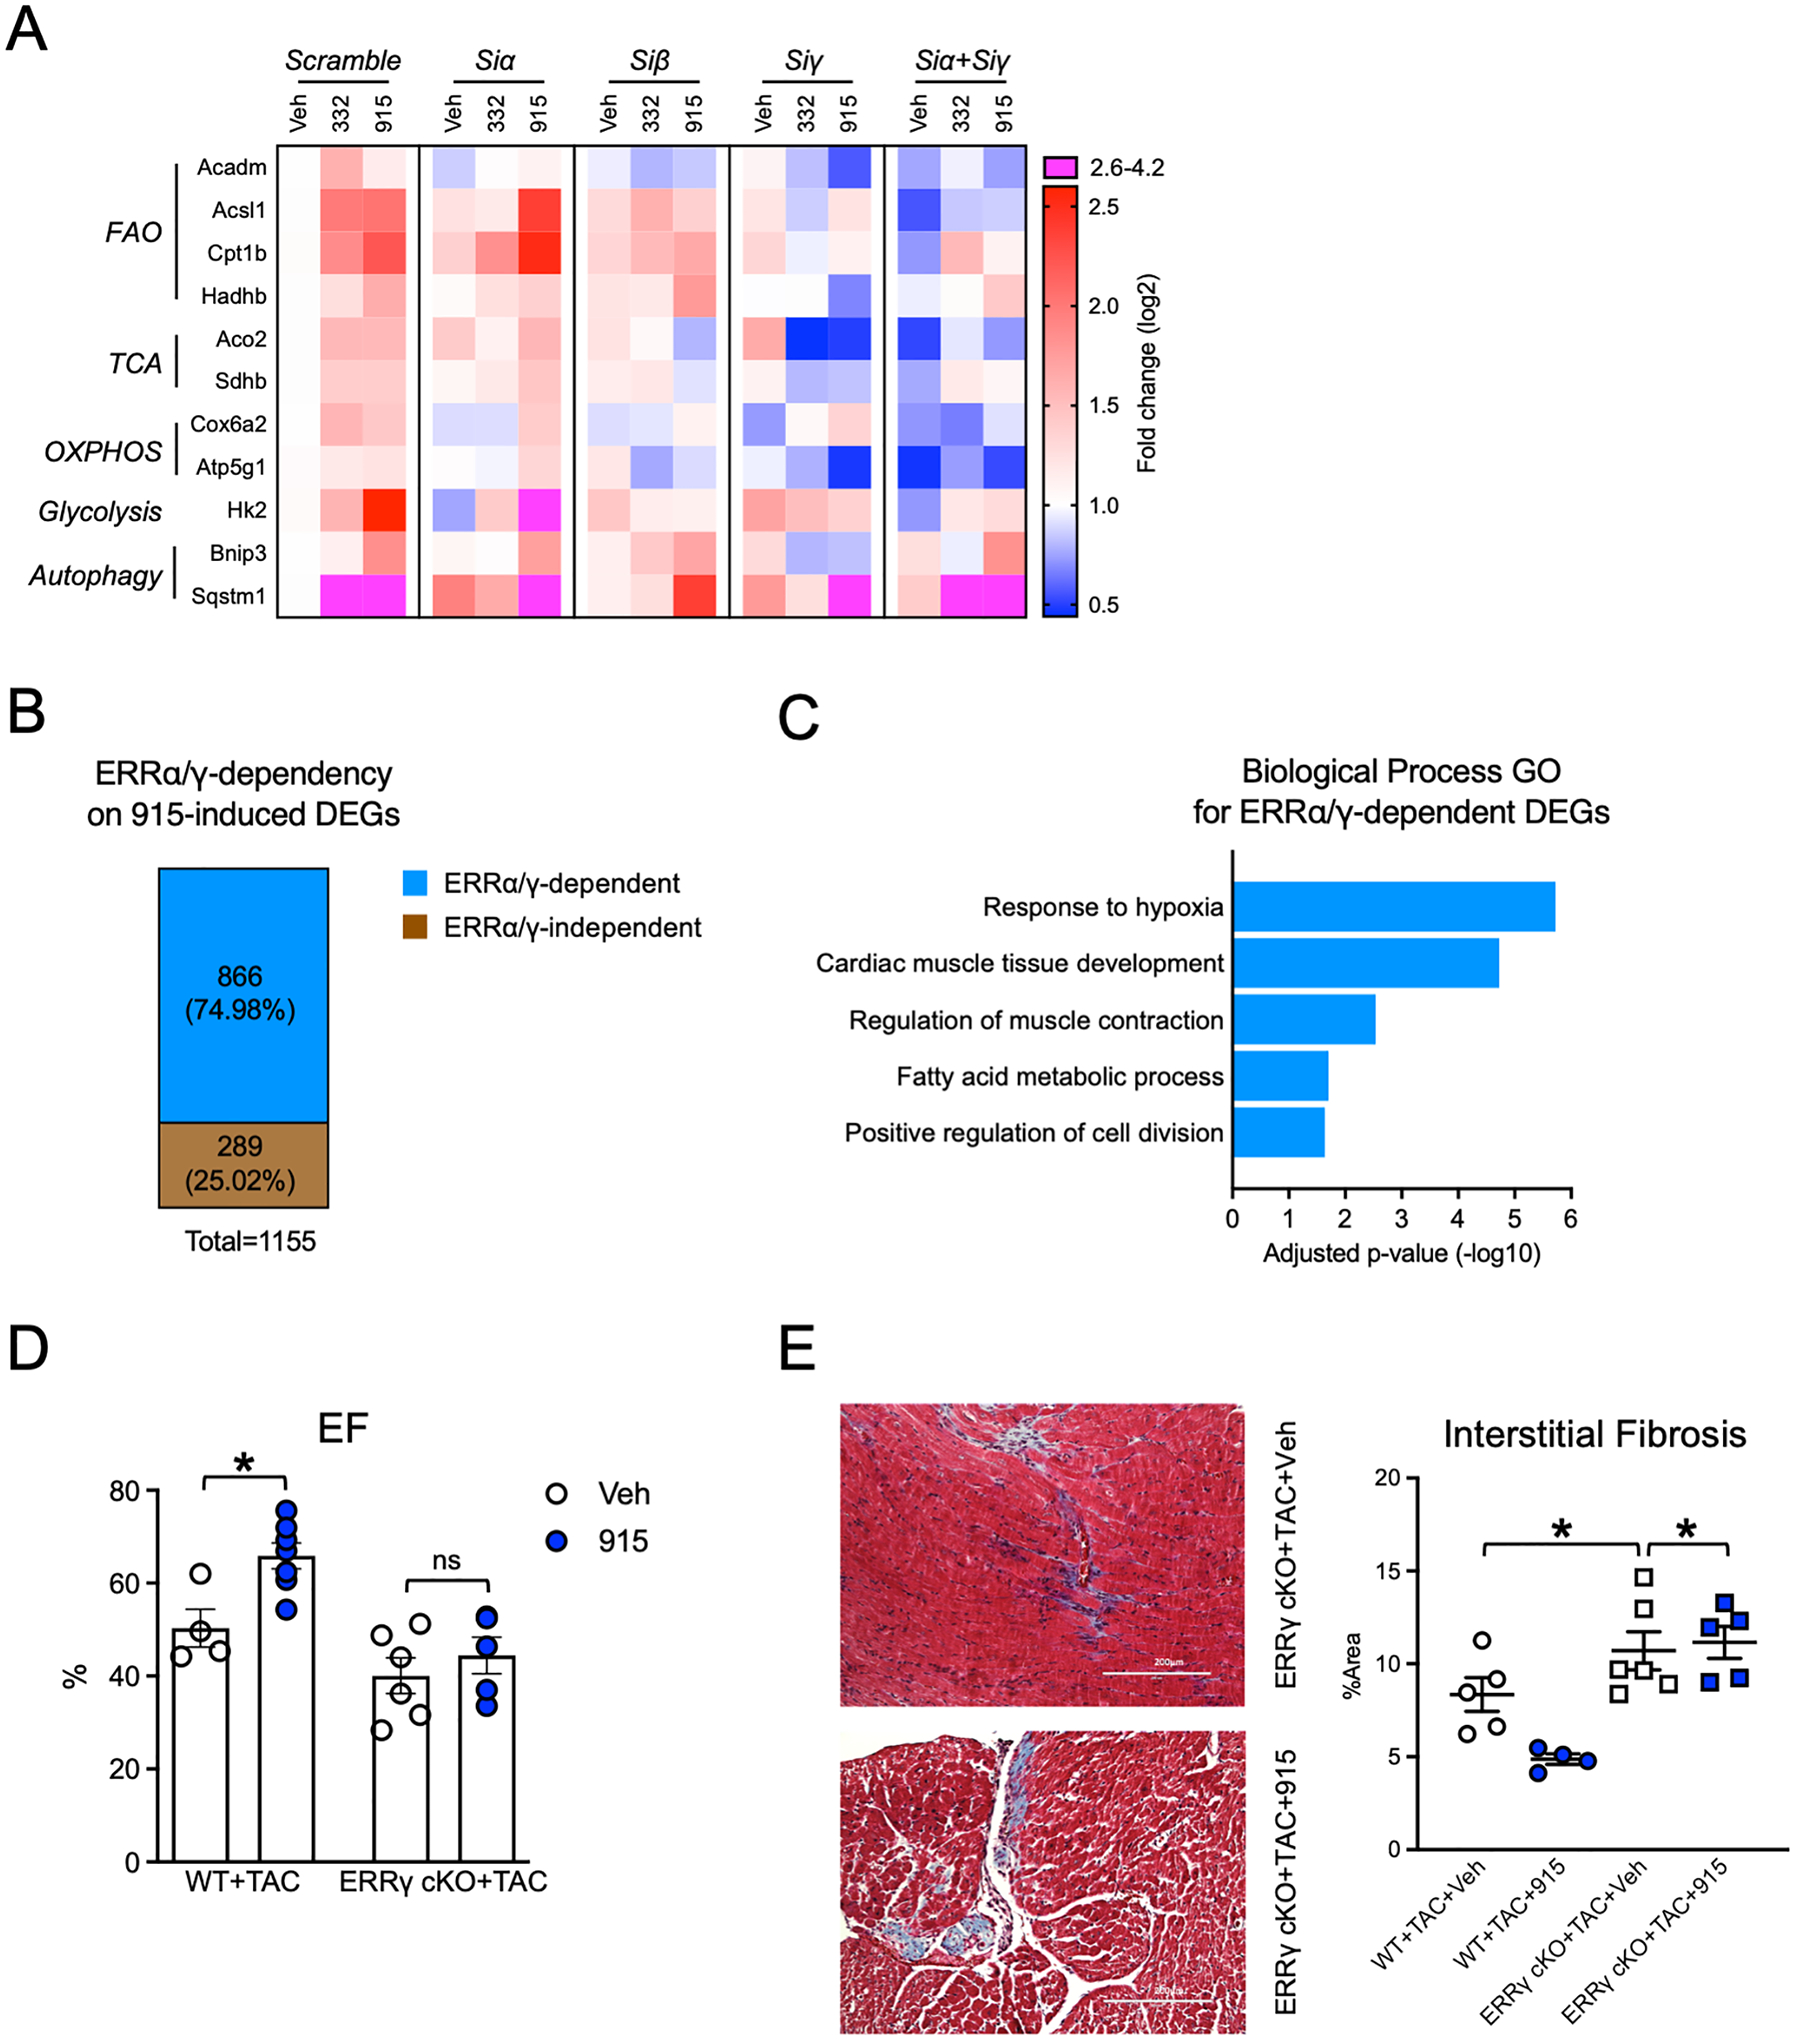
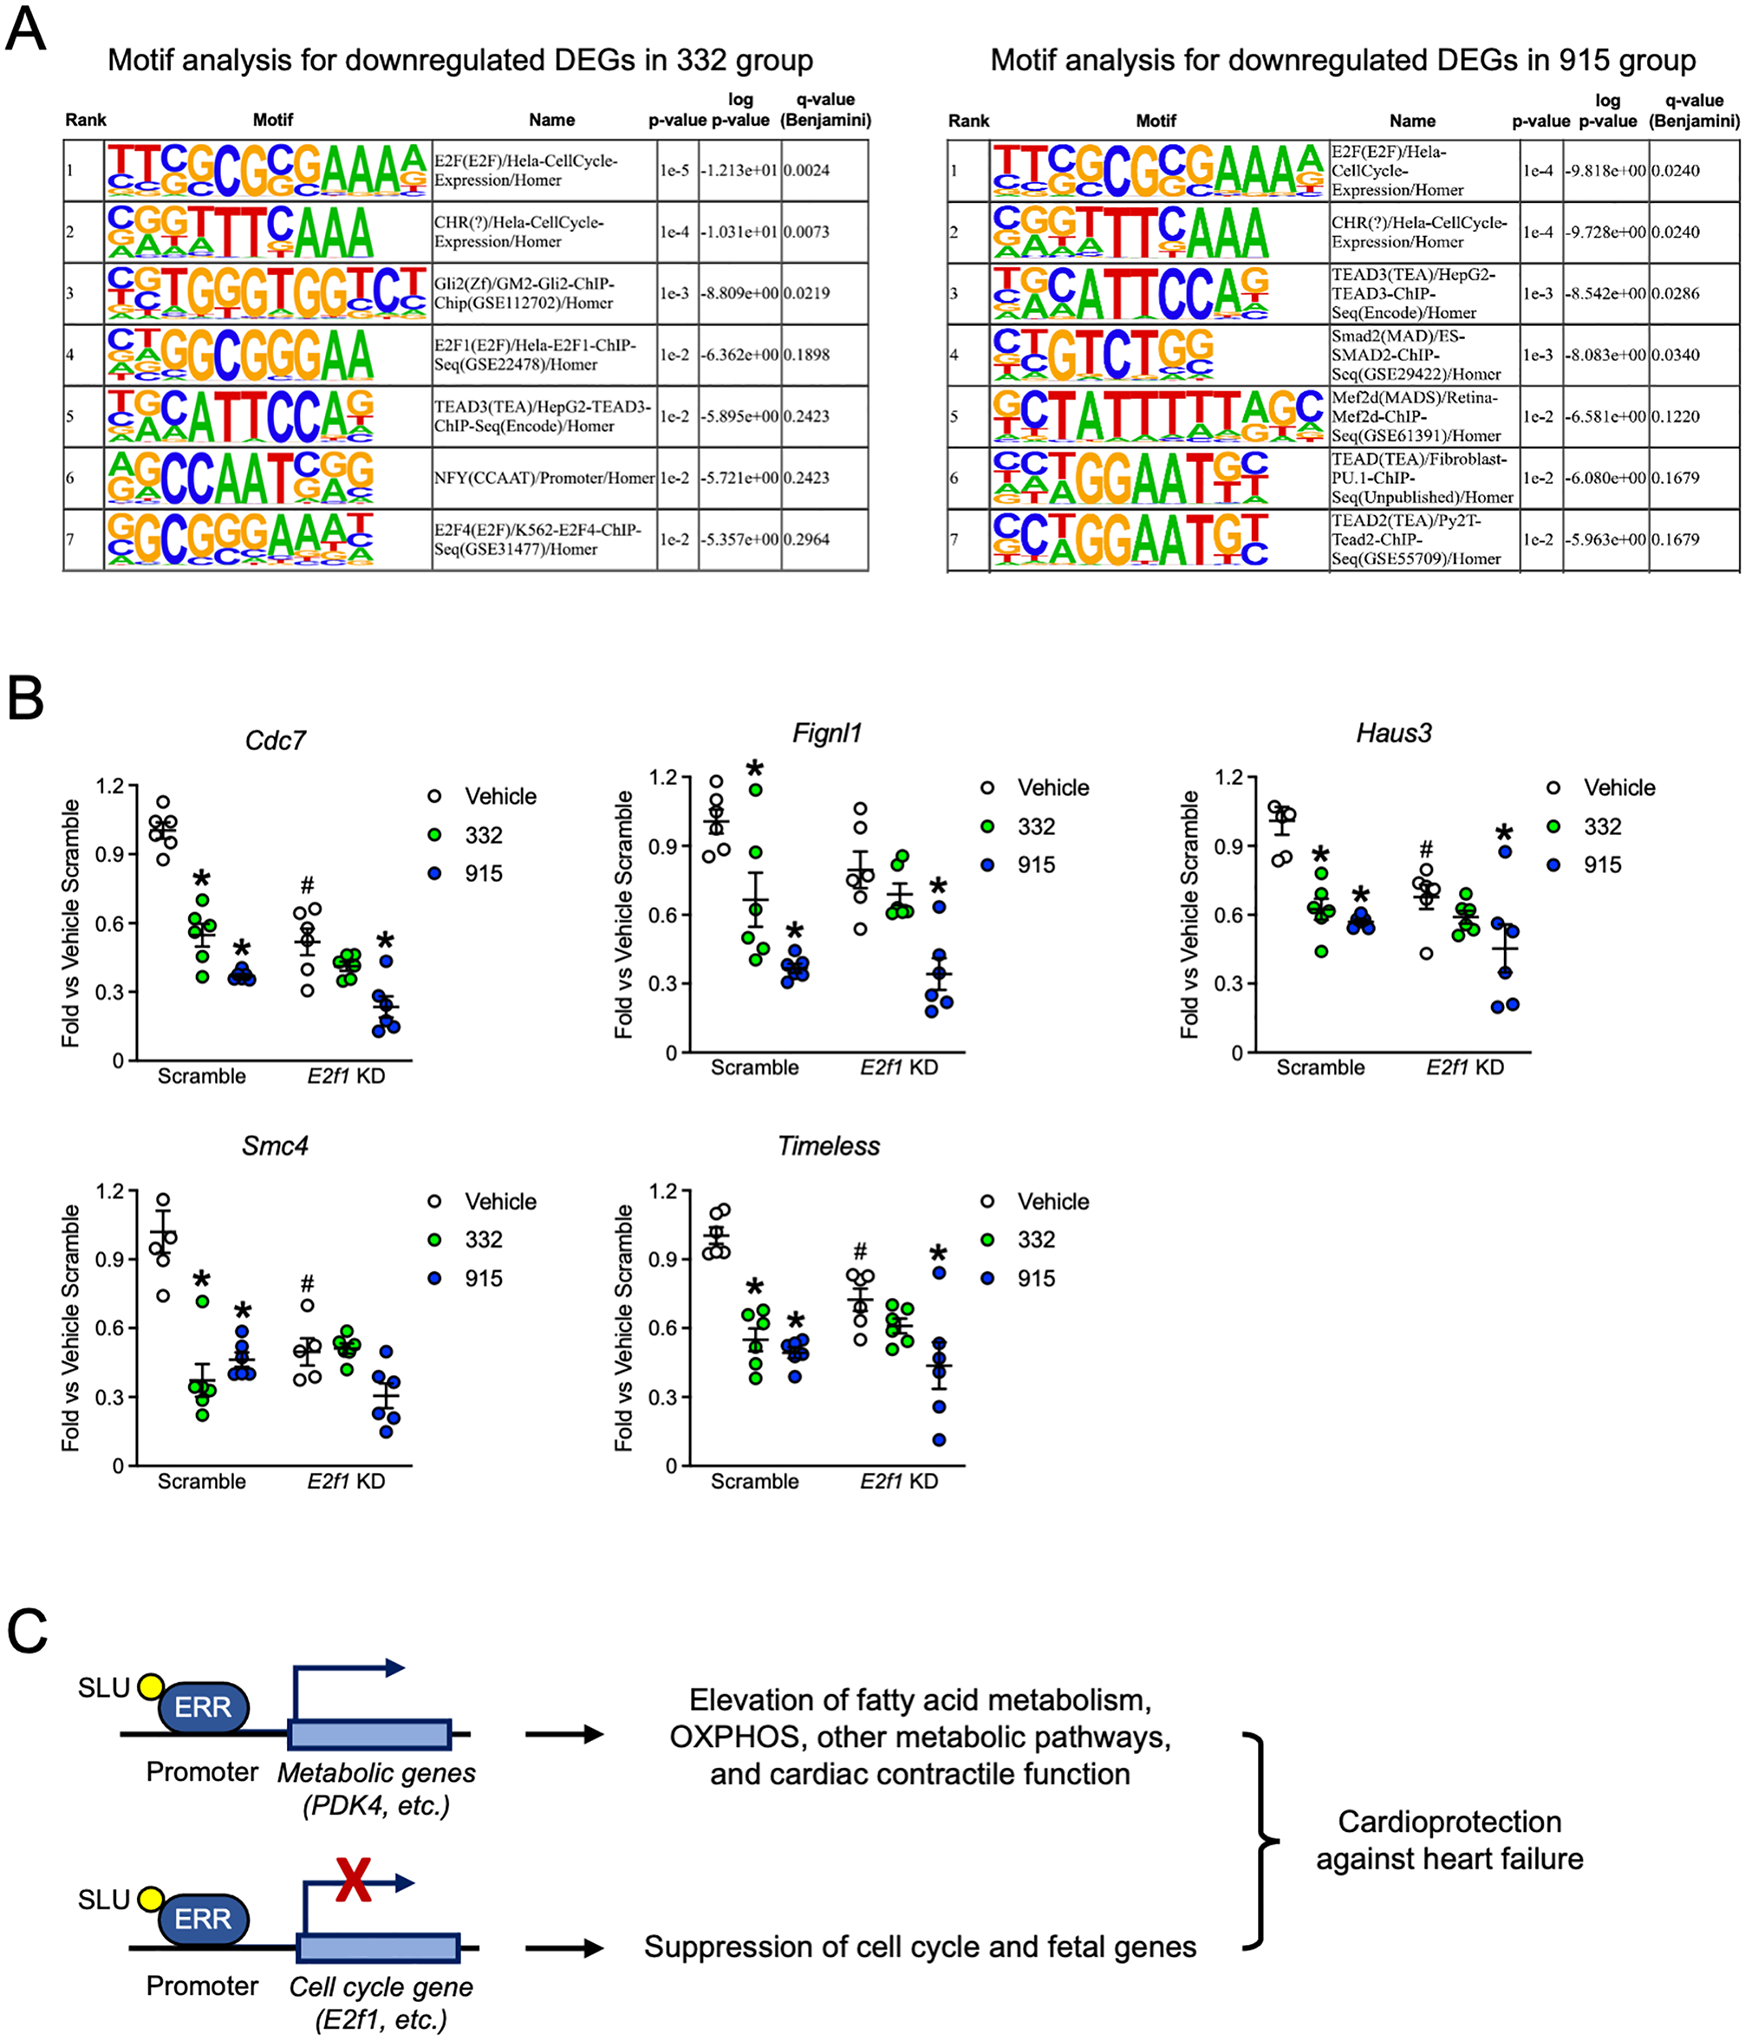
Results: Both SLU-PP-332 and SLU-PP-915 significantly improved ejection fraction, ameliorated fibrosis, and increased survival associated with pressure overload-induced HF without affecting cardiac hypertrophy. A broad spectrum of metabolic genes was transcriptionally activated by ERR agonists, particularly genes involved in fatty acid metabolism and mitochondrial function. Metabolomics analysis showed substantial normalization of metabolic profiles in fatty acid/lipid and tricarboxylic acid/oxidative phosphorylation metabolites in the mouse heart with 6-week pressure overload. ERR agonists increase mitochondria oxidative capacity and fatty acid use in vitro and in vivo. Using both in vitro and in vivo genetic dependency experiments, we show that ERRγ is the main mediator of ERR agonism-induced transcriptional regulation and cardioprotection and definitively demonstrated target specificity. ERR agonism also led to downregulation of cell cycle and development pathways, which was partially mediated by E2F1 in cardiomyocytes.

Conclusions: ERR agonists maintain oxidative metabolism, which confers cardiac protection against pressure overload-induced HF in vivo. Our results provide direct pharmacologic evidence supporting the further development of ERR agonists as novel HF therapeutics.

Keywords: cell cycle; heart failure; metabolism.


Conflict of interest statement

Disclosures Dr Zhang is a cofounder of and consultant for Pelagos Pharmaceuticals Inc. The other authors report no conflicts of interest.

Figures

Figure 1
Figure 1. ERR agonists attenuate cardiac dysfunction in pressure-overload model.
Eight-week-old mice were subjected to 27-gauge TAC or sham surgery and administered vehicle (Veh), SLU-PP-332 (332) or SLU-PP-915 (915) by IP injection for 6 weeks. (A) Ejection fraction (EF). (B) Stroke volumn (SV), (C) Cardiac output (CO). N=4–23. *: p<0.05, **: p<0.01, ***: p<0.001, ****: p<0.0001. (D) Survival curve. Data from Sham+332 and Sham+915 groups were pooled as Sham+SLU group. Data from TAC+332 and TAC+915 groups were pooled as TAC+SLU group. *: p<0.05 vs TAC+Veh group determined by log-rank (Mantel-Cox) test. (E) Measurement of cardiac fibrosis. Left panel, representative fibrosis staining images using Masson Trichrome stain. Scale bar indicates 200 μm. Right panel, quantification of fibrotic area. N=4–10, *: p<0.05. (F) Gene expression of Nppa and Nppb in mouse heart tissue. Expression levels were quantified by qPCR and normalized to Sham+Veh group. N=4–10, *: p<0.05. (G) Representative transmission electron microscopy images of heart tissue section obtained from apex region after 6 weeks’ experiment. Arrow indicates mitochondrial fragmentation in TAC+Vehicle group. Scale bar indicates 500 nm. (H) Quantification of mitochondrial gene copy number upon 332 treatment. Left panel, copy number of mt-Nd2 from mouse heart samples. N=4–6. A locus on mouse Chr6 was used as internal control. Right panel, copy number of mt-Nd2 from NRVMs. N=3. A locus on rat Chr4 was used as internal control. (I) Assessment of isolated mouse cardiac mitochondria respiratory function. N=8–12. Statistical analysis was performed using two-way ANOVA for data in (A-C), (E-F), and (I). Two-tailed Student’s t test was performed for data in the right panel in (H). Multiple comparison is corrected by Šídák method for two-way ANOVA, with α=0.05. Data are presented as mean ± SEM.
Figure 2
Figure 2. ERR agonists did not affect cardiac hypertrophy in vivo and in vitro.
(A-D) Eight-week-old mice were subjected to 27-gauge TAC or sham surgery and administered vehicle (Veh), SLU-PP-332 (332) or SLU-PP-915 (915) by IP injection for 6 weeks. (A) Left ventricular end-diastolic posterior wall thickness (LVPW;d). (B) LV mass index (LVMI) corrected by body weight. (C) Heart weight normalized by body weight. For panel (A-C) N=4–10, *:p<0.05, **: p<0.01, ***: p<0.001 vs Sham vehicle in each group. (D) Cardiomyocyte cross-sectional area measured by wheat germ agglutinin (WGA) staining. Left panel, representative images of cross-section with WGA staining for samples obtained after 6-week TAC. Scale bar indicates 200 μm. Right panel, quantification of cardiomyocyte cross-sectional area from the fluorescent images using imageJ. N=4–6. (E-I) NRVMs treated with/without 100μM phenylephrine (PE) for 24hr in the presence of vehicle, 10μM 332 or 10μM 915. (E) Size measurement of NRVMs. Left panel, representative images. Scale bar indicates 200 μm. Right panel, quantification of cell size from bright field images using imageJ. N=18–51. (F) Western blot analysis of ERK1/2 signaling. Left panel, representative western blot images showing the protein levels of phosph-ERK1/2 (p-ERK1/2) and total ERK1/2 from NRVM. GAPDH was used as the loading control. Right panel, ratio of p-ERK1/2 to total ERK levels quantified from the western blot images. N=3. (G-H) Quantitative RT-PCR of ERK-targeted gene Fos and Egr1. Expression level of Ppib was used as internal control. N=4. (I) Dual luciferase reporter assay for NFAT transcriptional activity in NRVMs. N=5–6. For panel E-I, *:p<0.05: vs untreated control within each group and #:p<0.05: vs vehicle group. Statistical analysis used two-way ANOVA for all the data except panel D. Statistical analysis was performed using 2-tailed Student’s t test for data in (D). Multiple comparison is corrected by Šídák method with α=0.05. Data are presented as mean ± SEM, except volin plot in (E) where solid line and dash line indicate median and quartile, respectively.
Figure 3
Figure 3. RNA sequencing revealed ERR agonists upregulate OXPHOS, fatty acid metabolic and cardiac contractile pathways, while downregulate cell cycle and organ developmental pathways in cardiomyocytes.
(A-D) RNA sequencing was performed on NRVMs treated with vehicle, 10μM 332, or 10μM 915 for 72hr. Differentially expressed genes (DEGs) with 1.5-fold difference versus vehicle group and adjusted p value<0.05 were included in the analysis. (A) Venn diagram comparing DEGs between NRVMs treated with 332 (green) and 915 group (purple). (B) KEGG pathway analysis of upregulated and downregulated DEGs in the 332 or 915 groups. FDR (false discovery rate) is shown in x-axis. (C) Comparasion between the NRVM DEGs and the previous datasets from ERRγ ChIP-seq targets (left) and DEGs in ERRγ overexpression (OE) in human iPSC-CMs (right). Blue or yellow protion indicates 1:1 human:rat homologs with or without overlaps. (D) GO analysis of upregulated (red) and downregulated (blue) DEGs overlapped with ERRγ ChIP-seq targets. (E-H) RNAsequencing using heart samples from Sham+Veh, Sham+332, TAC+Veh, and TAC+332 groups 6 weeks after surgery. (E) Principle component analysis. (F) Heat map of Z scores of normalized gene expression for DEG in pairwise comparison between TAC+Veh and TAC+332 groups. Dendrograms are hierarchical clustering among samples (left) and genes (top). (G) Enrichr pathway analysis for both upregulated (red) and downregulated (blue) DEGs between TAC+Veh (reference) and TAC+332 groups. (H) KEGG pathway analysis of upregulated and downregulated DEGs between CM Profile 3 and 4 identified through deconvolution of mouse heart bulk RNA-seq (see details in Figure S7). Pathway enrichment with p-value<0.05 was considered as statistically significant.
Figure 4
Figure 4. ERR agonism increased the oxidative metabolism in cardiomyocytes.
(A) Heatmap of metabolic-related DEGs commonly upregulated by both 332 and 915 in NRVM RNAseq. Genes involved in fatty acid/lipid metabolism were highlighted in bold. Genes with 1.5-fold increase upon 332 or 915 treatment vs vehicle group and adjusted p value<0.05 were included in the analysis. N=3. (B) 332-induced gene expression of Pdk4 in vitro and in vivo. Left panel, Pdk4 expression level in NRVMs treated with vehicle or 10μM 332 for 72hr. Right panel, Pdk4 expression level in mice treated with vehicle or 25mg/kg 332 twice a day for 10 days. Expression level of Ppib was used as internal control. N=4–9. Comparisons were made using a 2-tailed Student’s t test. Data are presented as mean ± SEM. (C-D) 6-week 915 treatment increased protein levels of PDK4 and FABP3 in vivo. In C, protein from isolated mouse cardiac mitochondria were used and VDAC was used as internal control, n=5. In D, whole heart lysate was used as internal control, n=6–7. Left panel, representative western blot images. Right panel, quantification with normalization to vehicle group. *:p<0.05 vs Veh. (E) Heatmap of DEG involved in oxidative phosphorylation (OXPHOS) in NRVM RNAseq. Genes with significant changes in expression levels (adjusted p-value<0.05) upon 332 or 915 treatment vs vehicle group were included in the analysis. N=3. (F) Metabolomics analysis obtained from mouse heart samples 6 weeks after TAC experiment. Numbers next to the pie chart indicate the number of metabolites that are decreased (blue) or increased (red) compared to the Sham group. N=4–8. (G-H) Measurement of oxygen consumption rate (OCR) of isolated adult mouse cardiomyocytes. In G, pyruvate was used as substrate to assess the OXPHOS function. Arrows indicate where drugs were injected. Error bars are not shown when smaller than the symbol size. N=16. In H, OCR change after injection of BSA-conjugated palmitate or BSA alone was measured to determine the FAO capacity. N=7–10 *:p<0.05. Comparisons were made using a 2-tailed Student’s t test for data in (B)-(D), using two-way ANOVA for (G) and (H). Multiple comparison is corrected by Šídák method with α=0.05. Data are presented as mean ± SEM.
Figure 5
Figure 5. The cardiac protective effect of ERR agonists is mainly mediated by cardiomyocyte ERRγ.
(A-C) NRVMs were transfected with scramble or ERR siRNA for 48 hr and treated with vehicle, 10μM 332, or 10μM 915 for 24hr. (A) Heatmap summarizing the effects of ERR isoform knockdown on ERR agonist-induced gene expressions. Gene expression level was quantified by qPCR and normalized to the vehicle scramble group. N=3–6. (B) RNA-seq analysis demonstrating the selectivity of 915. A total of 1115 915-induced DEGs (>1.5-fold change vs DMSO) were identified in NRVMs transfected with scramble siRNA. DEGs that are absent or present in NRVMs with ERRα/γ double knockdown are defined as ERRα/γ-dependent or -independent DEGs. The numer and portion of the dependent and independent DEGs were shown. (C) Gene ontology analysis of ERRα/γ-dependent DEGs. (D-E) 8-week-old WT or cardiac-specific ERRγ knockout (ERRγ cKO) mice were subjected to 27-gauge TAC and administered with vehicle (Veh) or 915 by IP injection for 6 weeks. (D) EF after 6-week TAC. N=4–10, *: p<0.05. (E) Measurement of cardiac fibrosis in WT or ERRγ cKO mice with 915 treatment. Left panel, representative image of Masson Trichrome staining. Scale bar indicates 200 μm. Right panel, quantification of cardiac fibrotic area in WT or ERRγ cKO mouse with TAC and administered with vehicle or 915 for 6 weeks. N=4–6, *: p<0.05. Statistical difference is determined by two-way ANOVA in (D) and one-way ANOVA in (E). Multiple comparison is corrected by Šídák method for two-way ANOVA or Dunnet method for one-way ANOVA, with α=0.05. Data are presented as mean ± SEM.
Figure 6
Figure 6. E2F1 is an important mediator for the downregulated DEGs upon ERR agonism in vitro.
(A) Motif analysis using HOMER for downregulated DEGs in both the 332 and 915 group from NRVM RNA-seq data. Top seven enriched motifs were shown in the Tables. (B) E2F1-dependent DEGs. N=6. Downregulated DEGs with predicted E2F1 cognate site and over 1.5-fold change in expression upon ERR agonism were selected and examined in the experiment. Statistical differences were determined by two-way ANOVA. Multiple comparison is corrected by Šídák method with α=0.05. Data are presented as mean ± SEM. (C) Proposed mechanism for ERR agonist SLU (332 or 915) to treat heart failure.

Similar articles

Cited by

References

    1. Murphy SP, Ibrahim NE and Januzzi JL, Jr. Heart Failure With Reduced Ejection Fraction: A Review. JAMA. 2020;324:488–504. - PubMed
    1. Heidenreich PA, Albert NM, Allen LA, Bluemke DA, Butler J, Fonarow GC, Ikonomidis JS, Khavjou O, Konstam MA, Maddox TM, Nichol G, Pham M, Pina IL, Trogdon JG, American Heart Association Advocacy Coordinating C, Council on Arteriosclerosis T, Vascular B, Council on Cardiovascular R, Intervention, Council on Clinical C, Council on E, Prevention and Stroke C. Forecasting the impact of heart failure in the United States: a policy statement from the American Heart Association. Circ Heart Fail. 2013;6:606–19. - PMC - PubMed
    1. Mazurek JA and Jessup M. Understanding Heart Failure. Heart Fail Clin. 2017;13:1–19. - PubMed
    1. Taylor CJ, Ordonez-Mena JM, Roalfe AK, Lay-Flurrie S, Jones NR, Marshall T and Hobbs FDR. Trends in survival after a diagnosis of heart failure in the United Kingdom 2000–2017: population based cohort study. BMJ. 2019;364:l223. - PMC - PubMed
    1. Stanley WC, Recchia FA and Lopaschuk GD. Myocardial substrate metabolism in the normal and failing heart. Physiol Rev. 2005;85:1093–129. - PubMed

Publication types