. 2024 Jan 11;52(1):300-315.
doi: 10.1093/nar/gkad1034.

An intronic RNA element modulates Factor VIII exon-16 splicing

Affiliations

An intronic RNA element modulates Factor VIII exon-16 splicing

Victor Tse et al. Nucleic Acids Res. .

Abstract

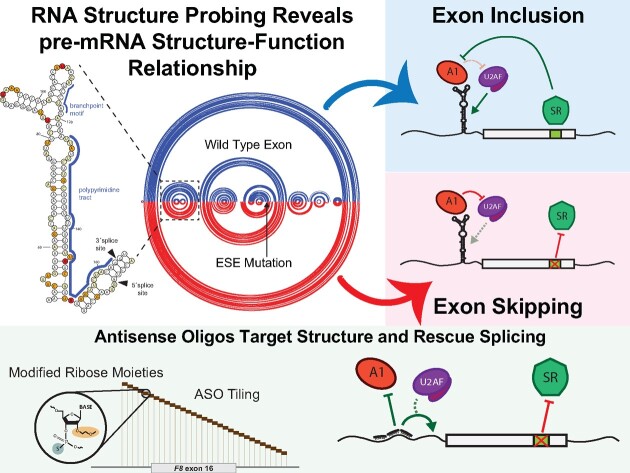
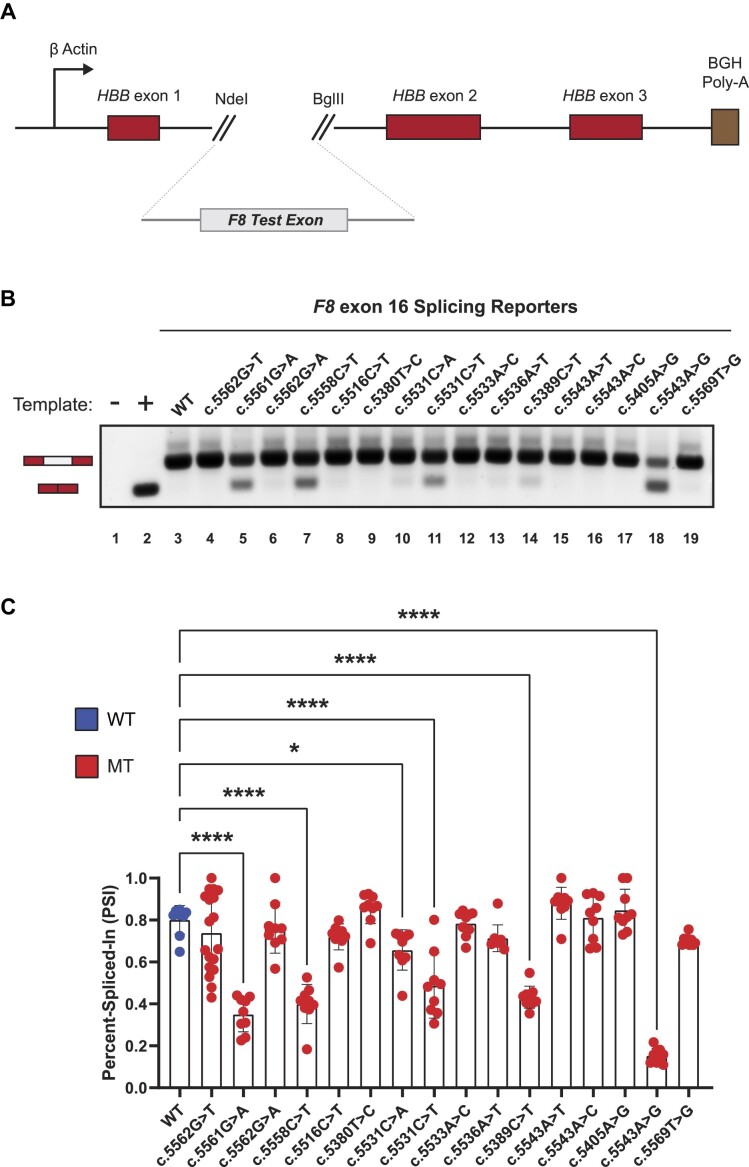
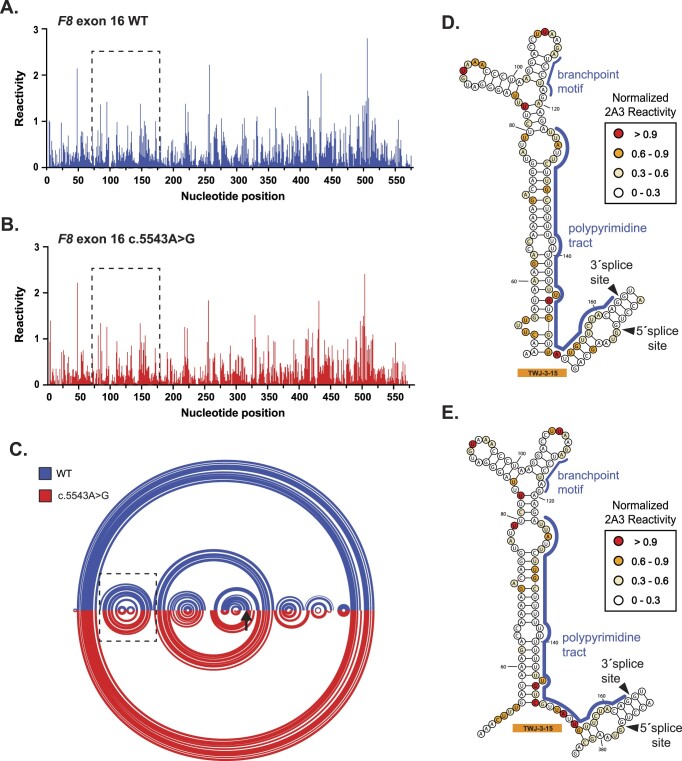
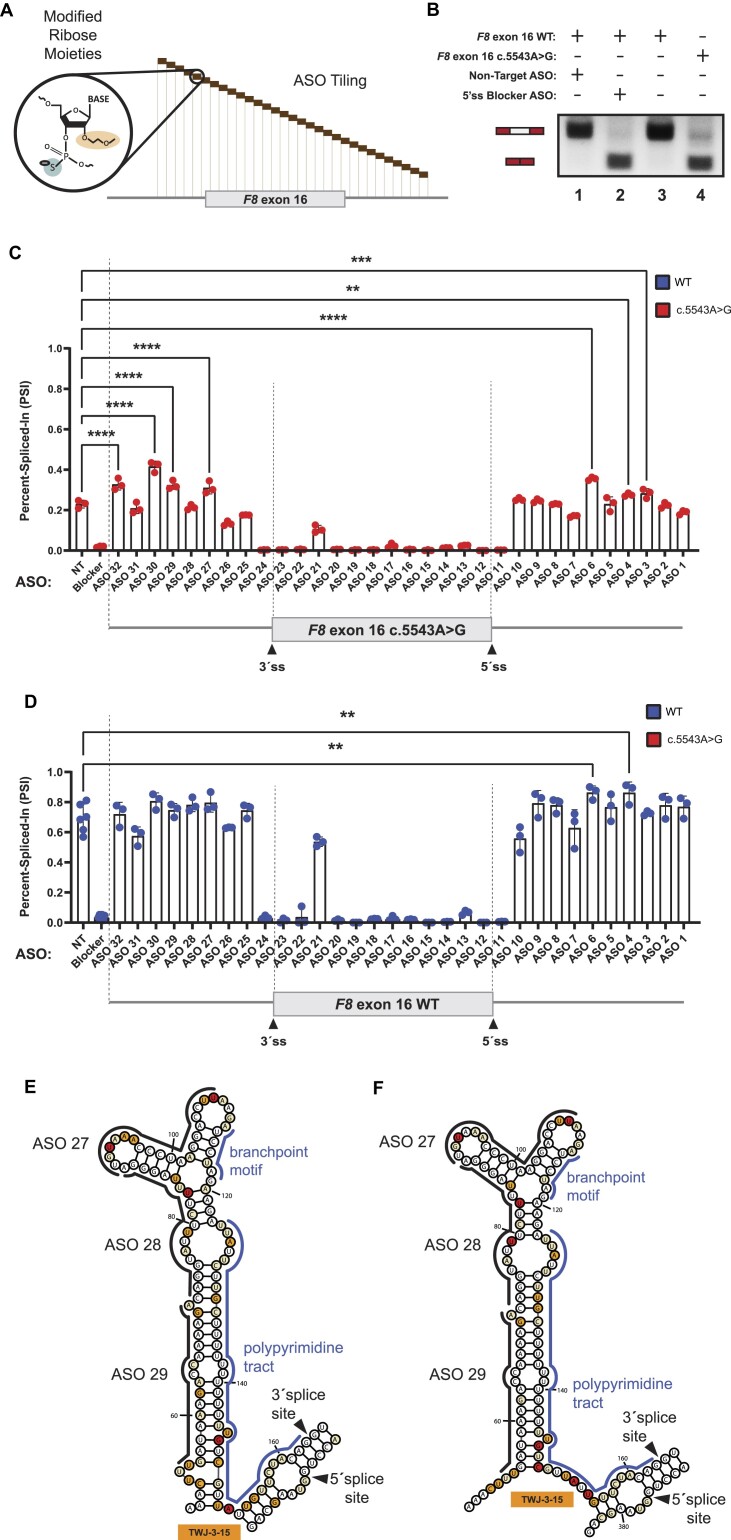
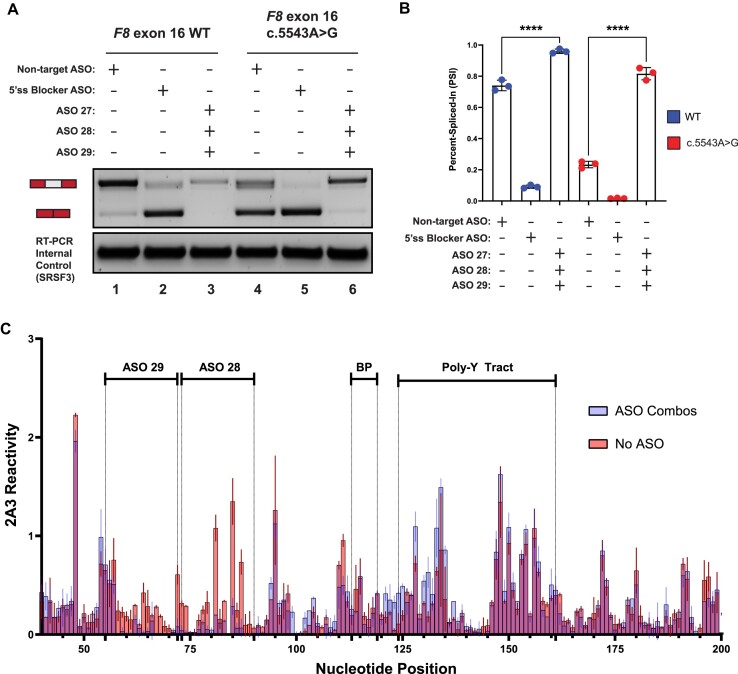
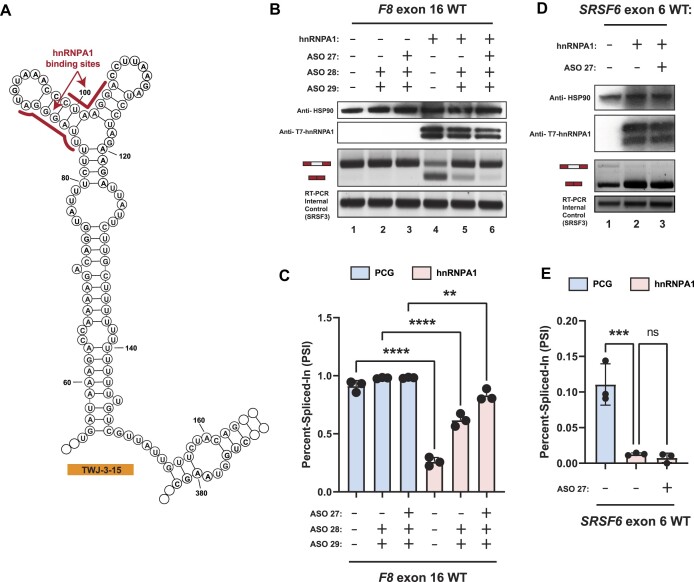
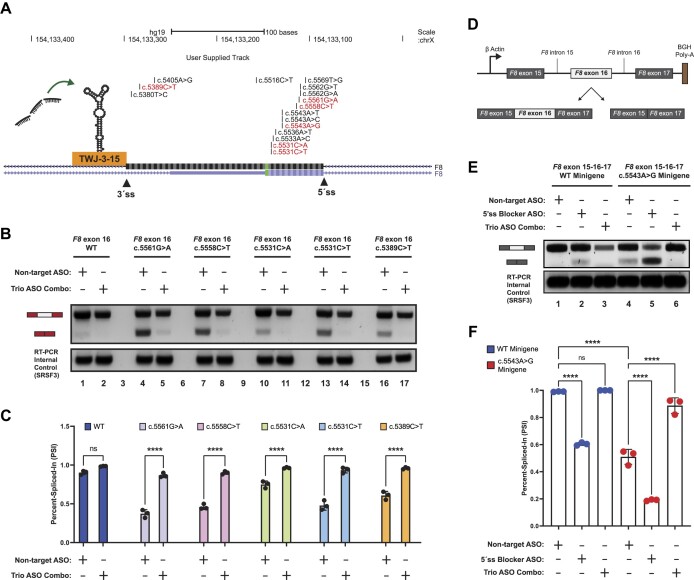
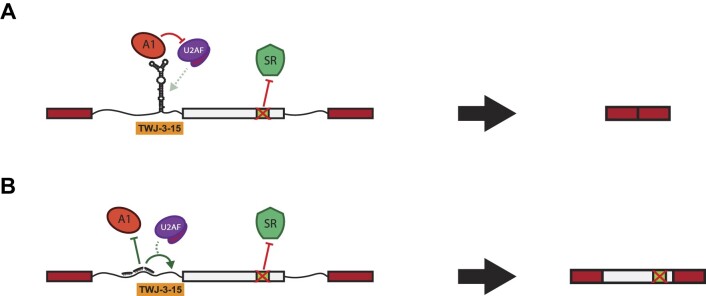
Pathogenic variants in the human Factor VIII (F8) gene cause Hemophilia A (HA). Here, we investigated the impact of 97 HA-causing single-nucleotide variants on the splicing of 11 exons from F8. For the majority of F8 exons, splicing was insensitive to the presence of HA-causing variants. However, splicing of several exons, including exon-16, was impacted by variants predicted to alter exonic splicing regulatory sequences. Using exon-16 as a model, we investigated the structure-function relationship of HA-causing variants on splicing. Intriguingly, RNA chemical probing analyses revealed a three-way junction structure at the 3'-end of intron-15 (TWJ-3-15) capable of sequestering the polypyrimidine tract. We discovered antisense oligonucleotides (ASOs) targeting TWJ-3-15 partially rescue splicing-deficient exon-16 variants by increasing accessibility of the polypyrimidine tract. The apical stem loop region of TWJ-3-15 also contains two hnRNPA1-dependent intronic splicing silencers (ISSs). ASOs blocking these ISSs also partially rescued splicing. When used in combination, ASOs targeting both the ISSs and the region sequestering the polypyrimidine tract, fully rescue pre-mRNA splicing of multiple HA-linked variants of exon-16. Together, our data reveal a putative RNA structure that sensitizes F8 exon-16 to aberrant splicing.


Figures

Graphical Abstract
Graphical Abstract
Figure 1.
Figure 1.
In vitro cell-based splicing reporter assays reveal F8 exon-16 as a highly fragile exon susceptible to pathogenic variant-induced aberrant splicing. (A) Schematic of the heterologous splicing reporter used to assess the impacts of variants on splicing. Each test exon and flanking intronic sequence of F8 gene was cloned between exon-1 and exon-2 of the HBB minigene. (B) A representative agarose RNA gel showing the effects on splicing by various HA-causing variants in a panel of F8 exon-16 splicing reporters. Controls include a no template reaction (lane 1) and a positive control for exon skipping (lane 2). (C) Quantification of various HA-causing variants on the splicing extent of F8 exon-16. Percent-spliced-in (PSI) refers to the ratio of test exon skipped to test exon included in mRNA. Statistical significance between comparisons is denoted by asterisks that represent P-values with the following range of significance: *P≤ 0.05, and ****P≤ 0.0001. Statistical significance was determined using analysis of variance (ANOVA), and Dunett’s post-hoc test. Each exon-16 splicing reporter context tested contains nine independent/biological replicates; only exon-16c.5562G>T contains 18 independent/biological replicates to assess variability.
Figure 2.
Figure 2.
SHAPE probing identifies a native RNA structure (TWJ-3–15) that is uniquely positioned at the 3′ss of F8 exon-16. (A,B) A normalized SHAPE reactivity plot for WT exon-16 (blue) and the exon-16c.5543A>G pathogenic variant (red), respectively. (C) Intramolecular base pairing interactions, constrained by normalized SHAPE reactivity are represented by arcs joining different regions of the transcript. Arc diagrams for WT exon-16 and exon-16c.5543A>G transcripts are depicted in blue and red, respectively. The broken box indicates the position of TWJ-3–15. The black arrow signifies the position of the c.5543A > G variant (D,E) SHAPE-driven secondary structure prediction of TWJ-3–15 depicted in its 2D state for WT exon-16 and exon-16c.5543A>G transcripts, respectively. Core splicing signals are annotated within the structure. All SHAPE probing data (N = 2) presented were generated in vitro using the SHAPE reagent 2A3, and all subsequent data analysis was performed in RNA Framework. All nucleotide positions numbering shown are based on the IVT RNA template used for SHAPE probing, from the 5′ to 3′ orientation.
Figure 3.
Figure 3.
ASO walk reveals splice-modulating ASOs for the highly splicing-sensitive exon-16c.5543A>G variant. (A) A mock schematic of an ASO walk. Each ASO used in our walks are 18 nucleotides in length and are designed using ribose sugars that are modified with a 2′-methoxyethyl group (2′-MOE, highlighted in light orange), and the phosphate backbone is modified to a phosphorothioate backbone (highlighted in light blue). Each 18-mer ASO is contiguous by design, tiling across exon-16 and its flanking introns with no overlaps between each ASO. (B) Proof-of-concept demonstrating how our ASOs are expected to work in the ASO walk experiments. As shown in the annotative matrix above a representative agarose gel, the first two controls consist of our 5′ss blocker ASO (positive control) and our non-targeting ASO (negative control) being co-transfected with our WT exon-16 splicing reporter to demonstrate that our designed ASOs can modulate splicing. The last two controls consist of our WT exon-16 and exon-16c.5543A>G splicing reporters without ASOs co-transfected to illustrate the typical splicing ratios we may expect to see from their splicing. Expected mRNA isoforms including or excluding the test exon are also annotated to the left of the agarose gel. (C) and (D) show our ASO walk data for the exon-16c.5543A>G variant and WT exon-16, respectively. Data corresponding to the exon-16c.5543A>G variant is annotated by a red color whereas the WT is annotated by a blue color. ASO walk results for both (C) and (D) are quantified using the PSI ratio. Statistical significance between comparisons are denoted by asterisks that represent P-values with the following range of significance: ns, P> 0.05, **P≤ 0.01, ***P≤ 0.001, and ****P≤ 0.0001. Statistical significance was determined using analysis of variance (ANOVA), and Dunett’s post-hoc test. Each exon-16 splicing reporter context and condition tested contains three independent/biological replicates. A schematic model of exon-16 and its flanking introns are shown at the bottom of each plot to illustrate relative positions of ASOs. (E) and (F) respectively depict SHAPE-driven secondary structure predictions of TWJ-3–15 for WT exon-16 and exon-16c.5543A>G, where each (E) and (F) show where promising ASOs are hybridizing to within the structure. The sequence is numbered according to the nucleotide positions of the heterologous splicing reporter, from the 5′ to 3′ orientation.
Figure 4.
Figure 4.
A combination of ASOs targeting TWJ-3–15 can rescue splicing of the highly splicing-sensitive exon-16c.5543A>G variant by increasing 3′ss accessibility. (A) A representative agarose gel depicting the results from our in vitro cell-based splicing assays testing duo and trio ASO combinations’ ability to modulate reporter splicing (upper panel). The lower panel depicts an internal control corresponding to the SRSF3 mRNA (lower panel). Each splicing assay condition is annotated as shown in the matrix above the gel. Expected mRNA isoforms including or excluding the test exon are also annotated to the left of the agarose gel. (B) A plot quantifying the results from (A) using the PSI ratio. The WT context is annotated by a blue color whereas the exon-16c.5543A>G pathogenic variant is annotated by a red color. The same annotative matrix seen in (A) is used under the plot to label each ASO condition tested for each context. Statistical significance between comparisons are denoted by asterisks that represent P-values with the following range of significance: ns, P> 0.05, and ****P≤ 0.0001. Statistical significance was determined using analysis of variance (ANOVA) and Dunett’s post-hoc test. Each exon-16 splicing reporter context and condition tested contains three independent/biological replicates. (C) An overlay plot comparing normalized 2A3 reactivities between two distinct SHAPE probing conditions used to probe the exon-16c.5543A>G variant. One SHAPE condition probes exon-16c.5543A>G with ASOs present (annotated light blue), and the other condition probes exon-16c.5543A>G without ASOs present (annotated light red). Admixing of colors (indicated by purple hue) where this is indistinguishable overlap represents similar SHAPE reactivity values between the two probing conditions at that nucleotide position. The nucleotide positions where the ASOs bind, in addition to important splicing signals, are annotated in the plot. All SHAPE probing data presented were generated in vitro using the SHAPE reagent 2A3, and all subsequent data analysis was performed in RNA Framework. The sequence is numbered according to the nucleotide positions of the heterologous splicing reporter, from the 5′ to 3′ orientation.
Figure 5.
Figure 5.
hnRNPA1 cooperates with TWJ-3–15 to amplify inhibitory effects at the 3′ss of F8 exon-16. (A) Secondary structure model of TWJ-3–15 showing predicted hnRNPA1 binding motifs underscored in red. The sequence is numbered according to the nucleotide positions of the heterologous splicing reporter, from the 5′ to 3′ orientation. (B) Representative Western blot and agarose gel depicting results from our hnRNPA1-ASO competition assay. Upper two panels depict western blots for HSP90 and T7-epitope tagged hnRNPA1, respectively. Lower two panels depict the HBB splicing assay and the SRSF3 internal control for the RT-PCR reaction, respectively. Each condition tested in the assay is annotated as shown in the matrix above the gel. (C) A plot quantifying the results from (B) using the PSI ratio. Co-transfection of the WT exon-16 splicing reporter with either the empty expression vector (PCG) or the hnRNPA1 expression vector is indicated by a light blue or light red color, respectively. The same annotative matrix seen in (B) is used under the plot to label each ASO condition tested for each context. (D) Representative Western blot and agarose gel electrophoresis depicting results from our SRSF6 splicing assay. Each condition tested in the assay is annotated as shown in the matrix above the gel. (E) A plot quantifying the results from (D) using the PSI ratio. Co-transfection of the SRSF6 exon 6 splicing reporter with either the empty expression vector (PCG) or the hnRNPA1 expression vector is indicated by a light blue or light red color, respectively. The same annotative matrix seen in (D) is used under the plot to label each ASO condition tested for each context. Epitopes targeted by specific antibodies in the western blots are indicated to the left of their respective blots. Expected mRNA isoforms including or excluding the test exon are also annotated to the left of the agarose gel. Statistical significance between comparisons are denoted by asterisks that represent P-values with the following range of significance: ns, P> 0.05, **P≤ 0.01, ***P≤ 0.001, and ****P≤ 0.0001. Statistical significance was determined using analysis of variance (ANOVA), and Dunett's post-hoc test. Each exon-16 splicing reporter context and condition tested contains three independent/biological replicates.
Figure 6.
Figure 6.
A combination of ASOs targeting TWJ-3–15 in a heterologous and endogenous context can rescue splicing for a broad array of HA-associated variants of exon-16 by increasing 3′ss accessibility and blocking hnRNPA1 binding. (A) A UCSC Genome Browser screenshot depicting the F8 exon-16 locus and the positions of HA-causing variants tested in this study. Pathogenic variants demonstrated to be splicing-sensitive from our assays are shown in red, whereas non-sensitive variants are shown in black. The 3′ and 5′ splice sites are annotated in addition to TWJ-3–15. Successful ASOs targeting TWJ-3–15. (B) A representative agarose gel depicting the results from our cell-based splicing assays testing the trio ASO combinations’ ability to rescue splicing of other HA-linked splicing-sensitive exon-16 variants (upper panel). The SRSF3 internal control for the RT-PCR reaction is also shown (lower panel). Each splicing assay condition included in this specific assay is annotated as shown in the matrix above the gel. Expected mRNA isoforms including or excluding the test exon are also annotated to the left of the agarose gel. (C) A plot quantifying the results from (B) using the PSI ratio. Each sequence context tested (WT or pathogenic variant) is annotated by a distinct color. The same annotative matrix seen in (B) is used under the plot to label each ASO condition tested for each context. (D) A schematic depicting the F8 exon-16 minigene splicing reporter to validate aberrant splicing defects in an endogenous context. F8 exon-16, along with its neighboring introns and exons as annotated, are cloned in between a strong promoter and polyadenylation signal. Expected isoforms generated from the splicing reporter are also shown and annotated. (E) A representative agarose gel depicting the results from our exon-16 minigene splicing assays validating aberrant splicing and trio ASO rescue effects in an endogenous context. Each assay condition included in this experiment is annotated as shown in the matrix above the gel. Expected mRNA isoforms including or excluding exon-16 are also annotated to the left of the agarose gel. (F) A plot quantifying the results from (E) using the PSI ratio. Each sequence context tested (WT minigene or exon-16c.5543A>G minigene) is annotated by a distinct color. The same annotative matrix seen in (E) is used under the plot to label each ASO condition tested for each context. Statistical significance between comparisons are denoted by asterisks that represent P-values with the following range of significance: ns, P> 0.05, and ****P≤ 0.0001. Statistical significance was determined using analysis of variance (ANOVA), and Dunett’s post-hoc test. Each exon-16 splicing reporter context and condition tested contains three independent/biological replicates.
Figure 7.
Figure 7.
The loss of a critical ESE in F8 exon-16 is hypothesized to amplify the inhibitory nature of TWJ-3–15 to alter exon definition and splicing fidelity. The following models depict experimentally-driven mechanisms on how F8 exon-16 (in light gray) may be aberrantly spliced and rescued as determined in this study. (A) A schematic depicting the loss of a critical ESE in exon-16 due to the A > G pathogenic variant in the exon-16c.5543A>G variant. Losing the ESE diminishes the ability to recruit a positive splicing factor that likely regulates TWJ-3–15 and hnRNPA1 antagonism at the 3′ss of F8 exon-16, leading to decreased 3′ss strength. (B) A schematic depicting the trio ASO combinations’ ability to rescue splicing of exon-16c.5543A>G by destabilizing TWJ-3–15, and preventing the recruitment of hnRNPA1 to the 3′ss. Collectively, our data-supported model indicates that the trio ASOs block the recruitment of a negative splicing factor and increases the accessibility of the 3′ss to the splicing machinery. TWJ-3–15 is annotated by a simplified depiction of the ‘Y-shaped’ RNA secondary structure at the 3′ss of exon-16. RBPs binding to TWJ-3–15 and this region such as hnRNPA1 and U2AF are respectively annotated. The predicted ESE is annotated in light green within exon-16, and its binding partner, presumably an RBP like SR proteins that are known to enhance splicing, is depicted as well.

Similar articles

Cited by

References

    1. Breathnach R., Benoist C., O’Hare K., Gannon F., Chambon P.. Ovalbumin gene: evidence for a leader sequence in mRNA and DNA sequences at the exon-intron boundaries. Proc. Natl. Acad. Sci. USA. 1978; 75:4853–4857. - PMC - PubMed
    1. Chow L.T., Gelinas R.E., Broker T.R., Roberts R.J.. An amazing sequence arrangement at the 5’ ends of adenovirus 2 messenger RNA. Cell. 1977; 12:1–8. - PubMed
    1. Berget S.M., Moore C., Sharp P.A.. Spliced segments at the 5′ terminus of adenovirus 2 late mRNA. Proc. Natl. Acad. Sci. USA. 1977; 74:3171–3175. - PMC - PubMed
    1. Konarska M.M., Sharp P.A.. Interactions between small nuclear ribonucleoprotein particles in formation of spliceosomes. Cell. 1987; 49:763–774. - PubMed
    1. Kastner B., Will C.L., Stark H., Lührmann R.. Structural insights into nuclear pre-mRNA splicing in higher eukaryotes. Cold Spring Harb. Perspect. Biol. 2019; 11:10.1101/cshperspect.a032417. - DOI - PMC - PubMed