. 2023 Dec 21;97(12):e0099323.
doi: 10.1128/jvi.00993-23. Epub 2023 Nov 14.

Adenovirus E1A binding to DCAF10 targets proteasomal degradation of RUVBL1/2 AAA+ ATPases required for quaternary assembly of multiprotein machines, innate immunity, and responses to metabolic stress

Affiliations

Adenovirus E1A binding to DCAF10 targets proteasomal degradation of RUVBL1/2 AAA+ ATPases required for quaternary assembly of multiprotein machines, innate immunity, and responses to metabolic stress

Nathan R Zemke et al. J Virol. .

Abstract

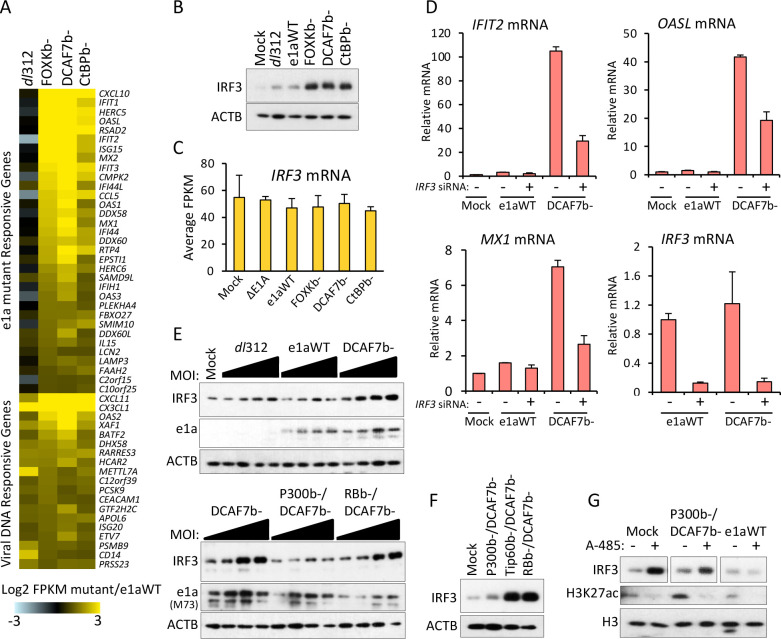
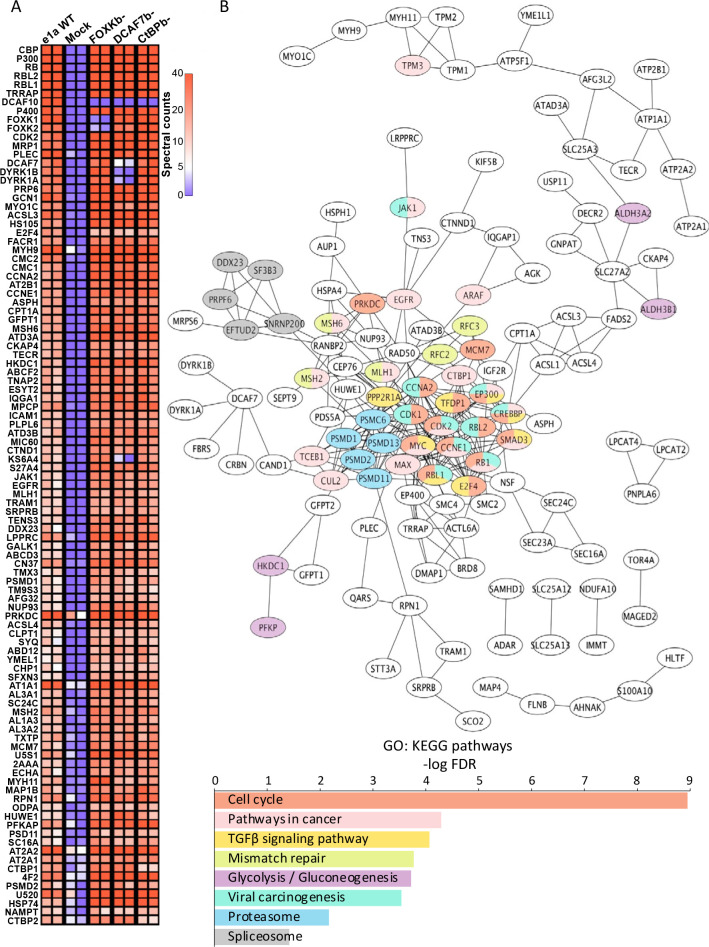
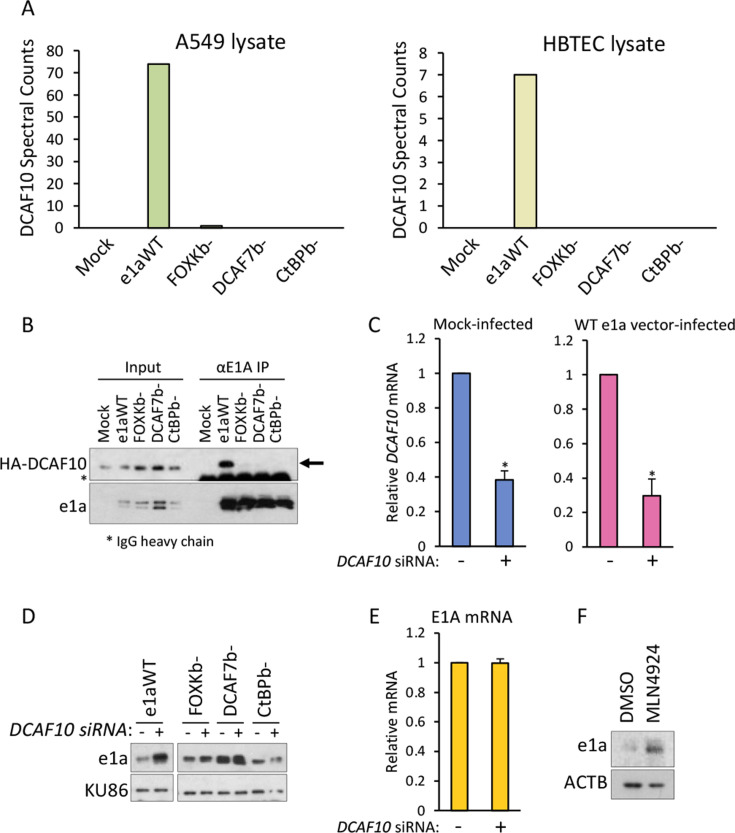
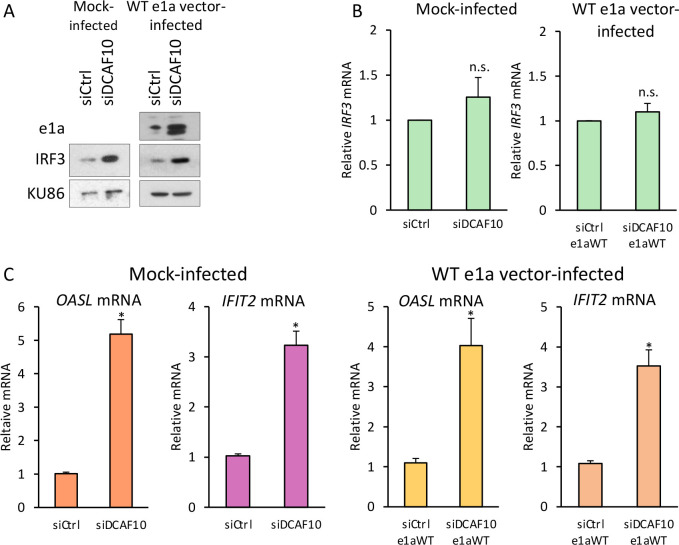
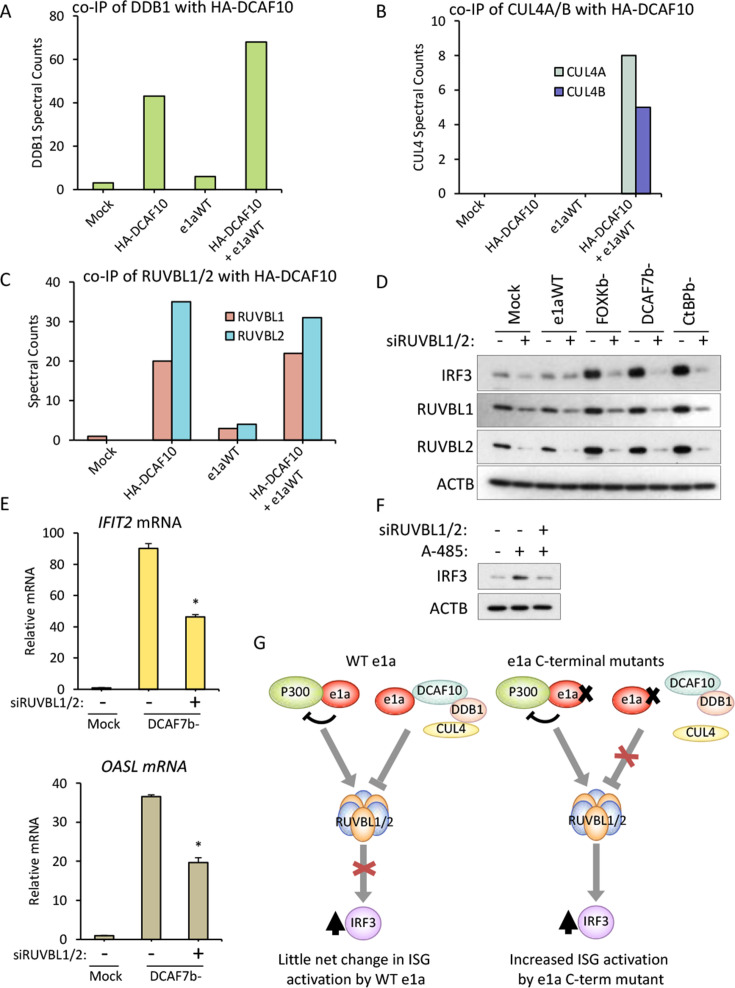
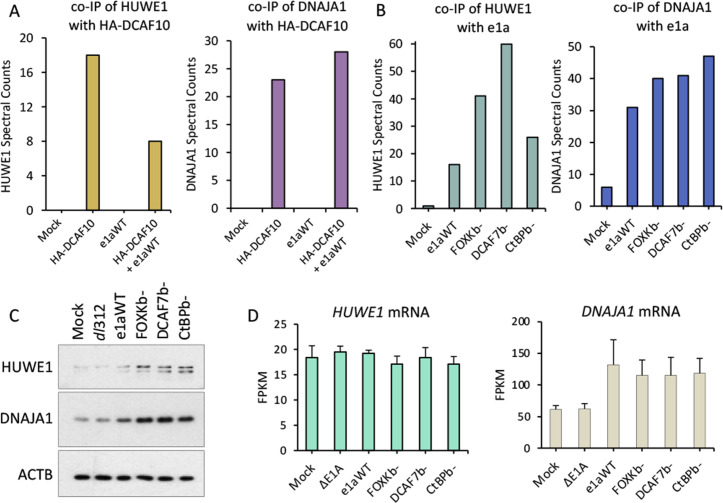
Inactivation of EP300/CREBB paralogous cellular lysine acetyltransferases (KATs) during the early phase of infection is a consistent feature of DNA viruses. The cell responds by stabilizing transcription factor IRF3 which activates transcription of scores of interferon-stimulated genes (ISGs), inhibiting viral replication. Human respiratory adenoviruses counter this by assembling a CUL4-based ubiquitin ligase complex that polyubiquitinylates RUVBL1 and 2 inducing their proteasomal degradation. This inhibits accumulation of active IRF3 and the expression of anti-viral ISGs, allowing replication of the respiratory HAdVs in the face of inhibition of EP300/CBEBBP KAT activity by the N-terminal region of E1A.

Keywords: CBP; CRL4; DCAF10; E1A; IRF3; P300; adenovirus; innate immunity; virology.


Conflict of interest statement

The authors declare no conflict of interest.

Figures

Fig 1
Fig 1
e1a inhibition of E300/CBP lysine-acetyl transferase activity induces IRF3 stabilization. (A) Heatmap displaying changes in RNA-seq FPKM of 52 host genes In G0-arrested primary HBTECs that are activated by infection with the e1a C-terminal mutant expression vectors compared to cells infected with the e1aWT vector. Cluster 1 = e1 a C-terminal mutant responsive genes activated >5-fold by the expression of the e1a C-terminal mutants, but <2-fold by infection with the E1A deletion mutant dl312 (35). Cluster 2 = genes activated >2-fold by the expression of the e1a C-terminal mutants and by infection with dl312. (B) Western blots of HBTECs 24 hpi with the Ad5 vectors indicated at the top. (C) qRT-PCR with RNA extracted from HBTECs 24 hpi with Ad5 vectors indicated at the top. (D) qRT-PCR with RNA from HBTECs transfected for 2 days with the indicated siRNAs and then infected with Ad5 vectors indicated at the top for an additional 24 h. (E) Western blots of HBTECs infected with the indicated vectors at increasing MOI: 20, 60, 100, 140. (F) Western blots of protein isolated 24 hpi with HAdV-C5 vectors expressing the e1a mutants indicated at the top. (G) Western blots of protein from HBTECs infected for 12 h with vectors expressing the indicated double e1a mutants, followed by the addition of DMSO or 10 µM A485 for an additional 12 h (averages of three experimental replicates + SD). In D and G, “−” indicates results from cells transfected with the negative control siRNA (siCtrl).
Fig 2
Fig 2
e1a interactome. (A) Heatmap displaying values for spectral counts of peptides from proteins detected by mass spec from M58 (anti-e1a) IPs. Values for duplicate mass spec runs are represented in adjacent columns. The heatmap is limited to proteins with an average of 10 spectral counts or higher between duplicates and ≥5-fold enrichment of WT e1a over mock. (B) Cytoscape protein-protein interaction map for 191 proteins that were enriched for binding to WT e1a and at least two e1a C-terminal mutants >5-fold over mock. Colors refer to the gene ontology shown below. Below, select enriched KEGG pathways gene ontologies for proteins represented in the Cytoscape protein-protein interaction network.
Fig 3
Fig 3
WT e1a binds DCAF10, decreasing e1a stability, but e1a mutants in the C-terminal conserved regions are not destabilized. (A) Spectral counts for DCAF10 mapped peptides from anti-e1a (M58) IP mass spec from A549 (left) and HBTEC (right) 24 hpi with vectors for WT or C-terminal mutant e1as as indicated at the bottom. (B) Western blots for HA-DCAF10 (upper panel) and e1a (lower panel) in input cell extract (left lanes) and IPed proteins (right lanes) following M58 (anti-e1a) IP of protein from A549 cells 24 hpi with vectors for WT e1a or the indicated e1a C-terminal mutants. (C) qRT-PCR with cDNA prepared from HBTECs transfected with control or anti-siRNA for 2 days and then mock-infected (left) or infected with the WT e1a vector (right). (D) Western blots with protein from HBTECs transfected for 2 days with control or anti-DCAF10 siRNA and then infected for 24 h with the vectors for WT or C-terminal mutant e1as indicated at the top. (E) qRT-PCR for E1A mRNA with cDNA prepared from HBTECs transfected for 2 days with control (−) or anti-DCAF10 siRNA (+) and then infected with the e1a WT vector for 24 h. (F) Western blots with protein from HBTECs infected with the e1a WT vector for 24 h and then treated for 6 h with control DMSO or 20 µM MLN4924. In C, D, and E, “–” indicates negative control siRNA (siCtrl). In C and E, data represent averages of three experimental replicates + SD.
Fig 4
Fig 4
DCAF10 destabilizes IRF3 and inhibits ISG activation. (A) Western blots of protein from HBTECs transfected with control or DCAF10 targeting siRNAs for 2 days, followed by mock-infection or infection with the WT e1a expression vector for 24 h. (B) qRT-PCR with RNA extracted from HBTECs transfected with control or DCAF10 siRNA for 2 days and then 24 h post mock-infection (left) or 24 hpi with the Ad5 vector expressing WT e1a (right). (C) qRT-PCR with RNA extracted from HBTECs treated as in (B). (B, C) Data represent averages of three experimental replicates + SD. “*” indicates P < 0.01.
Fig 5
Fig 5
e1a C-terminal mutant stabilization of IRF3 requires RUVBL1/2. Spectral counts of (A) DDB1, (B) RUVBL1/2, (C) CUL4A/B in anti-HA IPs from cells expressing HA-DCAF10. (D) Western blots for the proteins indicated at the left from HBTECs treated for 2 days with control siRNA (−) or siRNAs for RUVBL1 and 2 (+) and then mock-infected or infected with the vectors indicated at the top for 24 h. (E) qRT-PCR of IFIT2 and OASL mRNA from HBTECs treated as in (D). Averages of three experimental replicates + SD. “*” indicates P < 0.01 for the difference between control siRNA and RUVBL1/2 siRNA-transfected HBTECs. (F) Western blots for IRF3 or ACTB from HBTECs transfected with control siRNA (−) or siRNAs for RUVBL1/2 (+) for 2 days then treated for 12 h with DMSO or 10 µM A485. (G) Model accounting for the increase in IRF3 protein and ISG activation by the expression of the e1a C-terminal mutants.
Fig 6
Fig 6
e1a-bound proteins HUWE1 and DNAJA1 accumulate when e1a cannot bind DCAF10. (A) Spectral counts for HUWE1 (left) and DNAJA1 (right) peptides from HA-DCAF10 (anti-HA) IP mass spec from A549 cells 24 hpi. (B) Spectral counts for HUWE1 (left) and DNAJA1 (right) peptides from M58 (anti-e1a) IP mass spec from A549 cells 24 hpi. (C) Western blots with protein from HBTECs 24 hpi with the indicated Ad5 vectors. (D) FPKM of HUWE1 (left) and DNAJA1 (right) from RNA-seq of 24 h-infected HBTECs. Data represent averages of three experimental replicates + SD.

Similar articles

References

    1. Reich N, Pine R, Levy D, Darnell JE. 1988. Transcription of interferon-stimulated genes is induced by adenovirus particles but is suppressed by E1A gene products. J Virol 62:114–119. doi:10.1128/JVI.62.1.114-119.1988 - DOI - PMC - PubMed
    1. Zhao H, Granberg F, Elfineh L, Pettersson U, Svensson C. 2003. Strategic attack on host cell gene expression during adenovirus infection. J Virol 77:11006–11015. doi:10.1128/jvi.77.20.11006-11015.2003 - DOI - PMC - PubMed
    1. Montell C, Courtois G, Eng C, Berk A. 1984. Complete transformation by adenovirus 2 requires both E1A proteins. Cell 36:951–961. doi:10.1016/0092-8674(84)90045-x - DOI - PubMed
    1. Spindler KR, Eng CY, Berk AJ. 1985. An adenovirus early region 1A protein is required for maximal viral DNA replication in growth-arrested human cells. J Virol 53:742–750. doi:10.1128/JVI.53.3.742-750.1985 - DOI - PMC - PubMed
    1. Stabel S, Argos P, Philipson L. 1985. The release of growth arrest by microinjection of adenovirus E1A DNA. EMBO J 4:2329–2336. doi:10.1002/j.1460-2075.1985.tb03934.x - DOI - PMC - PubMed

MeSH terms