. 2024 Jan 5;52(D1):D513-D521.
doi: 10.1093/nar/gkad1020.

OMA orthology in 2024: improved prokaryote coverage, ancestral and extant GO enrichment, a revamped synteny viewer and more in the OMA Ecosystem

Affiliations

OMA orthology in 2024: improved prokaryote coverage, ancestral and extant GO enrichment, a revamped synteny viewer and more in the OMA Ecosystem

Adrian M Altenhoff et al. Nucleic Acids Res. .

Abstract

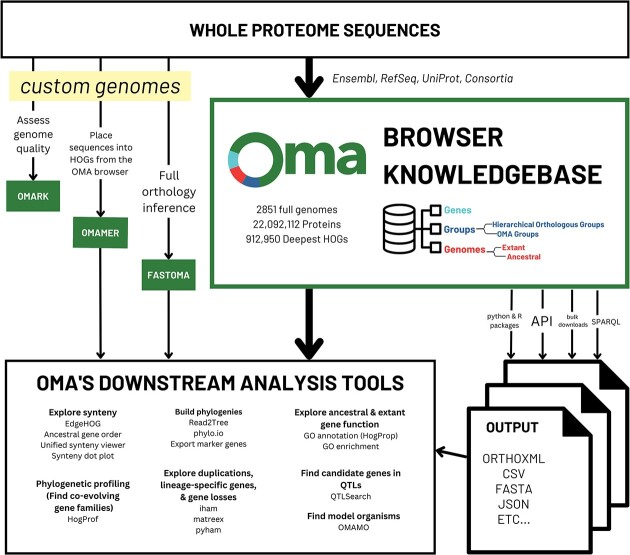
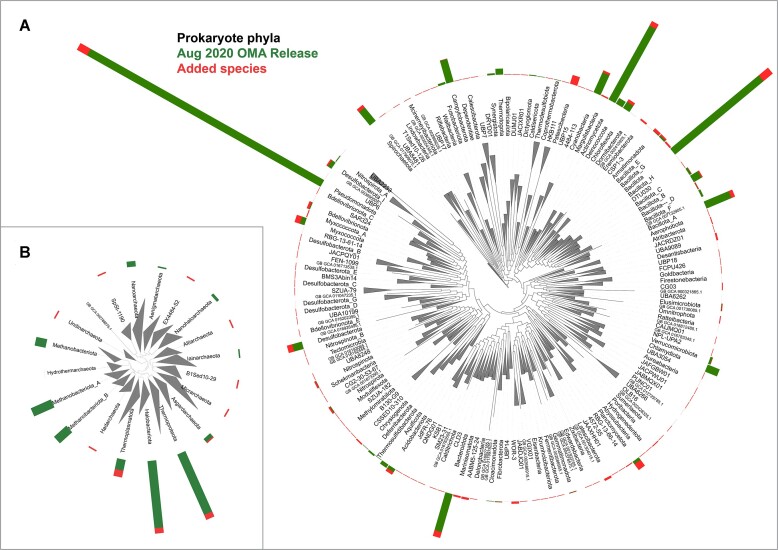
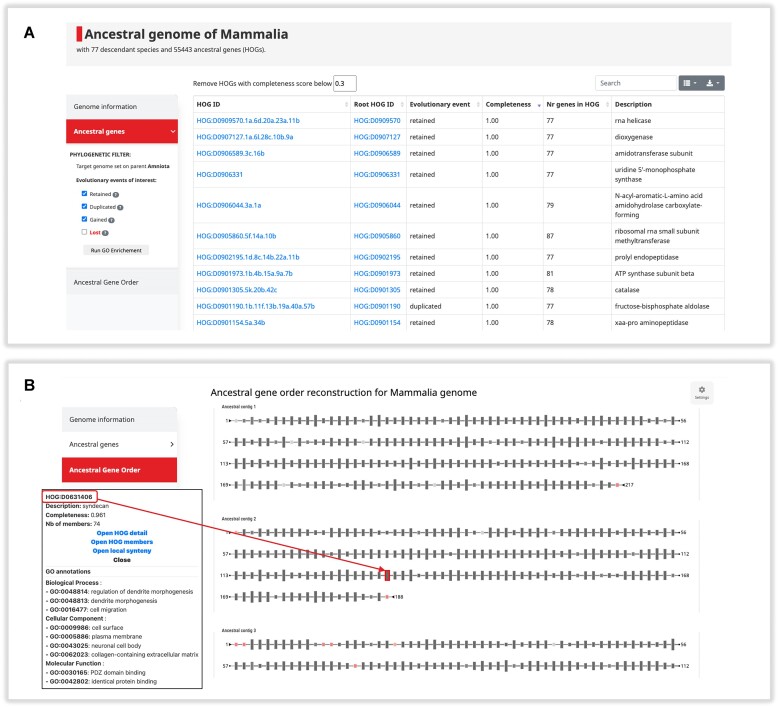
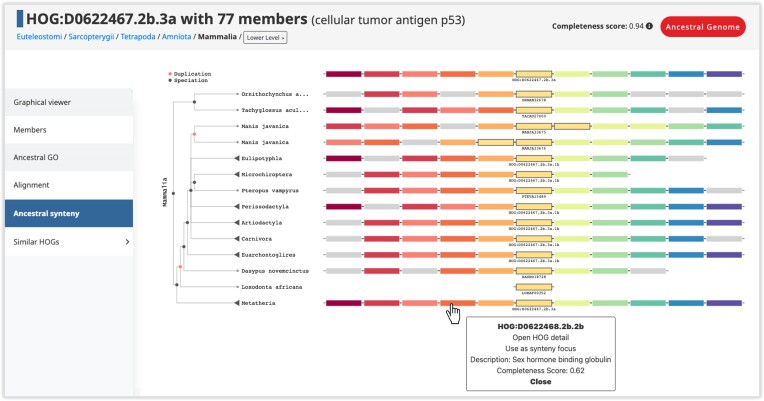
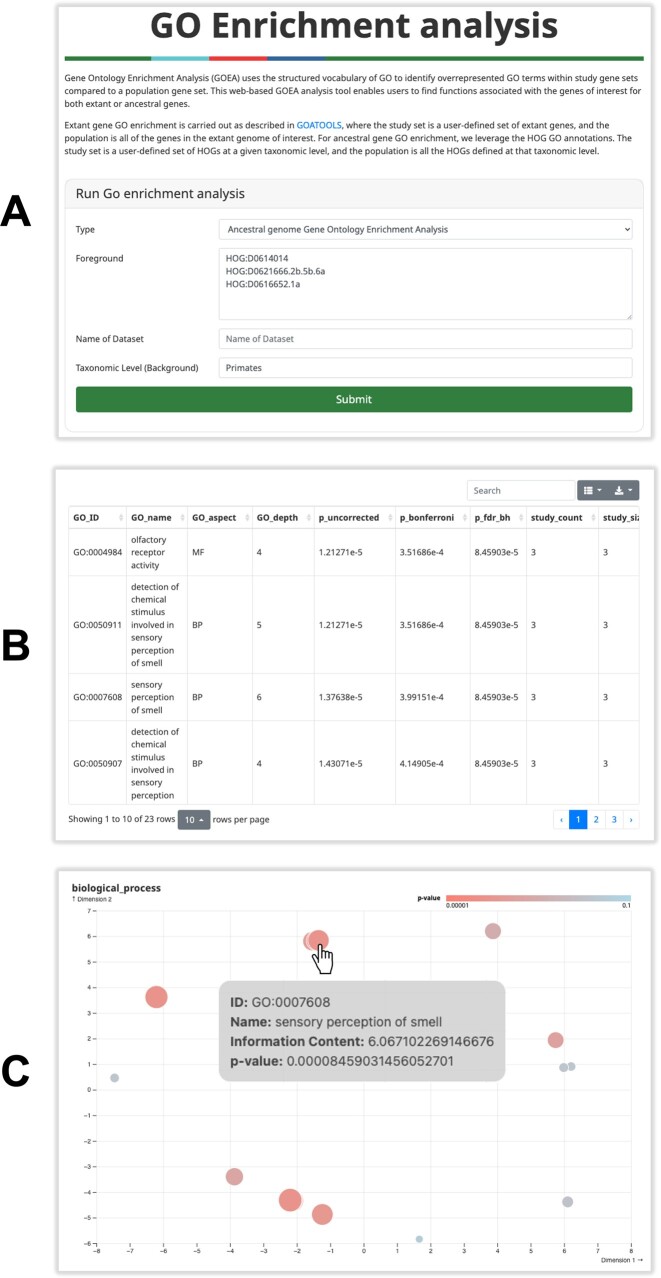
In this update paper, we present the latest developments in the OMA browser knowledgebase, which aims to provide high-quality orthology inferences and facilitate the study of gene families, genomes and their evolution. First, we discuss the addition of new species in the database, particularly an expanded representation of prokaryotic species. The OMA browser now offers Ancestral Genome pages and an Ancestral Gene Order viewer, allowing users to explore the evolutionary history and gene content of ancestral genomes. We also introduce a revamped Local Synteny Viewer to compare genomic neighborhoods across both extant and ancestral genomes. Hierarchical Orthologous Groups (HOGs) are now annotated with Gene Ontology annotations, and users can easily perform extant or ancestral GO enrichments. Finally, we recap new tools in the OMA Ecosystem, including OMAmer for proteome mapping, OMArk for proteome quality assessment, OMAMO for model organism selection and Read2Tree for phylogenetic species tree construction from reads. These new features provide exciting opportunities for orthology analysis and comparative genomics. OMA is accessible at https://omabrowser.org.


Figures

Graphical Abstract
Graphical Abstract
Figure 1.
Figure 1.
Improved coverage of prokaryotic diversity in the latest OMA browser release (July 2023). The two panels display the bacterial tree (A) and the archaeal tree (B) from GTDB release 207 (9), collapsed at the level of a GTDB phylum and labeled according to the updated nomenclature of prokaryotic phyla (11). Leaves with an assembly identifier label correspond to deep branching genomes without closely related genomes that are treated by GTDB as forming a phylum on their own. The height of each histogram bar is indicative of the proportion of the total number of bacterial (A) or archaeal (B) genomes available in OMA originating from the corresponding phylum. Green reflects the number of genomes in the Aug2020 OMA release, and red the additional genomes in the Jul 2023 release. Despite the bacteria coverage being heavily biased towards the Pseudomonadota (formerly Proteobacteria), Bacillota (formerly Firmicutes) and Actinomycetota (formerly Actinobacteria) phyla, with the updated coverage, almost all phyla in GTDB have at least one representative.
Figure 2.
Figure 2.
Ancestral Genome page for Mammalia. (A) Screenshot of the Ancestral Genes table. Here, each row is a HOG, i.e. ancestral gene, at the taxonomic level of interest. For each gene, the HOG identifier for that level and the HOG identifier of the entire gene family (‘Root HOG ID’) is shown. The ‘Evolutionary event’ column reflects if the gene was retained in a single copy, duplicated, or gained (originated) on the branch leading to this taxonomic level. These events can be filtered using the side menu. (B) Screenshot of the Ancestral Gene Order viewer. Here, the reconstructed gene order is shown: HOGs at that taxonomic level are represented as rectangles, connected based on evidence of gene order in the extant genomes. Node color indicates the Completeness Score (0 = red, 1 = dark grey), and node size is the number of extant genes in the HOG.
Figure 3.
Figure 3.
Ancestral and extant unified local synteny viewer. The boxes represent extant or ancestral genes, with genes of the same color related by homology, i.e. found in the same HOG at the taxonomic level of interest. The focal HOG (or extant gene) and its homologs are outlined in black, with their names shown below. In this example, the focal HOG displayed is the cellular tumor antigen p53 at the Mammalia level. The top row is the reconstructed genomic neighborhood of this gene in the Mammalian common ancestor. The reconciled gene tree is displayed to the left, with the genomic neighborhood of each ancestral or extant genome shown next to it. Duplication nodes are shown in red. The viewer is interactive in that users can collapse nodes on the tree to display the genomic neighborhood in the ancestor corresponding to that node. Clicking on an ancestral gene displays the HOG ID and the functional description of the HOG, and clicking on an extant gene displays the identifiers, sequence length, chromosome, description and the HOG it belongs to.
Figure 4.
Figure 4.
Extant and ancestral Gene Ontology enrichment analysis. (A) User interface to submit a study set of genes. (B) The resulting table displays the GO terms over-represented in the study set with a Benjamini-Hochberg FDR corrected P-value ≤0.05 Notably, users have access to the study and population sets, as well as the entries in the study set annotated with the GO term. (C) The Biological Process output plot showing enriched GO terms. Here, each bubble represents an enriched GO term, with the P-value indicated by color. The size of the bubble is proportional to the information content. Mousing over the bubbles gives the GO name, GO identifier, corrected P-value and information content. (Not shown: CC and MF.)

References

    1. Fitch W.M. Distinguishing homologous from analogous proteins. Syst. Zool. 1970; 19:99–113. - PubMed
    1. Glover N., Dessimoz C., Ebersberger I., Forslund S.K., Gabaldón T., Huerta-Cepas J., Martin M.-J., Muffato M., Patricio M., Pereira C.et al. .. Advances and applications in the quest for orthologs. Mol. Biol. Evol. 2019; 36:2157–2164. - PMC - PubMed
    1. Dessimoz C., Cannarozzi G., Gil M., Margadant D., Roth A., Schneider A., Gonnet G. McLysaght A., Huson D.H.. OMA, A comprehensive, automated project for the identification of orthologs from complete genome data: introduction and first achievements. RECOMB 2005 Workshop on Comparative Genomics. 2005; Springer-Verlag; 61–72.
    1. Altenhoff A.M., Schneider A., Gonnet G.H., Dessimoz C.. OMA 2011: orthology inference among 1000 complete genomes. Nucleic Acids Res. 2011; 39:D289–D294. - PMC - PubMed
    1. Altenhoff A.M., Škunca N., Glover N., Train C.-M., Sueki A., Piližota I., Gori K., Tomiczek B., Müller S., Redestig H.et al. .. The OMA orthology database in 2015: function predictions, better plant support, synteny view and other improvements. Nucleic Acids Res. 2015; 43:D240–D249. - PMC - PubMed

LinkOut - more resources