. 2023 Dec 19;14(6):e0251523.
doi: 10.1128/mbio.02515-23. Epub 2023 Nov 14.

Genetic and functional enrichments associated with Enterococcus faecalis isolated from the urinary tract

Affiliations

Genetic and functional enrichments associated with Enterococcus faecalis isolated from the urinary tract

Belle M Sharon et al. mBio. .

Abstract

Urinary tract infection (UTI) is a global health issue that imposes a substantial burden on healthcare systems. Women are disproportionately affected by UTI, with >60% of women experiencing at least one UTI in their lifetime. UTIs can recur, particularly in postmenopausal women, leading to diminished quality of life and potentially life-threatening complications. Understanding how pathogens colonize and survive in the urinary tract is necessary to identify new therapeutic targets that are urgently needed due to rising rates of antimicrobial resistance. How Enterococcus faecalis, a bacterium commonly associated with UTI, adapts to the urinary tract remains understudied. Here, we generated a collection of high-quality closed genome assemblies of clinical urinary E. faecalis isolated from the urine of postmenopausal women that we used alongside detailed clinical metadata to perform a robust comparative genomic investigation of genetic factors that may be involved in E. faecalis survival in the urinary tract.

Keywords: Enterococcus; adaptation; genomics; host-microbe interactions; hybrid assembly; urinary tract infection.


Conflict of interest statement

The authors declare no conflict of interest.

Figures

FIG 1
FIG 1
Clinical cohorts and an isolated collection of Enterococcus faecalis. (A) Patient cohorts were stratified based on patient UTI history, symptoms, and urinalysis results at the time of specimen collection. n denotes the number of isolates. (B) Number of isolate genomes from each isolation group. In the urine group, 13 isolates have been obtained from National Center for Biotechnology Information, while the remaining isolates have been sequenced as part of this study. aIsolates sequenced as part of this study. bIsolates from Palacios Araya et al.’s study (33, 34). cIsolates from Van Tyne et al.’s study (24). Genome assembly criteria used for the selection of comparator genomes. *A couple of isolates reported in Table S3 do not meet one criterion but were included as they were reported in previous literature and met all other criteria. (C) Counts of complete and incomplete genome assemblies in the urine (pink), gut (blue), and blood (gray) isolation groups.
FIG 2
FIG 2
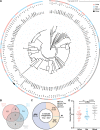
Phylogenetics, MLST, pangenome, and genome size distributions of urinary, gut, and blood E. faecalis isolates. (A) MinVAR-rooted maximum likelihood phylogenetic tree constructed from the core gene alignment of all strains in this study. Isolate names are listed on leaves. Dots represent the complete genome assembly. ST is depicted next to isolate names. U, unknown; *, ST has a novel allele; ?, ST uncertain. The ouutermost ring is color-coded by isolation source: urine (pink), gut (blue), blood (gray), and reference (black). (B) MLST Venn diagram depicting the total number of distinct sequence types in each of the isolation groups. Totals are listed below group names. (C) Pangenome analysis summary. Core genes are present in >99% of isolates; soft core genes are present in 95%–99% of isolates; shell genes are present in 15%–95% of isolates; and cloud genes are present in <15% of isolates. (D) Distributions of genome size in megabases of isolates per isolation group. Isolates are represented by dots, and the line represents the median. Statistical significance was determined using an ordinary one-way analysis of variance with multiple comparisons post-hoc. aIsolate name has been shortened for simplicity. MGYG-01694, MGYG-HGUT-01694; BSD G10, BSD2780061688st3_G10.
FIG 3
FIG 3
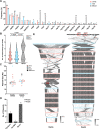
Rep type analysis and in-depth comparison of rep9a and rep9b. (A) Frequency (raw counts normalized to total group size) of all reps identified. Isolate counts are listed at the bar top. (B) Distribution of the number of plasmid reps per isolate in each isolation group. Statistical significance was determined using the Kruskal-Wallis test with multiple comparisons. (C) Size in kilobases of each rep9a and rep9b plasmid within complete genome assemblies. Each dot represents a single plasmid and is color-coded by isolation group. Rep9a n = 17, Rep9b n = 22. (D) Number of plasmids possessing cytolysin, vancomycin resistance operon VanHBX, and bacteriocin Bac41 as identified by sequence alignments. Bars are colored by the plasmid rep type associated with the locus. (E) tblastx alignments of rep9a (left, n = 17) and rep9b (right, n = 22) complete plasmids. Arrows denote coding sequences and are color-coded by plasmid isolation source: urine (pink), gut (blue), blood (gray), and reference (black). The reference rep9a plasmid is DS16 pAD1. The reference rep9b plasmid is pMG2200. Shaded lines between plasmid sequences are colored based on sequence identity (%). The loci of the cytolysin operon, the VanHBX operon, and bac41 are highlighted in the reference plasmid by red blocks.
FIG 4
FIG 4
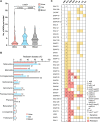
Extrachromosomal pseudolysogenic bacteriophage EF62phi prevalence in E. faecalis. (A) Complete genome of EF62phi with color-coded annotation of coding sequences. (B) Frequency of the presence of EF62phi within the genomes of each isolation group. Raw isolate counts are listed at bar tops. (C) Number of strains possessing EF62phi that were isolated from the Dallas (n = 52) versus non-Dallas (n = 78) areas. Raw isolate counts are listed at bar tops. Geographies were determined for a subset of genomes for which geographical metadata were available.
FIG 5
FIG 5
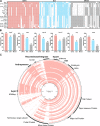
Antimicrobial resistance genes, chromosomal mutation predictions, and resistance phenotypes of urinary isolates. (A) Distribution of the total number of ARGs per strain in each isolation group. Each copy of a multi-copy ARG was counted. *Chromosomal mutations were counted as ARGs. Statistical significance was determined using the Kruskal-Wallis test with multiple comparisons. (B) Frequency of resistant isolates in each isolation source as predicted by ARG in silico analysis. Isolate counts are listed as bar ends. (C) Heatmap of resistance phenotypes assessed by disk diffusion and minimum inhibitory concentration assays. Numbers correspond to the presence of an ARG or mutation. Ubiquitous efflux pumps and intrinsic resistance genes are not depicted.
FIG 6
FIG 6
Candidate genes enriched among urinary E. faecalis isolates. (A) Presence/absence map of 19 candidate genes. Columns represent a single isolate, and colored blocks correspond to the isolation source: urine (pink), gut (blue), and blood (gray). Genes were identified by comparing urine and gut isolates; their presence in blood isolates is provided for reference. (B) Frequency of candidate genes within each isolation source. Isolate counts are listed at bar tops. (C) BLAST Ring Image Generator blastn alignment of urinary isolates (pink rings) phage04 integration region (eno to rhaS) to V583 phage04 reference (gray ring). Prophage annotations are listed, and enriched candidates are in bold. Isolate UMB0891 is not included in the alignment since the conserved region is not syntenic.

References

    1. Shankar N, Lockatell CV, Baghdayan AS, Drachenberg C, Gilmore MS, Johnson DE. 2001. Role of Enterococcus faecalis surface protein Esp in the pathogenesis of ascending urinary tract infection. Infect Immun 69:4366–4372. doi:10.1128/IAI.69.7.4366-4372.2001 - DOI - PMC - PubMed
    1. Huycke MM, Sahm DF, Gilmore MS. 1998. Multiple-drug resistant enterococci: the nature of the problem and an agenda for the future. Emerg Infect Dis 4:239–249. doi:10.3201/eid0402.980211 - DOI - PMC - PubMed
    1. Guzmàn CA, Pruzzo C, LiPira G, Calegari L. 1989. Role of adherence in pathogenesis of Enterococcus faecalis urinary tract infection and endocarditis. Infect Immun 57:1834–1838. doi:10.1128/iai.57.6.1834-1838.1989 - DOI - PMC - PubMed
    1. Lewis CM, Zervos MJ. 1990. Clinical manifestations of enterococcal infection. Eur J Clin Microbiol Infect Dis 9:111–117. doi:10.1007/BF01963635 - DOI - PubMed
    1. Richards MJ, Edwards JR, Culver DH, Gaynes RP, National . 2000. Nosocomial infections in combined medical-surgical intensive care units in the United States. Infect Control Hosp Epidemiol 21:510–515. doi:10.1086/501795 - DOI - PubMed

Substances