

Single-cell transcriptomics stratifies organoid models of metabolic dysfunction-associated steatotic liver disease
- PMID: 37962490
- PMCID: PMC10711666
- DOI: 10.15252/embj.2023113898
Single-cell transcriptomics stratifies organoid models of metabolic dysfunction-associated steatotic liver disease
Erratum in
-
Author Correction: Single-cell transcriptomics stratifies organoid models of metabolic dysfunction-associated steatotic liver disease.EMBO J. 2024 Dec;43(24):6792-6795. doi: 10.1038/s44318-024-00308-w. EMBO J. 2024. PMID: 39567832 Free PMC article.
Abstract
Metabolic dysfunction-associated steatotic liver disease (MASLD) is a growing cause of morbidity with limited treatment options. Thus, accurate in vitro systems to test new therapies are indispensable. While recently, human liver organoid models have emerged to assess steatotic liver disease, a systematic evaluation of their translational potential is still missing. Here, we evaluated human liver organoid models of MASLD, comparatively testing disease induction in three conditions: oleic acid, palmitic acid, and TGF-β1. Through single-cell analyses, we find that all three models induce inflammatory signatures, but only TGF-β1 promotes collagen production, fibrosis, and hepatic stellate cell expansion. In striking contrast, oleic acid ameliorates fibrotic signatures and reduces the hepatic stellate cell population. Linking data from each model to gene expression signatures associated with MASLD disease progression further demonstrates that palmitic acid and TGF-β1 more robustly model inflammation and fibrosis. Our findings highlight the importance of stratifying MASLD organoid models by signatures of clinical disease progression, provide a single-cell reference to benchmark future organoid injury models, and allow us to study evolving steatohepatitis, fibrosis, and HSC susceptibility to injury in a dynamic, multi-lineage human in vitro system.
Metabolic dysfunction‐associated steatotic liver disease (MASLD, formerly NAFLD) is a major cause of chronic hepatic injury and failure, however the details of its induction remain unclear. This benchmark resource reports in vitro dissection of fatty liver disease in human organoids uncovering distinct disease phenotypes triggered by specific lipids.
Human pluripotent stem cell‐derived liver organoids serve as models for injury related to MASLD.
Palmitic acid induces inflammatory signatures while TGF‐β1 signaling induces inflammatory and fibrotic signatures.
Oleic acid reduces hepatic stellate cell numbers and suppresses collagen production.
Gene expression predicting MASLD severity increases from palmitic acid to TGF‐β1 treatment.
Keywords: MASLD; NAFLD; fibrosis; liver organoids; single-cell RNA-sequencing.
© 2023 The Authors. Published under the terms of the CC BY 4.0 license.
Conflict of interest statement
ACM receives research funding from Boehringer Ingelheim, Bristol‐Myers Squibb, and GlaxoSmithKlein for other projects and has been a consultant for Third Rock Ventures. R‐UR is co‐founder of deepnostiX GmbH and deepnostiX Private limited.
Figures
- A
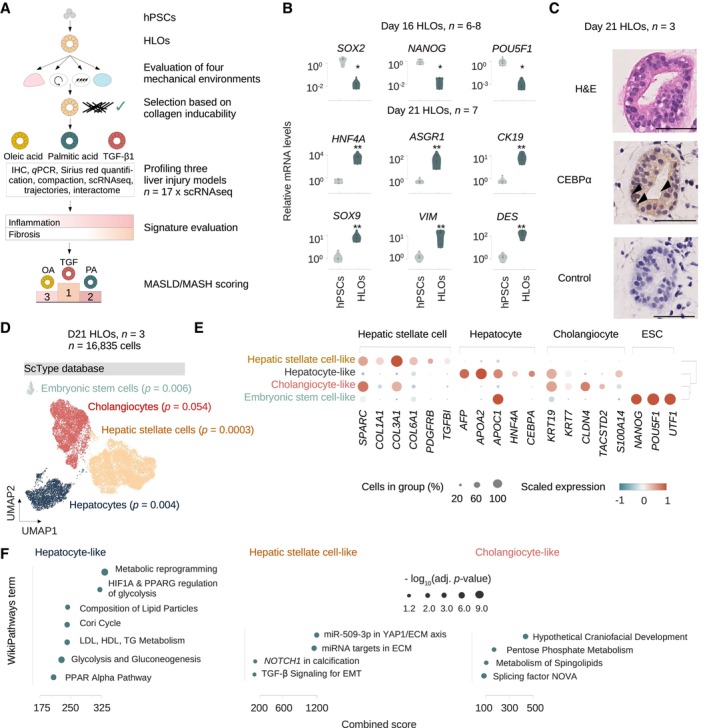
Overview of the experimental design. Human pluripotent stem cells (hPSCs) are differentiated into human liver organoids (HLOs) and cultured in four different mechancial environments. The environment suitable for collagen induction is selected, and three injury scenarios (OA, PA, TGF‐β1) are evaluated for their potential to model inflammation and fibrosis by functional and transcriptomic readouts, with a total of 17 HLO samples being subjected to 10× single‐cell RNA sequencing (scRNA‐seq). Transcriptomic signatures for inflammation and fibrosis are derived and evaluated. Finally, a MASLD/MASH severity score is applied, allowing for the hierarchical ordering of HLO injury models by their potential to model MASLD disease progression.
- B
Expression of pluripotency genes is reduced with HLO differentiation, while liver markers are induced. Relative gene expression is measured by quantitative reverse transcriptase (qRT) PCR and normalized by housekeeping gene ACTB and displayed relative to hPSC controls (). Comparison between hPSCs and HLOs from the same experiment were performed at day 16 or 21 as indicated. N ≥ 6 individual experiments (batches) as indicated by circles. Horizontal lines in violin plots represent quartiles, Kernel density estimates are trimmed to the range of the observed data. Mann–Whitney‐U‐statistics (two‐tailed) hPSCs vs. HLOs: P‐valuesday 16 HLOs = 0.0024, Bonferroni‐adjusted level of significance: 0.0125 (*); P‐valuesday 21 HLOs = 0.0022, Bonferroni‐adjusted level of significance: 0.0071 (**).
- C
HLOs on day 21 show an organized, luminal structure and express human liver proteins. Representative immunohistochemistry images of HLOs stained in hematoxylin & eosin (H&E), CEBPa, and negative control with secondary antibody on day 21. Arrowheads indicate sites of nuclear protein staining. Scale bars, 50 μm. N = 3 individual experiments (batches).
- D
scRNA‐seq analysis of day 21 HLOs identifies the major cell types of the human liver as annotated by scType (Ianevski et al, 2022) database marker genes. UMAP plots showing cells from 10× scRNA‐seq in day 21 HLOs (n = 3 technical replicates of one experimental batch). Cell type annotations by EnrichR over‐representation analysis (Kuleshov et al, ; Fang et al, 2022) with scType (Ianevski et al, 2022), adjusted P‐value as indicated in the figure.
- E
Dotplot showing the expression of canonical cell‐type‐specific marker genes expected in the human liver across clusters. Cell types defined by single‐cell data are displayed on the y‐axis, and marker genes (bottom) are sorted by cell type (top). The fraction of cells expressing a gene is indicated by the size of the circle, and the scaled mean expression of a gene is indicated by color. Hierarchical clustering is represented by the dendrogram on the right.
- F
Top enriched WikiPathways (Martens et al, 2021) terms for the three major cell types in day 21 HLOs. Terms were sorted by combined score and have been shortened for readability. Dot sizes correspond to the negative decadic logarithm of the adjusted P‐value, dot color represents the Odds ratio for each term.
- A
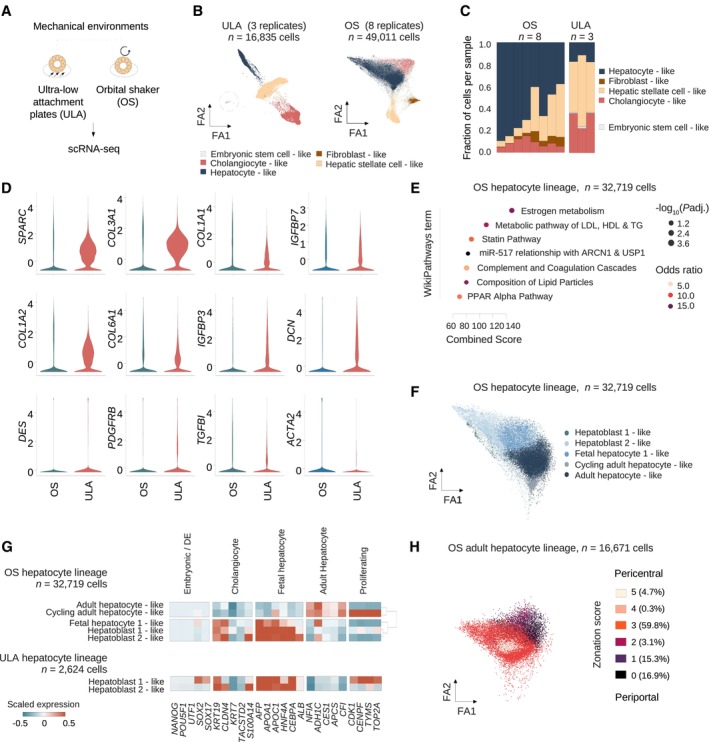
Overview of the two mechanical environments selected for 10× scRNA‐seq.
- B
ForceAtlas2 plots mapping cells from control ULA‐HLOs (cultured in ultra low attachment plates, n = 16,835 cells, n = 3 replicates) and control OS‐HLOs (cultured in orbital shaker, n = 49,011 cells, n = 8 replicates). Dotted line highlights the embryonic stem cell‐like population, which is only present in ULA‐HLOs. ScType database annotations in OS‐HLOs: Hepatocytes (P = 2.56E‐07), Cholangiocytes (P = 0.01), Hepatic stellate cells (P = 1.3E‐10), Fibroblasts (P = 0.003).
- C
OS‐HLOs show a relative reduction of HSC‐ and cholangiocyte‐like cells while the fraction of hepatocyte‐like cells is increased. Barplots showing the cell cluster proportions as the fraction of total cells per sample for each of the individual OS‐ and ULA‐HLO replicates. The color indicates the cell type as annotated in (B), and cell types are listed in the order they are displayed.
- D
Violin plots displaying the normalized, scaled expression of hepatic stellate cell marker genes in OS‐ and ULA‐HLOs across all cells. Corresponding ForceAtlas2 representations are provided in Appendix Fig S2h.
- E
Doplot showing the top enriched WikiPathways (Martens et al, 2021) terms by combined score. Dot sizes correspond to negative decadic logarithm of the adjusted P‐value, colors represent the odds ratio. Terms have been shortened for readability.
- F
ForceAtlas2 plots mapping hepatocyte‐like cells from control OS‐HLOs. Cells were annotated to the human fetal liver development atlas (Wesley et al, 2022). n = 32,719 cells (n = 8 controls).
- G
HLOs exposed to the OS‐environment show KRT19low hepatocyte subpopulations expressing mature hepatocyte markers. Matrixplot shows the scaled mean expression for marker genes for stages of hepatocyte development for OS‐hepatocyte lineage subclusters (top) as annotated in (F). in comparison to ULA‐hepatocyte‐like subpopulations (bottom). Marker genes (bottom) are sorted by cell type (top). Dendrogram representing hierarchical clustering for lineages with > 2 hepatocyte‐like subgroups is shown on the right. ULA: n = 2,624 cells (n = 3 controls), OS: n = 32,719 cells (n = 8 controls). Annotations were selected based on the highest‐ranked annotation by marker gene overlap. P‐values (sub‐clustered ULA populations): HB1 (cluster 1, P = 0.99), HB1 (cluster 2, P = 0.99), HB1 (cluster 3, P = 0.99), HB2 (cluster 4, P = 0.99), HB2 (cluster 1, P = 0.92), HB2 (cluster 2, P = 0.98). Sub‐clustered OS‐populations: AH (P = 0.94), HB2 (P = 0.46), HB1 (P = 0.79), FH1 (P = 0.88), FH2 (P = 0.733), cluster 6 (P = 0.73, manually annotated as cycling AH, Appendix Fig S2g).
- H
Adult hepatocyte‐like cells from HLOs exposed to the OS‐environment display hepatocyte zonation. ForceAtlas2 plots mapping OS‐adult hepatocyte‐like cells from (F). Color indicates the hepatocyte zonation score as calculated based on marker genes from a human adult liver scRNAseq reference (MacParland et al, 2018) (Materials and Methods). n = 16,671 cells (n = 8 controls).
- A
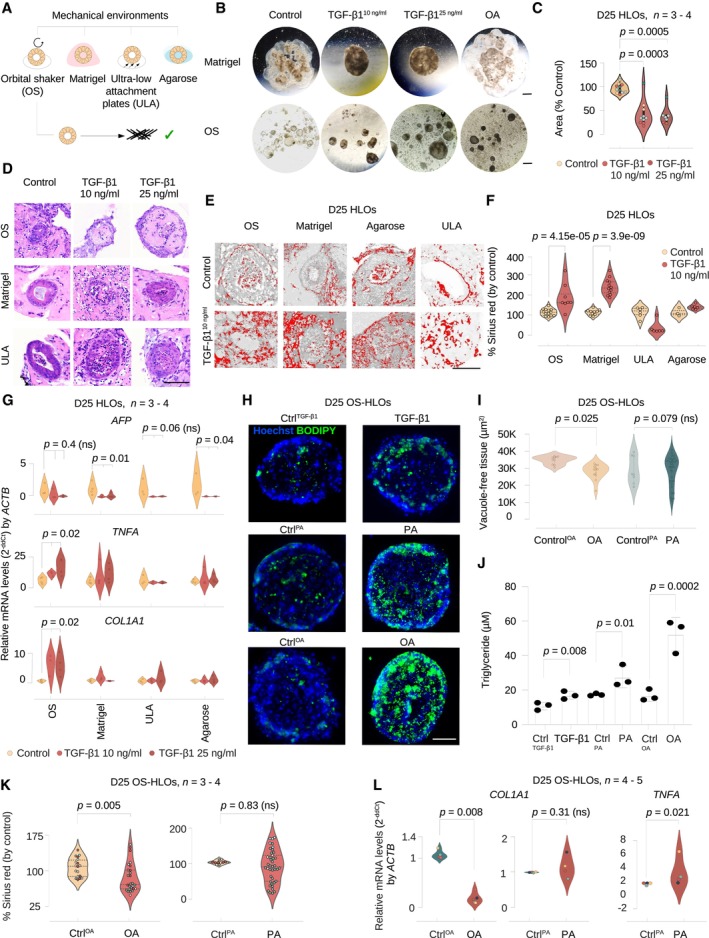
Overview of the four mechanical environments evaluated for their potential to promote collagen induction with injury models.
- B
HLOs in the Matrigel‐ and OS‐environments display morphologic changes when treated with TGF‐β1 and OA. Brightfield images of whole Matrigel domes with embedded HLOs (upper panel, scale bar 3 mm) and HLOs isolated from Matrigel in the orbital shaker environment (lower panel, scale bar 0.1 mm) after 4 days of treatment with TGF‐β1 (10, 25 ng/ml), OA (400 μM), and controls. Contraction of the Matrigel dome with TGF‐β1 treatment and darkening of color (among all treatments) was observed.
- C
Compaction assay for Matrigel‐environment cultured HLOs indicates a significant surface area reduction for HLOs treated with TGF‐β1. Violin plots displaying the Matrigel drop area normalized by the control. Kruskal–Wallis test (two‐tailed) followed by a post hoc Conover's test with Bonferroni correction. Dot colors represent experiments, circles represent individual technical replicates. N = 3–4 experiments.
- D
H&E stainings of OS‐HLOs (upper row), Matrigel‐HLOs (middle row), and ULA‐HLOs (lower row) after 4 days of treatment with TGF‐β1 (10, 25 ng/ml) display wall thickening in Matrigel‐ and ULA‐ HLOs while hyaline‐like intra‐organoidal mass accumulation is present only in OS‐HLOs. Scale bar 100 μm. Precise numbers of technical replicates are represented by circles. N = 1 experiment.
- E
Thresholded images of Sirius red‐stained HLOs cultured in four different environments stimulated with TGF‐β1 (10 ng/ml) show collagen deposition in Matrigel‐ and OS‐HLOs. Scale bars 100 μm. 3 HLOs (technical replicates). N = 1–2 experiments.
- F
Sirius red staining quantification indicates significant collagen fiber deposition only in HLOs exposed to Matrigel‐ and OS‐environments during stimulation with TGF‐β1 (10 ng/ml). Violin plots showing the percentage of Sirius red positive tissue normalized by the mean of the control. Horizontal lines in violin plots represent quartiles. Kruskal–Wallis (two‐tailed) test followed by a post hoc Conover's test with Bonferroni correction. Precise numbers of technical replicates per group as represented by circles. N = 1 experiment.
- G
qRT‐PCR for COL1A1, TNFA, and AFP indicates a significant induction of COL1A1 and TNFA transcripts only in HLOs stimulated in the OS‐environment. Violin plots showing relative mRNA levels normalized to ACTB for each mechanical environment (). Kruskal–Wallis (two‐tailed) test followed by a post hoc Conover's test with Bonferroni correction comparing three treatment groups per culture method. P‐values as indicated in the figure, ns, not significant. N = 3–4 experiments.
- H
BODIPY staining of lipids in HLOs cultured in the OS‐environment with exposure to TGF‐β1 and FFAs. Representative BODIPY immunofluorescence images of day 25 OS‐HLOs treated TGF‐β1, PA, and OA (right) or the control solutions (left). BODIPY staining (green), nuclear DNA staining with Hoechst (blue), scale bar, 50 μm. N = 2 experiments. See Appendix Fig S3c for analysis of HLOs derived from a second PSC line.
- I
Tissue quantification for 200 × 200 μm regions of interest (ROIs) around single HLOs treated with OA, PA, and their respective controls. Kruskal–Wallis test (two‐tailed) followed by a post hoc Conover's test with Bonferroni correction. P‐values as indicated in the figure, ns, not significant. 66 HLOs (technical replicates). N = 3 experiments.
- J
Triglyceride (TAG) content is quantified in OS‐HLOs treated with TGF‐β1, PA, and OA for 4 days. Bar plots display the total TAG concentration in μM for a representative experiment. Individual dots represent technical replicates, bar plots show mean ± SD. Kruskal–Wallis test (two‐tailed) followed by a post hoc Conover's test. P‐values as indicated in the fig N = 1 experiment.
- K
Sirius red quantification in HLOs treated with OA, PA, and their controls. Shown is the percentage of Sirius red positive tissue by total tissue (normalized by the mean of the control HLOs in each experiment). Quantification for 200 × 200 μm regions of interest (ROIs) around single HLOs. Horizontal lines in violin plots represent quartiles. Kruskal–Wallis test (two‐tailed) followed by a post hoc Conover's test with Bonferroni correction, ns, not significant. 95 HLOs (technical replicates). N = 3–4 experiments.
- L
COL1A1 expression is reduced in OS‐HLOs treated with OA for 4 days, TNFA expression is induced in OS‐HLOs treated with PA for the same duration. Shown are qPCR results for relative mRNA levels of COL1A1 and TNFA normalized to ACTB. Mann–Whitney‐U test (two‐tailed). P‐values as indicated in the figure, ns, not significant. N = 3–5 experiments (represented by individual dot colors).
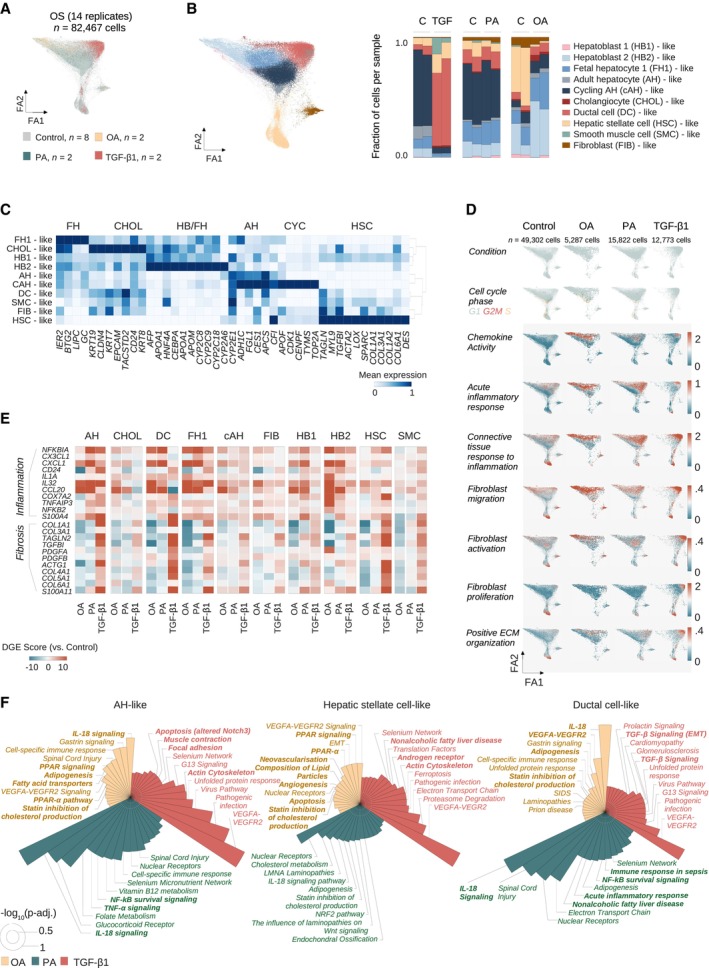
ForceAtlas2 representation of cells from OS‐HLOs treated for 4 days with OA (500 μM), PA (500 μM), or TGF‐β1 (10 ng/ml), and their respective controls, colored by treatment condition. N = 82,467 cells from 14 replicates (n = 2 replicates per condition, n = 8 controls).
ForceAtlas2 representation from (A), colored by cell type as annotated with the ScType (Ianevski et al, 2022) database and hepatocyte‐like cells resolved to the human fetal liver development atlas (Wesley et al, 2022) annotation (Materials and Methods). Barplot to the right shows cell cluster proportions as the fraction of total cells per sample for each of the individual replicates. Color encodes cell type annotation, and annotations are listed in the order they are displayed. P‐values for sub‐clustered populations: Ductal cell‐like 1 (P = 2E‐05), ductal cell‐like 2 (P = 0.88, manually annotated, Materials and Methods, Appendix Fig S4d), smooth muscle cell‐like (P = 6.99E‐07), cholangiocyte‐like (P = 3.2E‐06).
Matrixplot shows the scaled mean expression for marker genes in each cluster from (B). Canonical marker genes (bottom) are sorted by cell type (top). Hierarchical clustering is represented by the dendrogram on the right. N = 82,467 cells from 14 replicates (n = 2 replicates per condition, n = 8 controls). AH, adult hepatocyte; CHOL, cholangiocyte; CYC, cycling; FH, fetal hepatocyte; HB, hepatoblast; HSC, hepatic stellate cell.
OA and PA induce inflammatory signals, and TGF‐β1 induces expanded fibrotic signatures. ForceAtlas2 plots show GO term (The Gene Ontology Consortium, ; Carbon et al, 2021) scores for selected categories related to inflammation and fibrosis (labeled, left) for HLOs treated with OA, PA, TGF‐β1, and controls (labeled, top). Increased expression is indicated by a shift from blue to red. Cell cluster annotations are provided in (B). Scale bars indicate the expression score. N = 14 replicates (n = 2 replicates per condition, n = 8 controls). Cell numbers are indicated.
FFAs induce an inflammatory signature, TGF‐β1 induces a fibrotic signature, and OA ameliorates the fibrotic signature in HLOs. Cell clusters were separated for expression analysis (top). Differential expression score (pairwise comparison between treatment‐specific controls and treatments, Materials and Methods) for selected genes associated with fibrosis and inflammation for cell types indicated on the top. Differential gene expression (DGE) data are provided in Dataset EV6. AH, adult hepatocyte‐like; CHOL, cholangiocyte‐like; DC, ductal cell‐like; FH1, fetal hepatocyte 1‐like; FIB, fibroblast‐like; HB1, hepatoblast 1‐like; HB2, hepatoblast 2‐like; HSC, hepatic stellate cell‐like; SMC, smooth muscle cell‐like.
Top enriched WikiPathways (Martens et al, 2021) terms for treatment‐specific differentially expressed genes in three HLO cell populations corresponding to (B), as labeled. Circular bar plots display the negative decadic logarithm of adjusted P‐values for the respective terms. Cut‐off for plots is an adjusted P‐value below 0.05. White circles indicate negative decadic logarithm of adjusted P‐values of 0.5 (inner white circle) and 1 (outer white circle). Terms have been shortened for readability, full lists and further cell clusters are provided in Appendix Fig S5.
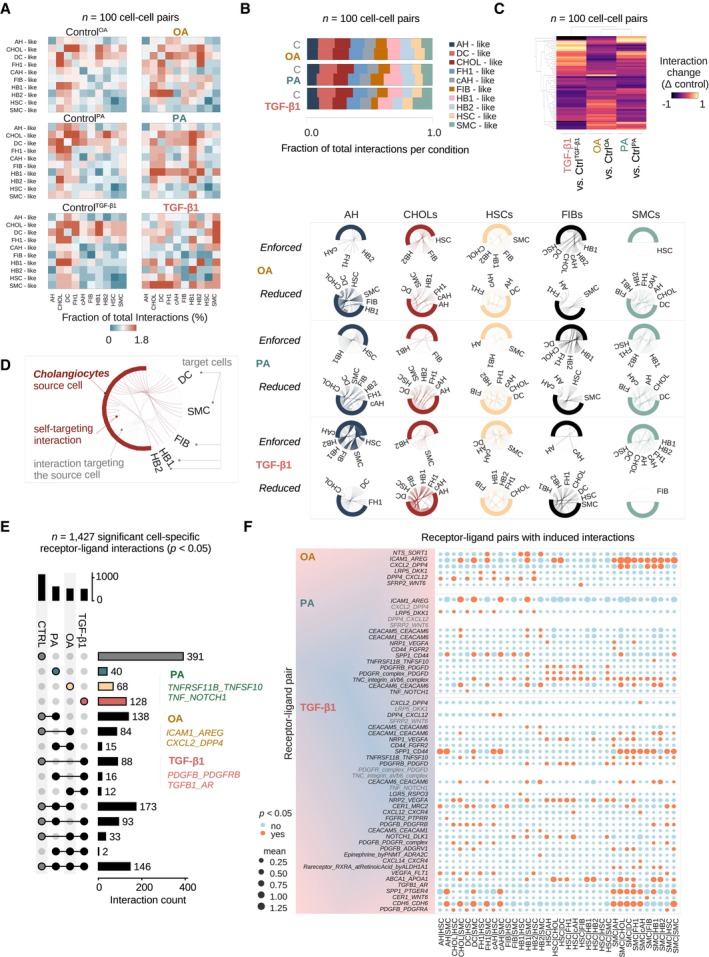
CellPhoneDB (Efremova et al, 2020) analysis of cell–cell interactions in healthy and injured HLOs. Heatmaps show the fraction of total interactions per condition in day 25 OS‐cultured HLOs treated with OA, PA, TGF‐β1, and their respective controls. HSC, hepatic stellate cell‐like; AH, adult hepatocyte‐like; cAH, cycling adult hepatocyte‐like; CHOLs, cholangiocyte‐like; DC, ductal cell‐like; FH1, fetal hepatocyte 1‐like; FIB, fibroblast‐like; HB1, hepatoblast 1‐like; HB2, hepatoblast 2‐like; SMC, smooth muscle cell‐like. N = 100 possible cell–cell interactions per condition, n = 2 replicates per condition, n = 6 controls.
Stacked bar plots show the fraction of total interactions per condition for all cell clusters, where the respective cell is the source of the interaction. Abbreviations are as listed in (A). Cell clusters are colored in the order of their appearance. N = 100 possible cell–cell interactions, n = 2 replicates per condition, n = 6 controls.
Clustered heatmap shows the difference in the fraction of total interactions between each treatment and its control group. Dendrograms show the hierarchical clustering by condition (top) and cell–cell interaction (left). N = 100 possible cell–cell interactions, n = 2 replicates per condition, n = 6 controls.
Chord diagrams show the fraction of total interactions per source cell with its respective target cells in HLOs treated with OA, PA, and TGF‐β1 relative to their controls. Chord diagrams are divided by interactions that have (i) a higher fraction of total interactions in treatment conditions (“enforced”), and (ii) interactions with a lower fraction of total interactions (“reduced”) compared to controls. Colored lines indicate interactions initiated by the source cell in each column, while gray lines show interactions of other cell types targeting the source cell. N = 100 possible cell–cell interactions, n = 2 replicates per condition, n = 6 controls.
UpSet plot displays the numbers of intersecting and unique significant (P‐value < 0.05) cell‐type‐specific receptor‐ligand interactions of HLOs treated with OA, PA, TGF‐β1, and controls. Examples for receptor‐ligand pair categories containing unique interactions for each treatment are displayed (Materials and Methods). N = 1,427 significant cell–cell partner‐specific receptor‐ligand pair interactions, n = 2 replicates per condition, n = 6 controls.
Dotplots show receptor‐ligand pairs with an induced number of significant cell–cell interactions in HLOs treated with OA, PA, TGF‐β1, compared to their respective controls. Receptor‐ligand pairs with at least two induced interactions are shown. Mean expression (mean of all partners' individual average expression, Materials and Methods) is indicated by the circle size, and significant P‐values < 0.05 are indicated by orange color. An interaction can be non‐significant despite high mean expression among two partnering molecules. Receptor‐ligand pairs are shown on the x‐axes, and cell clusters are shown on the y‐axes. N = 2 replicates per condition, n = 6 controls.
- A
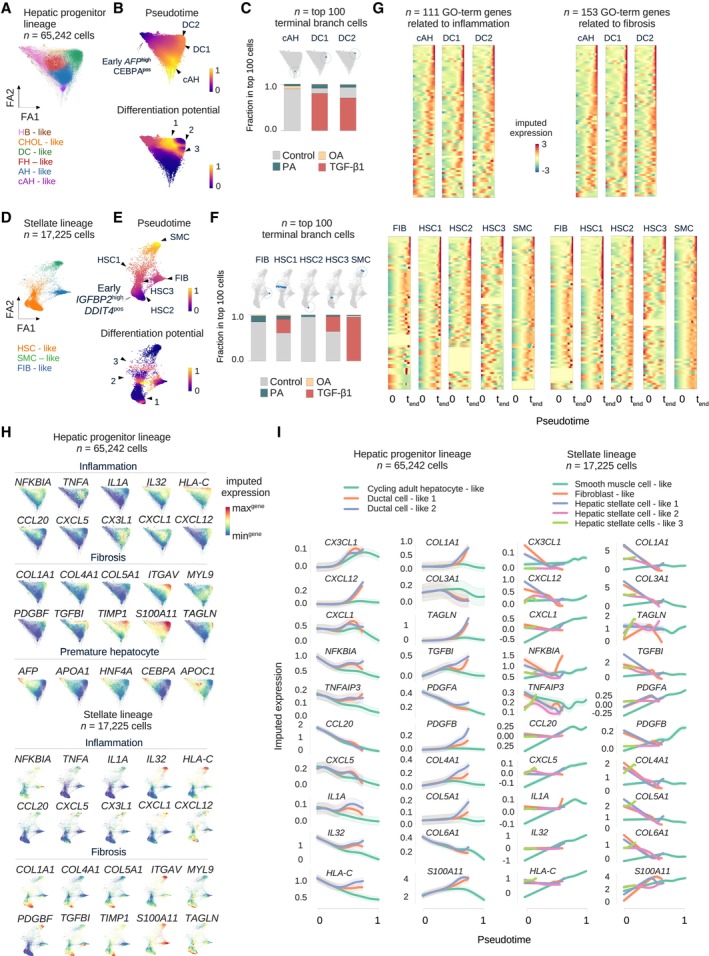
ForceAtlas2 representation of the hepatic progenitor lineage composed of cells from healthy controls and OS‐HLOs treated with OA, PA, and TGF‐β1, colored by cell type. N = 65,242 cells from 14 replicates (n = 2 replicates per condition, n = 8 controls).
- B
ForceAtlas2 representation from (A), colored by Palantir trajectory inference results based on the ForceAtlas2 representation, showing pseudotime (top) and differentiation potential (bottom). For pseudotime, black arrowheads indicate three pseudotime maxima, and the white arrowhead identifies the early cell (selected based on the highest level of AFP expression among cells expressing CEBPA, both of the genes marking hepatocyte precursors, Wesley et al, 2022). Regions of high differentiation potential are indicated by arrowheads 1–3.
- C
Projection of the top 100 terminal branch cells (sorted by branch probabilities) for each terminal state identified by Palantir on the ForceAtlas2 representation from (A) (top). Corresponding barplots below displaying the relative distribution of treatment conditions among the top 100 terminal branch cells for each terminal state.
- D–F
Display the plots from (A) to (C) for the HSC lineage, in this case the early cell is selected based on the highest level of IGFBP2 expression among cells expressing DDIT4, as a marker of fetal HSCs (Wesley et al, 2022). N = 17,225 cells from 14 replicates (n = 2 replicates per condition, n = 8 controls).
- G
Gene expression trends reveal the increase in inflammatory and pro‐fibrotic transcripts along the pseudotime ordering towards PA and TGF‐β1 dominated terminal states. Heatmaps showing the imputed gene expression over Palantir pseudotime for GO term (The Gene Ontology Consortium, ; Carbon et al, 2021) derived inflammation (left) and fibrosis (right) related genes sorted by their imputed expression level at each terminal state (indicated on top of each heatmap). Imputed expression levels are indicated by color, y‐axes correspond to genes, and x‐axes display the pseudotime. Ranked gene lists are provided in Dataset EV8.
- H
ForceAtlas2 representations for hepatic progenitor and HSC lineages from (A) and (D), showing the MAGIC‐imputed gene expression of selected inflammation‐ and fibrosis‐related genes from (G) enriching towards specific terminal states. Fetal hepatocyte‐related transcripts enrich along the trajectory towards the OA‐treated hepatoblast‐like cells. Projection of the imputed gene expression of transcripts related to inflammation, fibrosis, and the developmental stage of hepatoblasts is indicated by section headings. Color represents the range of imputed expression values for each gene.
- I
Gene expression trends for hepatic progenitor (left three columns) and HSC (two right columns) lineages of representative enriched genes from (G). The pseudotime is indicated on the x‐axes and normalized expression is shown on the y‐axes. Cell types are indicated by color (top) and can be identified in (A) and (D). Note that not not all terminal cells reach the maximum pseudotime value of 1 and therefore terminate their trend line before the x‐axis maximum (compare (B) and (E)).
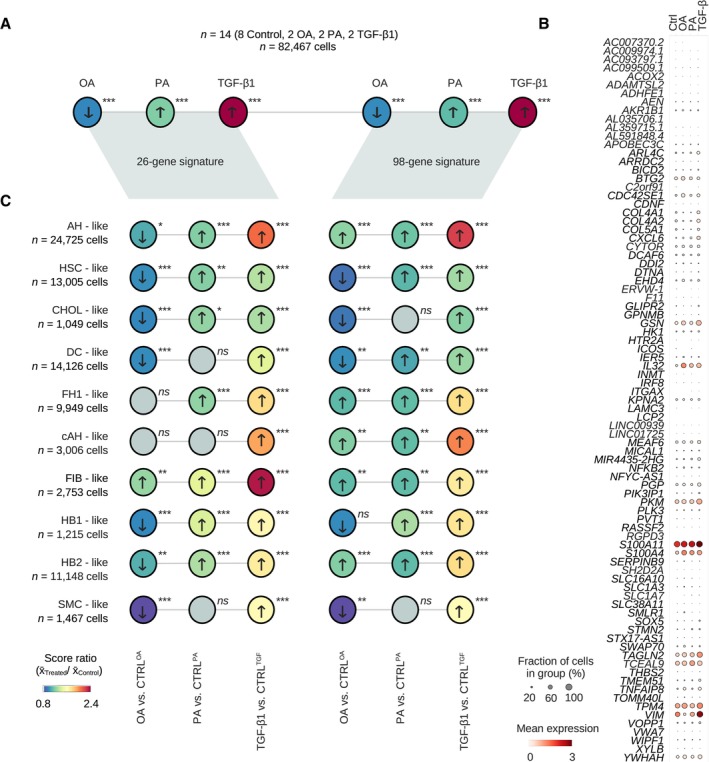
Application of 26 and 98 gene signatures (Pantano et al, 2021) to predict fibrosis stages across MASLD to control and injured OS‐HLOs. Dot plot showing the ratio of the mean gene signature score in treatments and their respective controls. P‐values derived from pairwise Mann–Whitney‐U‐statistics (two‐tailed) comparing scores across all cells in treatment vs. their respective control condition. *P ≤ 0.05; **P ≤ 0.01; ***P ≤ 0.001; ns, non‐significant. All P‐values are provided in the source data of the fig N = 82,467 cells from 14 replicates (n = 2 replicates per condition, n = 8 controls).
Dotplot shows the scaled mean expression of commonly expressed genes from the 98‐signature score across treatment conditions. Dot sizes correspond to the percentage of cells expressing the respective gene in each condition, and the level of expression is indicated by color.
Deconvolution of the scores from (A) to individual cell types as annotated in Fig 4B. Dot plot showing the ratio of the mean gene signature score in treatments and their respective controls. P‐values derived from pairwise Mann–Whitney‐U‐statistics (two‐tailed) comparing scores across all cells of the indicated cell type in treatment vs. their respective control condition. *P ≤ 0.05; **P ≤ 0.01; ***P ≤ 0.001; ns, non‐significant. All P‐values are provided in the source data for the figure. N numbers are indicated below cell cluster names.
References
-
- Anstee QM, Reeves HL, Kotsiliti E, Govaere O, Heikenwalder M (2019) From NASH to HCC: current concepts and future challenges. Nat Rev Gastroenterol Hepatol 16: 411–428 - PubMed
Publication types
MeSH terms
Substances
Associated data
- Actions
Grants and funding
LinkOut - more resources
Full Text Sources
Medical
Molecular Biology Databases
