. 2024 Jan 1;221(1):e20230927.
doi: 10.1084/jem.20230927. Epub 2023 Nov 14.

A partial human LCK defect causes a T cell immunodeficiency with intestinal inflammation

Affiliations

A partial human LCK defect causes a T cell immunodeficiency with intestinal inflammation

Victor G Lui et al. J Exp Med. .

Abstract

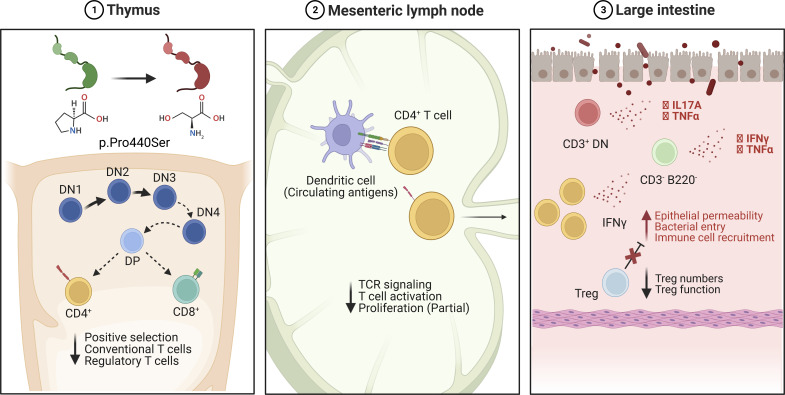
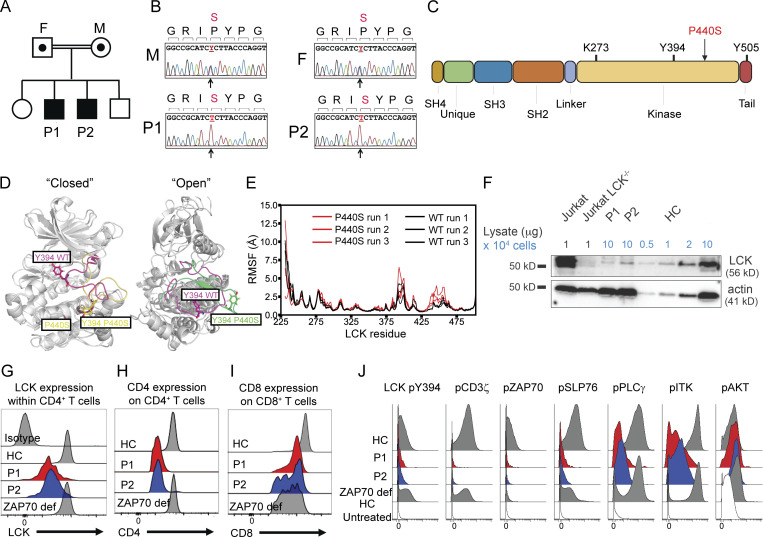
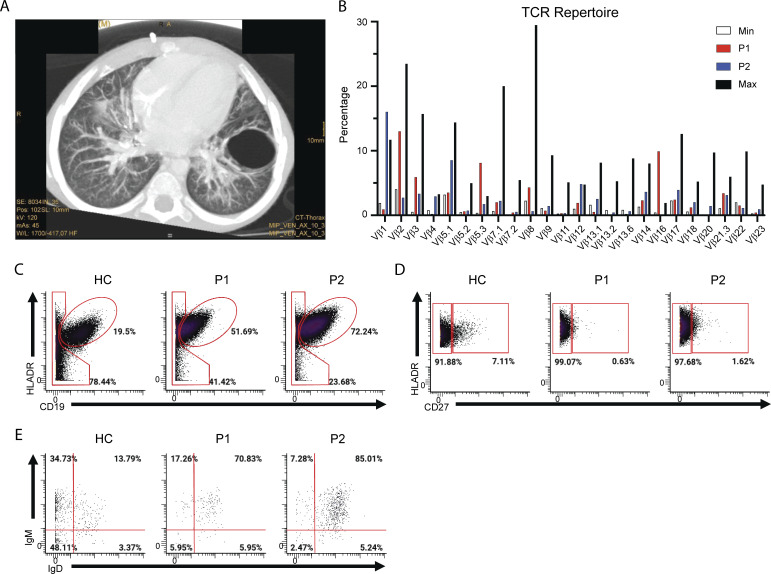
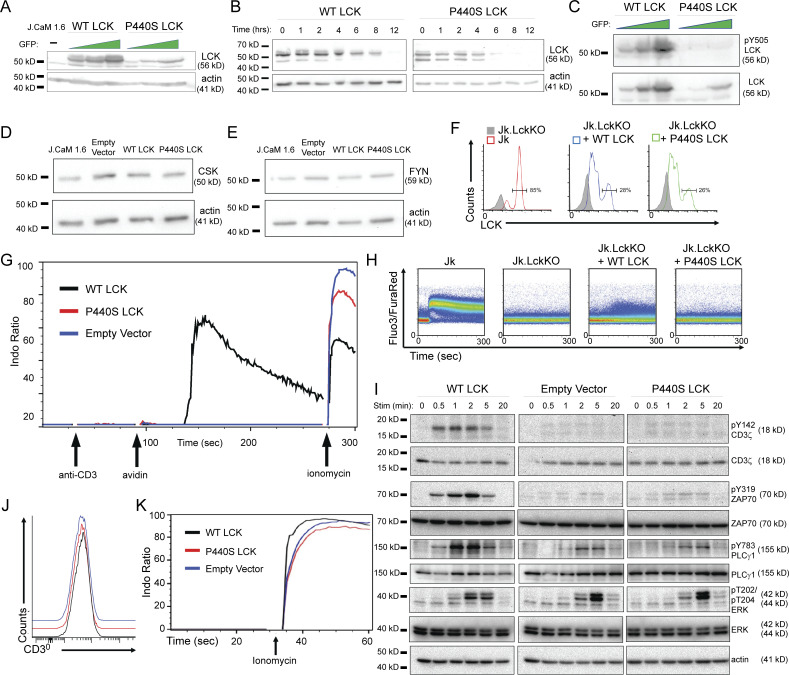
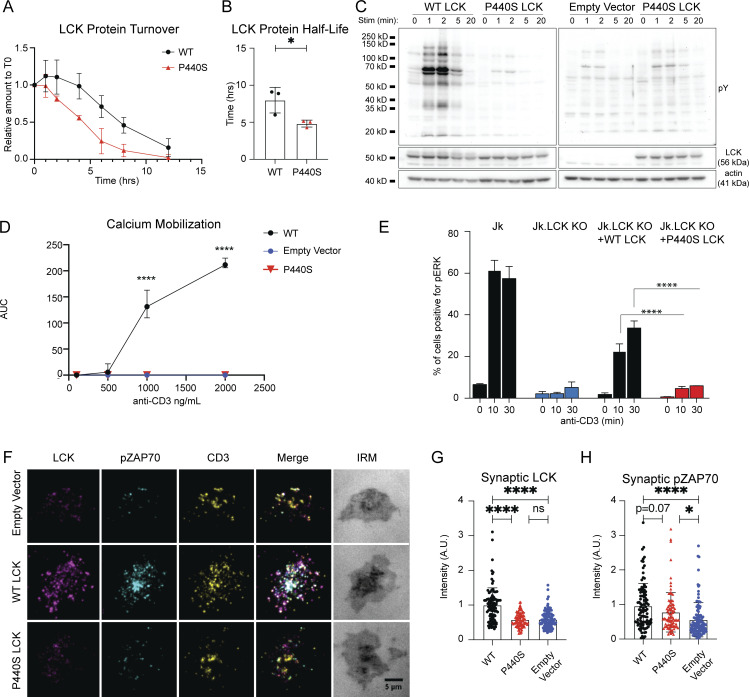
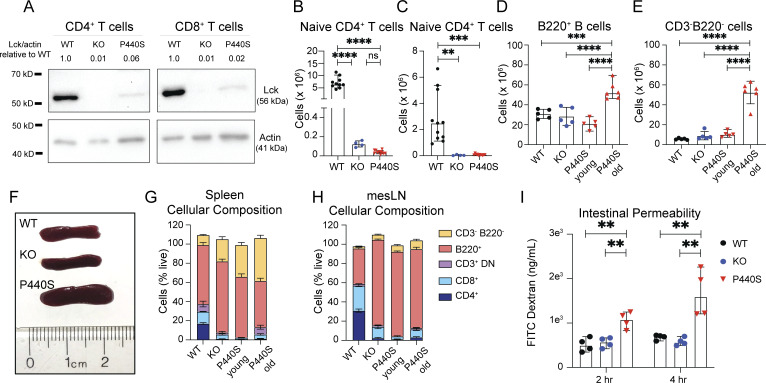
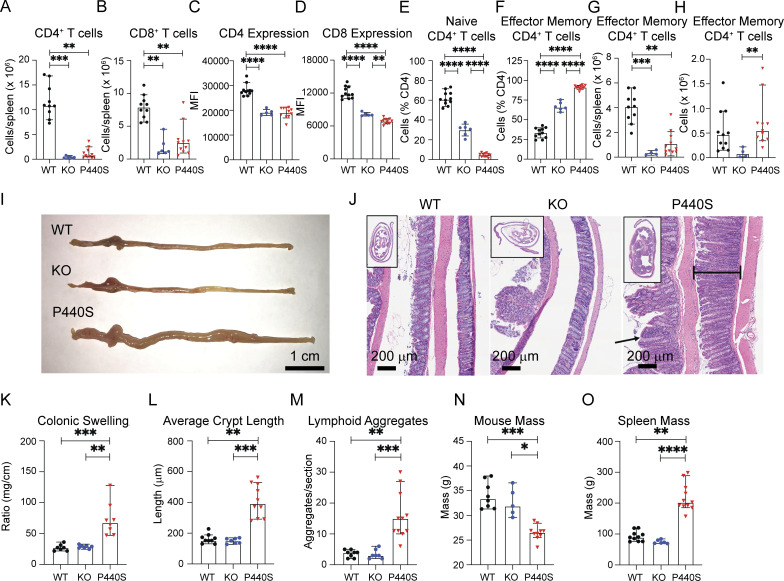
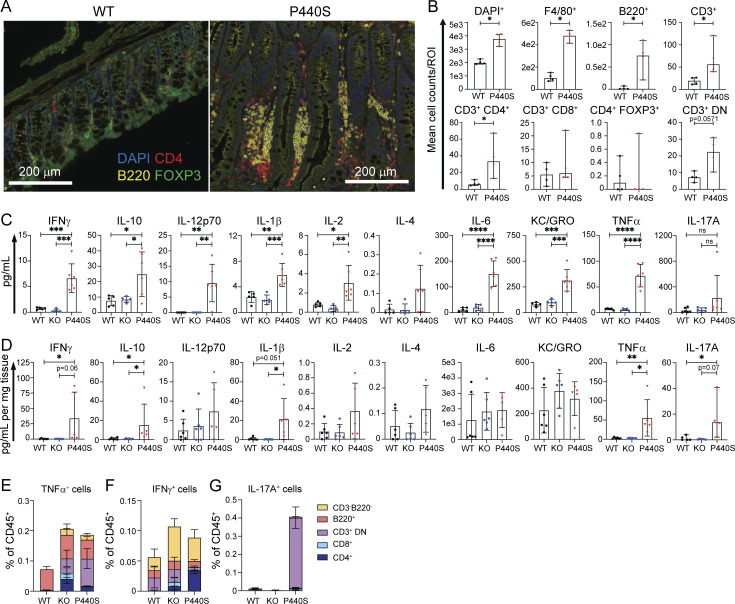
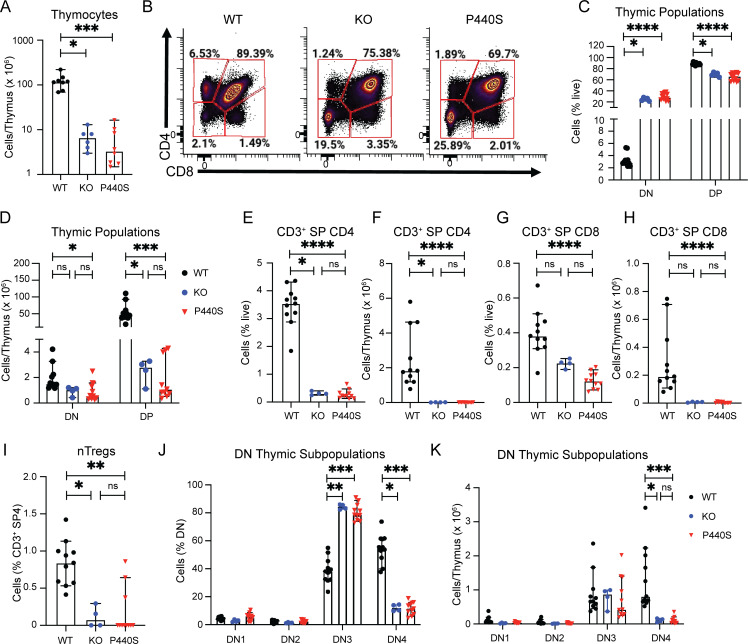
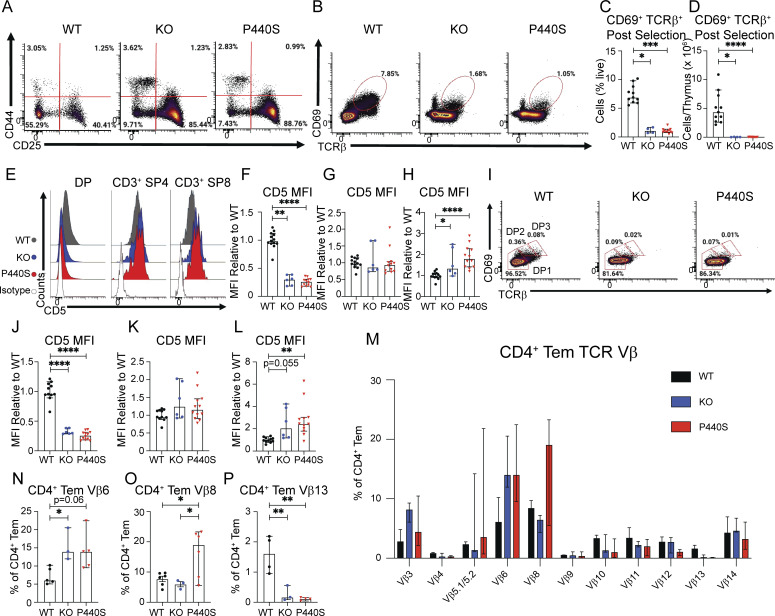
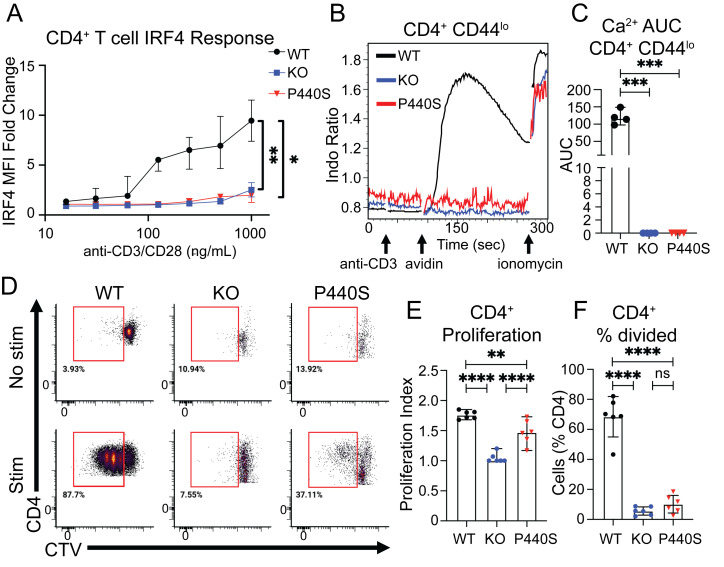
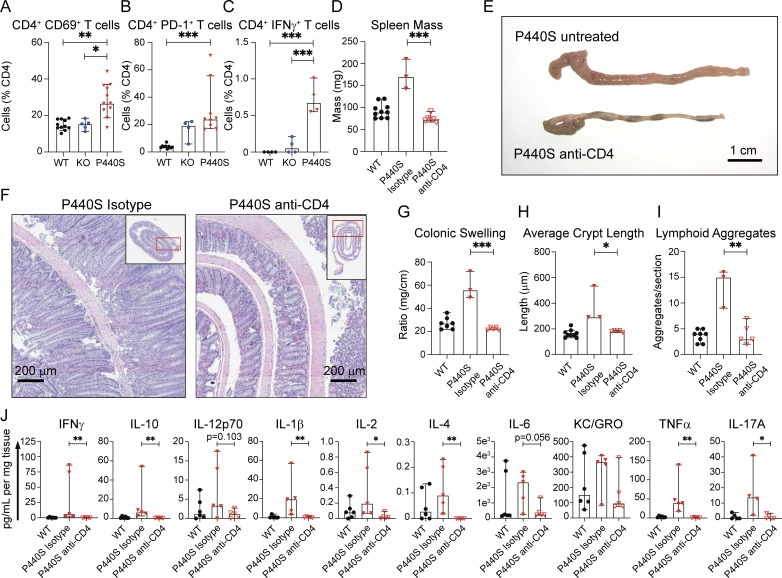
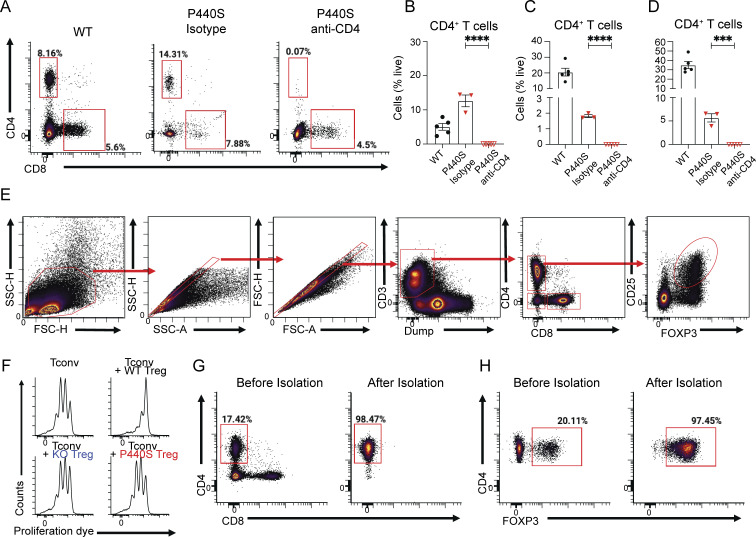
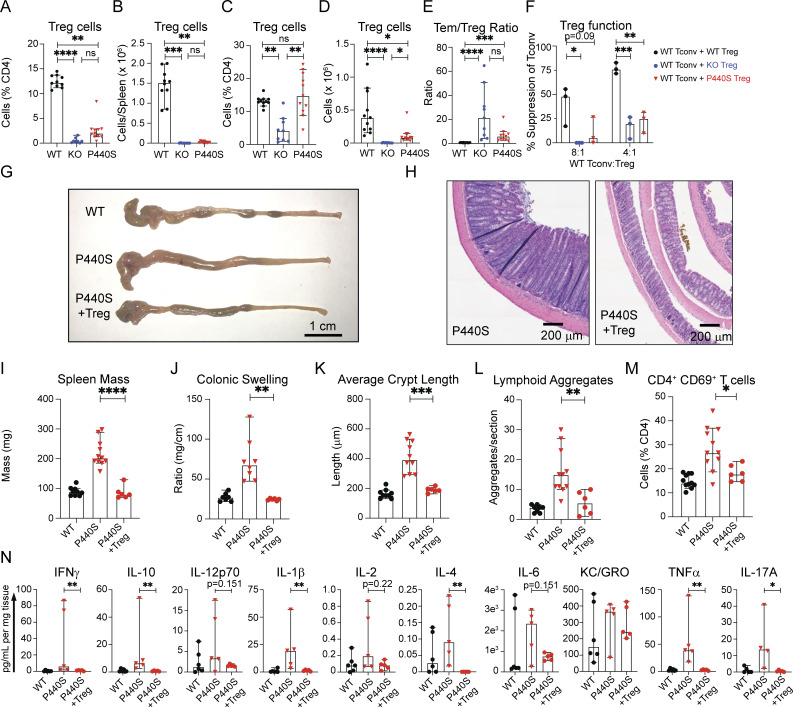
Lymphocyte-specific protein tyrosine kinase (LCK) is essential for T cell antigen receptor (TCR)-mediated signal transduction. Here, we report two siblings homozygous for a novel LCK variant (c.1318C>T; P440S) characterized by T cell lymphopenia with skewed memory phenotype, infant-onset recurrent infections, failure to thrive, and protracted diarrhea. The patients' T cells show residual TCR signal transduction and proliferation following anti-CD3/CD28 and phytohemagglutinin (PHA) stimulation. We demonstrate in mouse models that complete (Lck-/-) versus partial (LckP440S/P440S) loss-of-function LCK causes disease with differing phenotypes. While both Lck-/- and LckP440S/P440S mice exhibit arrested thymic T cell development and profound T cell lymphopenia, only LckP440S/P440S mice show residual T cell proliferation, cytokine production, and intestinal inflammation. Furthermore, the intestinal disease in the LckP440S/P440S mice is prevented by CD4+ T cell depletion or regulatory T cell transfer. These findings demonstrate that P440S LCK spares sufficient T cell function to allow the maturation of some conventional T cells but not regulatory T cells-leading to intestinal inflammation.


Conflict of interest statement

Disclosures: M. Hoenig reported personal fees from Octapharma (scientific board) outside the submitted work. J. Capera reported grants from Cue Biopharma during the conduct of the study. M.L. Dustin reported grants from Cue Biopharma during the conduct of the study. No other disclosures were reported.

Figures

None
Graphical abstract
Figure 1.
Figure 1.
Identification of novel human LCK P440S variant. (A) Pedigree of patients’ families carrying the novel homozygous P440S LCK missense mutation. (B) Sequencing results of the LCK mutation site within parents and patient siblings. (C) Illustration of LCK protein structure. (D) Superimposition of the closed and open forms of WT LCK and P440S LCK. Left panel: Superimposition of the two closed forms; the A-loop regions of WT LCK and P440S LCK in magenta and yellow, respectively. Right panel: Superimposition of the two open forms; the A-loop regions of WT LCK and P440S LCK in magenta and green, respectively. (E) Root mean square fluctuations of the selected residues of WT LCK (black lines) and P440S LCK (red lines) as provided by molecular dynamics simulations. (F) Immunoblot of Jurkat cell lines and sorted CD3+ cells from patient PBMCs. (G) Intracellular flow staining of LCK total protein within patient CD4+ T cells. (H and I) Flow cytometry staining of CD4 and CD8 surface expression on patient T cells. (J) Mass cytometry measurement of intracellular phosphorylated signaling proteins within CD4+ T cells from patient PBMCs treated with pervanadate compared with untreated HC. Source data are available for this figure: SourceData F1.
Figure S1.
Figure S1.
Patient CT scan and TCR repertoire. (A) Bronchiectasis and large bulla in patient P1 CT. (B) Frequency of Vβ usage in patients P1 and P2. (C–E) Frequencies of B cells (CD19+HLADR+) (C) memory B cells (CD19+HLADR+CD27+) (D), and memory B cell subsets (isotype switched memory [IgMIgD], IgM memory [IgM+IgD], pre-switched [IgM+IgD+], c-delta class switched [IgMIgD+]) (E) from mass cytometry immunophenotyping of age-matched HC and patient PBMCs. Percentages of parent gates are shown.
Figure S2.
Figure S2.
P440S LCK cell line supplemental data. (A) Immunoblot of GFP-sorted transduced J.CaM 1.6 cell lines expressing WT or P440S LCK protein. (B–E) Immunoblots of cycloheximide protein stability assay (B), LCK pY505 (C), CSK (D), and FYN (E) on transduced J.CaM 1.6 cell lines. (F) LCK expression in inducible Jurkat cell line expression system upon treatment with doxycycline. (G and H) Calcium mobilization of transduced J.CaM 1.6 cell lines (G) and inducible Jurkat cell line expression system (H) stimulated with anti-CD3. (I) Phospho-specific immunoblots of TCR signaling intermediates at indicated stimulation time points. (J and K) CD3 surface expression (J) and ionomycin-induced calcium response (K) of transduced J.CaM 1.6 cell lines. Source data are available for this figure: SourceData FS2.
Figure 2.
Figure 2.
P440S mutation causes protein instability, decreased protein expression, and defective TCR signaling. (A and B) Protein stability assay (A) and protein half-life (B) of WT and P440S LCK. (C and D) Immunoblot of TCR-mediated global tyrosine phosphorylation (C) and titration curve of TCR-mediated calcium responses (D) of transduced J.CaM 1.6 cell lines. (E) Measurement of TCR-mediated pERK activation in inducible Jurkat cell line expression system. (F–H) Transduced J.CaM 1.6 lines stimulated on SLB visualized by TIRF (F) and measurement of resultant synaptic LCK recruitment (G) and synaptic ZAP70 phosphorylation (H). Data in A–H are representative of results from at least two independent experiments. Experiments in A, B, D, and E have three samples per group. Data points in F–H are measurements of single cells with at least 90 samples per group. Error bars represent mean and SEM. *P < 0.05, ****P < 0.0001. Not significant unless stated by an asterisk in the figure. Unpaired t test was used to test for statistical significance in B and D. Ordinary one-way ANOVA with Tukey’s multiple comparisons test was used to test for statistical significance in E, G, and H. Source data are available for this figure: SourceData F2.
Figure S3.
Figure S3.
P440S Lck mouse phenotype supplemental data. (A) Lck immunoblot on FACS-sorted splenic CD4+ and CD8+ T cells from mice of the indicated genotypes. (B and C) CD62LhiCD44lo naïve CD4+ T cell counts from spleen (B) and mesLN (C). (D and E) Splenic total counts of B cells (B220+) (D) and non-T/B cells (CD3B220) (E) from mice of the indicated genotypes. (F) Image of whole spleens from mice. (G and H) Cellular composition of spleens (G) and mesLN (H) via flow cytometry. (I) FITC-dextran intestinal permeability assay performed on mice. Young P440S mice were 5–6 wk of age. All other mice were 20 wk of age. Experiment in A is representative of results from two independent experiments from pooled mice. Experiments in B and C are representative of results from three independent experiments with 4–11 mice per group. Experiments in D–I are representative of two independent experiments with four to six mice per group. Error bars represent median and 95% CI. **P < 0.01, ***P < 0.001, ****P < 0.0001. Not significant unless stated by asterisk in figure. Ordinary one-way ANOVA with Tukey’s multiple comparisons test was used to test for statistical significance for all experiments. Source data are available for this figure: SourceData FS3.
Figure 3.
Figure 3.
P440S mice phenocopy patients’ T cell phenotype and intestinal inflammation. (A and B) Total numbers of splenic CD4+ (A) and CD8+ (B) T cells from indicated mice. (C and D) Surface expression of CD4 (C) and CD8 (D) on splenic T cells. (E and F) Frequencies of CD62LhiCD44lo naïve (E) and CD62LloCD44hi memory (F) splenic CD4+ T cell subsets. (G and H) Total numbers of CD62LloCD44hi memory CD4+ T cells from spleen (G) and mesLN (H). (I and J) Gross (I) and H&E histological (J) images of large intestines from mice of the indicated genotype. (K) Ratios of colon length and mass (K). (L and M) Average crypt length (L) and number of lymphoid aggregates per histological section (M) from H&E histology. (N and O) Masses of mice (N) and whole spleens (O). Length of the scale bar in I is 1 cm. Length of bars in J is 200 μm. All measurements were taken from mice at 20 wk of age. Experiments in A–O are representative of results from three independent experiments with 5–11 mice per group. Error bars represent the median and 95% CI. *P < 0.05, **P < 0.01, ***P < 0.001, ****P < 0.0001. Not significant unless stated by an asterisk in the figure. Kruskal–Wallis accounting for multiple comparisons was used to test for statistical significance for all experiments.
Figure 4.
Figure 4.
P440S mice intestinal inflammation demonstrates increased T/B lymphoid aggregates and Th-17 skewing. (A and B) Multispectral imaging of large intestines (A) and mean counts of indicated cell type per region of interest (ROI) (B) from WT and P440S mice. (C and D) Cytokine concentration from serum (C) and colon culture supernatants (D). (E–G) Intracellular cytokine staining of dissociated lamina propria cells. All measurements were taken from mice at 20-wk of age. Experiments in A–G are representative of results from two independent experiments with four to six mice per group. The length of bars in A is 200 μm. Error bars represent the median and 95% CI. *P < 0.05, **P < 0.01, ***P < 0.001, ****P < 0.0001. Not significant unless stated by an asterisk in figure. Kruskal–Wallis accounting for multiple comparisons was used to test for statistical significance for all experiments.
Figure 5.
Figure 5.
P440S and KO mice have defective T cell thymic development. (A) Total thymocyte cell counts from mice of the indicated genotypes. (B) Flow staining of thymic cellular subsets, gated on total live thymocytes. (C–H) Frequencies and cell counts for subsets of thymic T cell precursors (CD4CD8 [DN], CD4+CD8+ [DP], CD3+CD4+CD8 [mature SP4], CD3+CD4CD8+ [mature SP8]). (I) Frequency of thymic-derived Tregs (mature SP4 CD25+FOXP3+, nTregs). (J and K) Frequency and counts of thymic DN subpopulations (CD25CD44+ [DN1], CD25+CD44+ [DN2], CD25+CD44 [DN3], CD25CD44 [DN4]). Experiments in A–K are representative of results from three independent experiments with 4–11 mice per group. Error bars represent the median and 95% CI. *P < 0.05, **P < 0.01, ***P < 0.001, ****P < 0.0001. Not significant unless stated by an asterisk in the figure. Kruskal–Wallis accounting for multiple comparisons was used for statistical significance testing for all experiments.
Figure S4.
Figure S4.
P440S Lck thymic development supplemental data. (A) Flow staining of thymic DN subpopulations (CD25CD44+ [DN1], CD25+CD44+ [DN2], CD25+CD44 [DN3], CD25CD44 [DN4]). (B–D) Flow staining (B), frequency (C), and total counts (D) of postselection thymocytes (CD69+TCRβ+), gated on live thymocytes. (E–H) Surface expression of CD5 on subsets of thymic T cell precursors (CD4+CD8+ [DP], CD3+CD4+CD8 [mature SP4], CD3+CD4CD8+ [mature SP8]). (I) Flow staining of DP subpopulations (CD69loTCRβlo [DP1], CD69intTCRβint [DP2], CD69hiTCRβhi [DP3]), all gated on DP thymocytes. (J–L) Surface expression of CD5 on DP1-3 subsets. (M–P) TCR Vβ flow assessment of splenic CD62LloCD44hi CD4+ Tem. Experiments in A–P are representative of results from three independent experiments with 3–12 mice per group. Error bars represent median and 95% CI. *P < 0.05, **P < 0.01, ***P < 0.001, ****P < 0.0001. Not significant unless stated by asterisk in figure. Ordinary one-way ANOVA with Tukey’s multiple comparisons test was used to test for statistical significance for all experiments.
Figure 6.
Figure 6.
CD4+ T cells from P440S mice demonstrate increased proliferation compared to KO mice, despite similar TCR signal transduction profiles. (A) Fold change response of TCR-mediated IRF4 induction was calculated as the mean fluorescence intensity (MFI) ratio of stim/no stim at each concentration of anti-CD3/CD28. (B) TCR-mediated calcium mobilization in splenic CD4+CD44lo T cells. (C) Area under the curve quantitation of the calcium response was calculated for the time between the addition of anti-CD3 and the addition of ionomycin. (D–F) Ex vivo proliferation of CTV-loaded splenocytes stimulated with anti-CD3/CD28. Flow plots are gated on live CD4+ T cells. All experiments were performed on mice 5–6 wk of age. Experiments in A–F are representative of results from three independent experiments with three to six mice per group. Error bars represent mean and SEM. *P < 0.05, **P < 0.01, ***P < 0.001, ****P < 0.0001. Not significant unless stated by asterisk in figure. Ordinary one-way ANOVA with Tukey’s multiple comparisons test was used to test for statistical significance for all experiments.
Figure 7.
Figure 7.
CD4+ T cells initiate intestinal inflammation in P440S mice. (A and B) Frequencies of CD4+CD69+ and CD4+PD-1+ T cells from mesLN. (C) Frequency of IFNγ-producing lamina propria CD4+ T cells. (D) Whole spleen masses from P440S mice that received CD4-depleting mAb (GK1.5 mAb) or isotype mAb. (E and F) Gross (E) and H&E histological (F) images of large intestines from untreated P440S mice, isotype-treated P440S mice, or CD4-depleted P440S mice. (G) Ratios of colon length and mass. (H and I) Average crypt length (H) and number of lymphoid aggregates per histological section (I) from H&E histology. (J) Cytokine concentration from colon culture supernatants. All measurements were taken from mice at 20-wk of age. Length of scale bar in E is 1 cm. Length of bars in F is 200 μm. Experiments in A and B are representative of results from three independent experiments with 4–11 mice per group. Experiments in C–J are representative of results from two independent experiments with 3–10 mice per group. Error bars represent the median and 95% CI. *P < 0.05, **P < 0.01, ***P < 0.001. Not significant unless stated by asterisk in figure. Kruskal–Wallis accounting for multiple comparisons was used for statistical significance testing for experiments in A–C and J. Unpaired t test between P440S (isotype) and P440S (anti-CD4) was used to test for statistical significance for experiments in D and G–I.
Figure S5.
Figure S5.
P440S Lck murine functional supplemental data. (A) Flow staining of lamina propria cells from CD4 depletion experiments (A), gated on live B220 cells. (B–D) Frequencies of CD4+ T cells from lamina propria (B), spleen (C), and mesLN (D) from CD4 depletion experiments. (E) Flow cytometry gating scheme for splenic CD4+CD25+FOXP3+ Tregs. (F) Proliferation dye dilution of WT CD45.1 Tconvs from in vitro Treg suppression assay. (G and H) Flow cytometry staining of FACS-sorted donor WT Tregs that were used for Treg transfer experiments. Experiments in B–D are representative of results from two independent experiments with three to five mice per group. Error bars represent median and 95% CI. ***P < 0.001, ****P < 0.0001. Not significant unless stated by asterisk in figure. Unpaired t test between P440S (isotype) and P440S (anti-CD4) was used to test for statistical significance in B–D.
Figure 8.
Figure 8.
Regulatory T cell deficiency contributes to P440S intestinal inflammation. (A–D) Frequencies and counts of Tregs isolated from spleen (A and B) and mesLN (C and D). (E) Ratios of the percentage of effector memory (CD62LloCD44hi) CD4+ T cell to Tregs from mesLN. (F) In vitro suppression assay of enriched CD4+CD25+ Tregs from mice of the indicated genotypes. Tconv are enriched CD4+CD25 T cells from WT CD45.1 mice. (G and H) Gross (G) and H&E histological (H) images of large intestines from GFP+ WT Treg adoptive transfer experiments. (I) Whole spleen masses from GFP+ WT Treg adoptive transfer experiments. (J) Ratios of colon length and mass. (K and L) Average crypt length (K) and number of lymphoid aggregates per histological section (L) from H&E histology. (M) Frequencies of endogenous (GFP) CD4+CD69+ T cells in mesLN from Treg adoptive transfer experiments. (N) Cytokine concentration from colon culture supernatants. All measurements were taken from mice at 20-wk of age. The length of the scale bar in G is 1 cm. The length of bars in H is 200 μm. Experiments in A–F are representative of results from three independent experiments with 3–11 mice per group. Experiments in G–N are representative of results from two independent experiments with 4–11 mice per group. Error bars represent the median and 95% CI. *P < 0.05, **P < 0.01, ***P < 0.001, ****P < 0.0001. Not significant unless stated by an asterisk in the figure. Kruskal–Wallis accounting for multiple comparisons was used for statistical significance testing in N. Ordinary one-way ANOVA with Tukey’s multiple comparisons test was used to test for statistical significance in A–F. Unpaired t test between P440S and P440S (+Treg) was used to test for statistical significance in I–M.

Similar articles

Cited by

  • Lck Function and Modulation: Immune Cytotoxic Response and Tumor Treatment More Than a Simple Event.
    De Sanctis JB, Garmendia JV, Duchová H, Valentini V, Puskasu A, Kubíčková A, Hajdúch M. De Sanctis JB, et al. Cancers (Basel). 2024 Jul 24;16(15):2630. doi: 10.3390/cancers16152630. Cancers (Basel). 2024. PMID: 39123358 Free PMC article. Review.
  • Helper T cell immunity in humans with inherited CD4 deficiency.
    Guérin A, Moncada-Vélez M, Jackson K, Ogishi M, Rosain J, Mancini M, Langlais D, Nunez A, Webster S, Goyette J, Khan T, Marr N, Avery DT, Rao G, Waterboer T, Michels B, Neves E, Iracema Morais C, London J, Mestrallet S, Quartier Dit Maire P, Neven B, Rapaport F, Seeleuthner Y, Lev A, Simon AJ, Montoya J, Barel O, Gómez-Rodríguez J, Orrego JC, L'Honneur AS, Soudée C, Rojas J, Velez AC, Sereti I, Terrier B, Marin N, García LF, Abel L, Boisson-Dupuis S, Reis J, Marinho A, Lisco A, Faria E, Goodnow CC, Vasconcelos J, Béziat V, Ma CS, Somech R, Casanova JL, Bustamante J, Franco JL, Tangye SG. Guérin A, et al. J Exp Med. 2024 May 6;221(5):e20231044. doi: 10.1084/jem.20231044. Epub 2024 Apr 1. J Exp Med. 2024. PMID: 38557723 Free PMC article.
  • SMAD4 Regulates the Expression of LCK Affecting Chimeric Antigen Receptor-T Cells Proliferation Through PI3K/Akt Signaling Pathway.
    Wan R, Fu B, Fu X, Liu Z, Simayi N, Fu Y, Liang H, Li C, Huang W. Wan R, et al. J Cell Physiol. 2025 Jan;240(1):e31520. doi: 10.1002/jcp.31520. J Cell Physiol. 2025. PMID: 39763264 Free PMC article.
  • Disrupting the balance between activating and inhibitory receptors of γδT cells for effective cancer immunotherapy.
    Beringer DX, Straetemans T, Minguet S, Riillo C, Lynch L, Sebestyen Z, Kuball J. Beringer DX, et al. Nat Rev Cancer. 2025 Aug;25(8):590-612. doi: 10.1038/s41568-025-00830-x. Epub 2025 Jun 2. Nat Rev Cancer. 2025. PMID: 40456901 Review.
  • Immunopathological and microbial signatures of inflammatory bowel disease in partial RAG deficiency.
    Castagnoli R, Pala F, Subramanian P, Oguz C, Schwarz B, Lim AI, Burns AS, Fontana E, Bosticardo M, Corsino C, Angelova A, Delmonte OM, Kenney H, Riley D, Smith G, Ott de Bruin L, Oikonomou V, Dos Santos Dias L, Fink D, Bohrnsen E, Kimzey CD, Marseglia GL, Alva-Lozada G, Bergerson JRE, Brett A, Brigatti KW, Dimitrova D, Dutmer CM, Freeman AF, Ale H, Holland SM, Licciardi F, Pasic S, Poskitt LE, Potts DE, Dasso JF, Sharapova SO, Strauss KA, Ward BR, Yilmaz M, Kuhns DB, Lionakis MS, Daley SR, Kong HH, Segre JA, Villa A, Pittaluga S, Walter JE, Vujkovic-Cvijin I, Belkaid Y, Notarangelo LD. Castagnoli R, et al. J Exp Med. 2025 Aug 4;222(8):e20241993. doi: 10.1084/jem.20241993. Epub 2025 May 2. J Exp Med. 2025. PMID: 40314722

References

    1. Abraham, N., and Veillette A.. 1990. Activation of p56lck through mutation of a regulatory carboxy-terminal tyrosine residue requires intact sites of autophosphorylation and myristylation. Mol. Cell. Biol. 10:5197–5206. 10.1128/MCB.10.10.5197 - DOI - PMC - PubMed
    1. Abraham, N., Miceli M.C., Parnes J.R., and Veillette A.. 1991. Enhancement of T-cell responsiveness by the lymphocyte-specific tyrosine protein kinase p56lck. Nature. 350:62–66. 10.1038/350062a0 - DOI - PubMed
    1. Amrein, K.E., and Sefton B.M.. 1988. Mutation of a site of tyrosine phosphorylation in the lymphocyte-specific tyrosine protein kinase, p56lck, reveals its oncogenic potential in fibroblasts. Proc. Natl. Acad. Sci. USA. 85:4247–4251. 10.1073/pnas.85.12.4247 - DOI - PMC - PubMed
    1. Arnaiz-Villena, A., Timon M., Corell A., Perez-Aciego P., Martin-Villa J.M., and Regueiro J.R.. 1992. Brief report: Primary immunodeficiency caused by mutations in the gene encoding the CD3-gamma subunit of the T-lymphocyte receptor. N. Engl. J. Med. 327:529–533. 10.1056/NEJM199208203270805 - DOI - PubMed
    1. Arpaia, E., Shahar M., Dadi H., Cohen A., and Roifman C.M.. 1994. Defective T cell receptor signaling and CD8+ thymic selection in humans lacking zap-70 kinase. Cell. 76:947–958. 10.1016/0092-8674(94)90368-9 - DOI - PubMed

Substances