. 2024 Feb 29;194(3):1646-1661.
doi: 10.1093/plphys/kiad607.

Chloroplast phosphate transporter CrPHT4-7 regulates phosphate homeostasis and photosynthesis in Chlamydomonas

Affiliations

Chloroplast phosphate transporter CrPHT4-7 regulates phosphate homeostasis and photosynthesis in Chlamydomonas

Dávid Tóth et al. Plant Physiol. .

Abstract

In eukaryotic cells, phosphorus is assimilated and utilized primarily as phosphate (Pi). Pi homeostasis is mediated by transporters that have not yet been adequately characterized in green algae. This study reports on PHOSPHATE TRANSPORTER 4-7 (CrPHT4-7) from Chlamydomonas reinhardtii, a member of the PHT4 transporter family, which exhibits remarkable similarity to AtPHT4;4 from Arabidopsis (Arabidopsis thaliana), a chloroplastic ascorbate transporter. Using fluorescent protein tagging, we show that CrPHT4-7 resides in the chloroplast envelope membrane. Crpht4-7 mutants, generated by the CRISPR/Cas12a-mediated single-strand templated repair, show retarded growth, especially in high light, reduced ATP level, strong ascorbate accumulation, and diminished non-photochemical quenching in high light. On the other hand, total cellular phosphorous content was unaffected, and the phenotype of the Crpht4-7 mutants could not be alleviated by ample Pi supply. CrPHT4-7-overexpressing lines exhibit enhanced biomass accumulation under high light conditions in comparison with the wild-type strain. Expressing CrPHT4-7 in a yeast (Saccharomyces cerevisiae) strain lacking Pi transporters substantially recovered its slow growth phenotype, demonstrating that CrPHT4-7 transports Pi. Even though CrPHT4-7 shows a high degree of similarity to AtPHT4;4, it does not display any substantial ascorbate transport activity in yeast or intact algal cells. Thus, the results demonstrate that CrPHT4-7 functions as a chloroplastic Pi transporter essential for maintaining Pi homeostasis and photosynthesis in C. reinhardtii.


Conflict of interest statement

Conflict of interest statement. None declared.

Figures
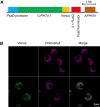
Figure 1.
Figure 1.
CrPHT4-7 is found in the chloroplast envelope membrane. A) Map of the pLM005-CrPHT4-7 plasmid expressing a Venus-tagged CrPHT4-7 version. B) Representative fluorescence microscopic images of the UVM11 strain (upper row) and the UVM11 strain expressing pLM005-CrPHT4-7 with Venus-3×FLAG (lower row). Venus fluorescence and Chl auto-fluorescence were detected between 520 and 540 nm and 650 and 750 nm, respectively. The merged Venus + Chl fluorescence image is also shown. Scale bar: 5 μm, applicable to all images.
Figure 2.
Figure 2.
pht4-7 mutants generated via the CRISPR/Cas12a technique exhibit diminished fitness. A) Physical map of CrPHT4-7 (obtained from Phytozome, v. 13) with the replacement sequence including a stop codon, and a PAM sequence in the third exon in the Crpht4-7#7 and #9 mutants. Exons are shown as blue boxes, introns as black lines, and promoter/5′ UTR and terminator sequences as green boxes. B) Prediction of transmembrane helices of CrPHT4-7 by Deep TMHMM v. 1.0.24. The introduction of the stop codon prevents the translation of at least 6 transmembrane helices. C) Culture growth of pht4-7 mutants and the CC-1883 wild type, in TAP medium in continuous illumination of 60 µmol photons m−2 s−1 at 23 °C, bubbled with air for 72 h in a Multi-Cultivator photobioreactor. The initial Chl content was set to 0.5 µg Chl(a + b)/mL. D) Culture growth in TAP medium under continuous illumination of 350 µmol photons m−2 s−1 at 23 °C, bubbled with air for 72 h in a Multi-Cultivator photobioreactor. The initial Chl content was set to 0.5 µg Chl(a + b)/mL. A photograph of an aliquot of the cultures after 72 h of growth is shown in the inset. E) Cell numbers at 60 and 350 µmol photons m−2 s−1 after 72 h of growth. F) Cell sizes at 60 and 350 µmol photons m−2 s−1. G) Chl(a + b) contents after 72 h of growth at 60 and 350 µmol photons m−2 s−1 in a photobioreactor. H)FV/FM values after 72 h of growth at 60 and 350 µmol photons m−2 s−1. The averages and standard errors presented in panels C) to F) are based on 3 to 5 independent experiments with 2 to 6 biological replicates in each. The significance of differences between means was determined by ANOVA with Tukey post hoc test. The means with different letters are significantly different (P < 0.05).
Figure 3.
Figure 3.
The pht4-7 mutation leads to strong ascorbate (Asc) accumulation at high light and does not affect chloroplastic Asc uptake. A) Asc content of the pht4-7 mutants and the CC-1883 strain after 72 h of growth in TAP medium at 80 and 500 µmol photons m−2 s−1. B) Fast Chl a fluorescence (OJIP) transients measured with or without 20 mm of Asc on cultures grown at 80 µmol photons m−2 s−1. The cultures were grown in Erlenmeyer flasks. The averages and standard errors are based on 3 to 6 independent experiments with 2 to 4 biological replicates in each. The significance of differences between means was determined by ANOVA with Tukey post hoc test. The means with different letters are significantly different (P < 0.05).
Figure 4.
Figure 4.
The pht4-7 mutation alters photosynthetic redox homeostasis. A) NPQ of cultures grown in TAP medium at 80 µmol photons m−2 s−1. B) NPQ of cultures grown in TAP medium at 500 µmol photons m−2 s−1. For NPQ induction in panels A) and B), light adaptation consisted of 30 min illumination at 532 µmol photons m−2 s−1, followed by 12 min of dark adaptation interrupted with saturating pulses of 3,000 µmol photons m−2 s−1. C) State transition (qT, see details in the Materials and methods section and typical kinetics in Supplemental Fig. S6). D) Total phosphorous content. E) Cellular ATP content. F) Total proton motive force, determined based on the absorbance change at 515 nm against the 535 nm reference wavelength, expressed in ΔI/I units. All the cultures were grown in Erlenmeyer flasks. The averages and standard errors are based on 3 to 12 independent experiments with 1 to 2 biological replicates in each. The significance of differences between means was determined by ANOVA with Tukey post hoc test. The means with different letters are significantly different (P < 0.05). In the cases of panels A) and B), significance was calculated at the end of the illumination period. In panel C), each mutant was compared to its own wild type. DW, dry weight.
Figure 5.
Figure 5.
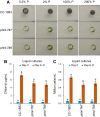
The effects of phosphorous deprivation on the wild type and the pht4-7 mutants. A) Growth test of pht4-7 mutants and the wild-type strain on TAP agar plates containing different amounts of phosphorous; the photos were taken after 6 d. B) Chl(a + b) contents at the beginning (Day 0) and after 6 d phosphorous deprivation (Day 6—P). C) Cell numbers at the beginning and after 6 d phosphorous deprivation. In panels B) and C), liquid cultures were grown in Erlenmeyer flasks at 80 µmol photons m−2 s−1. The averages and standard errors are based on 5 to 10 independent experiments with 1 to 2 biological replicates in each. The significance of differences between means was determined by ANOVA with Tukey post hoc test. The means with different letters are significantly different (P < 0.05).
Figure 6.
Figure 6.
Alterations in photosynthetic activity upon phosphorous limitation. A)FV/FM values of cultures grown in TAP for 6 d, and in TAP medium containing 0.5% P of regular TAP. For recovery, cultures were transferred to regular TAP media for 1 d. B) Fast Chl a fluorescence (OJIP) transients. C) NPQ (induced at 532 µmol photons m−2 s−1) of cultures grown in regular TAP medium, and in 0.5% P containing TAP medium for 6 d. D) Total cellular Asc contents. All the cultures were grown in Erlenmeyer flasks at 80 µmol photons m−2 s−1. The same Chl(a + b) amounts were set for the Chl a fluorescence measurements. The averages and standard errors are based on 3 to 5 independent experiments with 1 to 2 biological replicates in each. The significance of differences between means was determined by ANOVA with Tukey post hoc test. The means with different letters are significantly different (P < 0.05). In the case of panel C), significance was calculated at the end of the illumination period.
Figure 7.
Figure 7.
Overexpressing CrPHT4-7 in CC-1883 leads to improved growth in high light. A) Map of the pJR101 plasmid containing the coding sequence of CrPHT4-7, the strong PSAD promoter, the APHVIII resistance gene, and the PSAD terminator. B) Chl(a + b) contents of CC-1883, pht4-7 mutants, and several randomly selected pht4-7-overexpressing lines after 3 d of growth at 500 µmol photons m−2 s−1 in TAP medium in Erlenmeyer flasks. C)PHT4-7 transcript abundance in CC-1883 and the selected pht4-7-overexpressing lines (OE#3, OE#10, OE#14) D), FV/FM values measured on the same cultures. The averages and standard errors are based on 3 to 6 independent experiments with 2 to 6 replicates in each. The significance of differences between means was determined by ANOVA with Dunnett’s post hoc test. Asterisks indicate significantly different means (P < 0.05) compared to the control strain CC-1883.
Figure 8.
Figure 8.
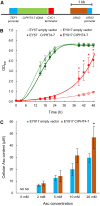
CrPHT4-7 transports phosphate in a yeast experimental system. A) Physical map of the construct for heterologous complementation. B) Growth rates of strain EY57 and the phosphate-transporter-deficient strain EY917 expressing the empty vector or CrPHT4-7. C) Uptake of ascorbate (Asc) into yeast cells expressing CrPHT4-7 in comparison to the control strain. The cultures were incubated with 0, 2, 5, 10, and 20 mm Asc for 15 min. The averages and standard errors are based on 3 to 4 independent experiments. Data were analyzed by Welch's unpaired t-test. Asterisks indicate significantly different means (P < 0.05) compared to the respective empty vector-containing strain. ND, non-detectable.

Similar articles

Cited by

References

    1. Bonente G, Pippa S, Castellano S, Bassi R, Ballottari M. Acclimation of Chlamydomonas reinhardtii to different growth irradiances. J Biol Chem. 2012:287(8):5833–5847. 10.1074/jbc.M111.304279 - DOI - PMC - PubMed
    1. Bonnot C, Proust H, Pinson B, Colbalchini FPL, Lesly-Veillard A, Breuninger H, Champion C, Hetherington AJ, Kelly S, Dolan L. Functional PTB phosphate transporters are present in streptophyte algae and early diverging land plants. New Phytol. 2017:214(3):1158–1171. 10.1111/nph.14431 - DOI - PubMed
    1. Carstensen A, Herdean A, Birkelund Schmidt S, Sharma A, Spetea C, Pribil M, Husted S. The impacts of phosphorus deficiency on the photosynthetic electron transport chain. Plant Physiol. 2018:177(1):271–284. 10.1104/pp.17.01624 - DOI - PMC - PubMed
    1. Chang MX, Gu M, Xia YW, Dai XL, Dai CR, Zhang J, Wang SC, Qu HY, Yamaji N, Feng Ma J, et al. . OsPHT1;3 mediates uptake, translocation, and remobilization of phosphate under extremely low phosphate regimes. Plant Physiol. 2019:179(2):656–670. 10.1104/pp.18.01097 - DOI - PMC - PubMed
    1. Corpet F. Multiple sequence alignment with hierarchical clustering. Nucl Acids Res. 1988:16(22):10881–10890. 10.1093/nar/16.22.10881 - DOI - PMC - PubMed