. 2024 Jan 16;134(2):e170859.
doi: 10.1172/JCI170859.

The pan-microbiome profiling system Taxa4Meta identifies clinical dysbiotic features and classifies diarrheal disease

Affiliations

The pan-microbiome profiling system Taxa4Meta identifies clinical dysbiotic features and classifies diarrheal disease

Qinglong Wu et al. J Clin Invest. .

Abstract

Targeted metagenomic sequencing is an emerging strategy to survey disease-specific microbiome biomarkers for clinical diagnosis and prognosis. However, this approach often yields inconsistent or conflicting results owing to inadequate study power and sequencing bias. We introduce Taxa4Meta, a bioinformatics pipeline explicitly designed to compensate for technical and demographic bias. We designed and validated Taxa4Meta for accurate taxonomic profiling of 16S rRNA amplicon data acquired from different sequencing strategies. Taxa4Meta offers significant potential in identifying clinical dysbiotic features that can reliably predict human disease, validated comprehensively via reanalysis of individual patient 16S data sets. We leveraged the power of Taxa4Meta's pan-microbiome profiling to generate 16S-based classifiers that exhibited excellent utility for stratification of diarrheal patients with Clostridioides difficile infection, irritable bowel syndrome, or inflammatory bowel diseases, which represent common misdiagnoses and pose significant challenges for clinical management. We believe that Taxa4Meta represents a new "best practices" approach to individual microbiome surveys that can be used to define gut dysbiosis at a population-scale level.

Keywords: Bacterial infections; Gastroenterology; Infectious disease.


Conflict of interest statement

Conflict of interest: TCS and QW are inventors on patent applications WO2020061325A1 and WO2023192815A2 covering methods to diagnose C. difficile infection and diarrheal disease using stool microbiome biomarkers. TCS received research funding from Merck, Nivalis, Cubist, Mead Johnson, Rebiotix, BioFire, and Assembly BioSciences and has served on the advisory board for Rebiotix and BioFire.

Figures

Figure 1
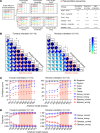
Figure 1. Influence of 16S amplicon sequence length, orientation, and variable region on taxonomic and clustering accuracy.
Simulated 16S sequences of variable length were generated from known input taxa (ground truth) in the NCBI 16S RefSeq database. Taxonomic annotation was determined for accuracy from simulated reads using the BLCA tool. Confidence scores from the data output were used for statistical calculations. (A) Schematic representation showing how increasing amplicon length improves taxonomic accuracy. (B) Spearman correlations of VSEARCH-based de novo clustering with 99% similarity for 16S V1–V3 amplicons of varying length derived from the same parent 16S sequence. The optimal sequence length range for clustering is highlighted (orange boxes). Results for other 16S variable regions are presented in Supplemental Figure 1, and Spearman correlation results for other clustering/denoising tools are provided in Supplemental Table 2. (C and D) Both the confidence score and accuracy of taxonomic assignment for simulated amplicons are significantly affected by sequence length and orientation. Supplemental Figure 3 provides additional results for other 16S variable regions. “Org.” denotes the original amplicon length without trimming. Statistical analysis indicates a significant difference (P < 0.05, Wilcoxon test) between correct and incorrect genus/species annotations at each amplicon length.
Figure 2
Figure 2. Taxa4Meta-based taxonomic profiling of 16S amplicon data.
(A) Schematic of the Taxa4Meta analysis workflow. (B) Spearman correlations for family abundances, comparing simulated 16S data input (ground truth) with taxonomic output generated by different taxonomic profilers covering a range of 16S variable regions. Additional benchmarking results for simulated data are presented in Supplemental Figure 5. (C) Taxa4Meta abundance profiles exhibit the highest similarity to WGS data, specifically Kraken2 family profiles. To quantify the similarity, an abundance-weighted Jaccard distance was calculated between 16S profiler-specific outputs and the gold standard WGS (Kraken2). For visualization and benchmarking, the most abundant 29 family features (totaling 0.95 ± 0.07 [SD] of family abundance) across all analyses were used.
Figure 3
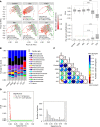
Figure 3. Pan-microbiome analysis identifying diarrheal disease-specific taxa.
(A) β-Diversity analysis of collapsed Taxa4Meta species profiles, where the green ellipse represents the healthy-associated microbiome and the red ellipse represents the CDI-associated microbiome. Each point corresponds to a patient sample, and ANOSIM testing was used to compare disease versus controls using 999 permutations. The abundance-weighted Jaccard distance metric was used for β-diversity analysis. The relative abundance of pathobiome taxa, including Enterococcus, Streptococcus, Clostridioides, Escherichia/Shigella, Klebsiella, and Pseudomonas, was significantly higher in patients with CD and CDI. Statistical significance was determined using a pairwise Wilcoxon test with Benjamini-Hochberg correction (***P < 0.001). (B) Average family relative abundance of each disease group. The top 21 family abundances across data sets are presented in Supplemental Figure 10. Statistical analysis shows significant differences (*P < 0.05) between disease groups, as determined by Kruskal-Wallis test with Benjamini-Hochberg correction. (C) Kullback-Leibler divergence analysis was used to identify pathobiome abundance differences across the diarrheal disease cohorts. Pathobiome data in each group were normalized using total sum scaling. KL divergence was calculated between 2 subdistributions using the total distribution (from all 6 groups) as the background distribution. (D) Abundance-based correlation analysis between each species and its parent genus. Only classified species were included in the correlation analysis. A Spearman ρ value of 1 indicates the detection of a single species representing the entire parent genus.
Figure 4
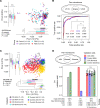
Figure 4. Supervised classification achieved by pan-microbiome profiling.
(A) β-Diversity analysis of collapsed Taxa4Meta species profiles for V1–V3 and V3–V5 amplicon data generated from the same DNA extracts. The pairwise Wilcoxon test with Benjamini-Hochberg correction shows that the difference between the 2 groups is not significant. (B) Receiver operating characteristic (ROC) analysis of supervised classification using 16S region–specific versus pan-microbiome genera. The random forest trainer was used for supervised classification analysis, and the roc.test function from the pROC package was used for comparison of ROC curves. Statistical significance was determined using DeLong testing (**P < 0.01). (C) β-Diversity analysis of multiple CDI cohorts (training data sets 22–27) using collapsed Taxa4Meta species profiles. The pairwise Wilcoxon test with Benjamini-Hochberg correction shows that the difference between the disease and control groups is significant (***P < 0.001). (D) Improved cross-validation of CDI and control subjects using pan-microbiome profiles of 454 and Illumina data. Ten iterations of random, stratified subsampling of training sets were performed, and the random forest trainer was used for supervised classification analysis. The pairwise Wilcoxon test with Benjamini-Hochberg correction shows that the difference between the 2 groups is not significant. Data are presented as mean ± SD. Area under the curve (AUC) and classification accuracy (CA) were calculated, and the ANOSIM test was performed with 999 permutations.
Figure 5
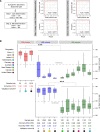
Figure 5. Pan-microbiome diagnostic workflow for differentiating C. difficile infection, inflammatory bowel disease, and irritable bowel syndrome patients.
(A) Binary classification models for CDI stratification (step 1) and IBD determination (step 2) using the microbiome training data sets from CDI, IBD, and IBS cohorts. All collapsed Taxa4Meta species features were utilized in training the classifier models. (B) Independent cohort validation of diarrheal classification models. The CDI score indicates the predictive score of the sample as a CDI case from the step 1 model, whereas the IBD score denotes the predictive score of the sample as an IBD case from the step 2 model. A binary threshold of 0.5 was applied for calculating disease classification accuracy. Statistical significance was determined using the pairwise Wilcoxon test with Benjamini-Hochberg correction (***P < 0.001). Cohort information of training and validation data sets is provided in Supplemental Table 3.

Similar articles

Cited by

References

    1. Quigley EMM. Gut microbiome as a clinical tool in gastrointestinal disease management: are we there yet? Nat Rev Gastroenterol Hepatol. 2017;14(5):315–320. doi: 10.1038/nrgastro.2017.29. - DOI - PubMed
    1. Shanahan F, et al. The healthy microbiome—what is the definition of a healthy gut microbiome? Gastroenterology. 2021;160(2):483–494. doi: 10.1053/j.gastro.2020.09.057. - DOI - PubMed
    1. Blaser M, et al. The microbiome explored: recent insights and future challenges. Nat Rev Microbiol. 2013;11(3):213–217. doi: 10.1038/nrmicro2973. - DOI - PubMed
    1. Duan R, et al. Alterations of gut microbiota in patients with irritable bowel syndrome based on 16S rRNA-targeted sequencing: a systematic review. Clin Transl Gastroenterol. 2019;10(2):e00012. doi: 10.14309/ctg.0000000000000012. - DOI - PMC - PubMed
    1. Pittayanon R, et al. Differences in gut microbiota in patients with vs without inflammatory bowel diseases: a systematic review. Gastroenterology. 2020;158(4):930–946. doi: 10.1053/j.gastro.2019.11.294. - DOI - PubMed

Substances